SandP 500 E-Mini Futures D CME Updated 12/19/2016Price has continued to stall in this area, with 2275 as current resistance point. Look for price to break out.
Medianlines

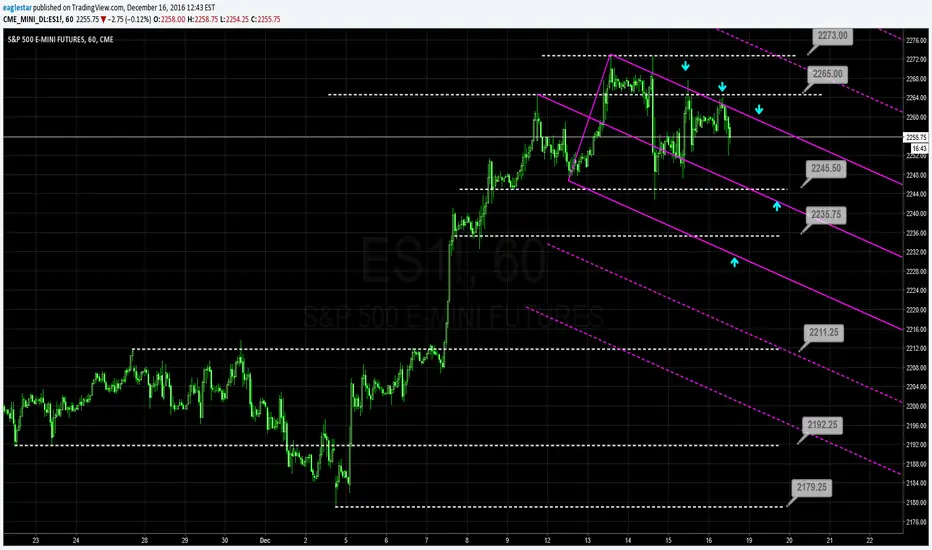
SandP 500 E-Mini Futures 60 CME Updated 12/16/2016Price has come down and retest 2265 and also has created a new down sloping Andrews Pitchfork. Look for price to follow down again to 2245 and if it break lower we could see the bottom of the pitchfork tested.
SandP 500 E-Mini Futures 240 CME Updated 12/16/2016Price has started to drop from high near 2273 at a double top. Look for price to come back to retest 2245 area as marked yesterday and form a base. If it breaks you have 2233 and 2211 area respectively.

SandP 500 E-Mini Futures D CME Updated 12/16/2016Price is holding at 2272 areas. Look for price to drop to 2211 area if we hold resistance here as that is last minor resistance area. I have added a yellow ar set to show that there are multiple areas for resistance at this point

SandP 500 E-Mini Futures D CME Updated 12/15/16Price is holding near 2272 area which news taking some time to settle in on the market. The current sliding parallel I have found needs to be broken in order for price to continue its momentum.

SandP 500 E-Mini Futures 240 CME Updated 12/15/2016Price fell to 2245 area and is bouncing, still on an upward climb. The loose double tops has me a bit worried, but i think we may see another move higher. Look to see if we can break 2273, if not look for 2211 on the down side and maybe minor support at 2232 area.

SandP 500 E-Mini Futures 60 CME Updated 12/15/2016Price came down and touched support at 2245. Look at 2265 which is holding as minor resistance today. Price is in consolidation, digesting the recent interest rate rise to .75%. Look for price to show you, but right now is in a loose range between 2272, and 2245. We do have buying today in the fork marked

SandP 500 E-Mini Futures 60 CME Updated 12/14/2016Price has continued rising higher on the fork from the bottom low. If price pulls back on news we could see 2246 and 2225 area as minor support with long term support near 2211.

SandP 500 E-Mini Futures 240 CME Updated 12/14/2016Price has continued to rise in this upward AR set. Look for price to hit minor support at 2225 and 2211 area and 2180 if it goes down respectively. If prices rise we could see a break of 2275 and retest for higher.

SandP 500 E-Mini Futures D CME Updated 12/14/2016Price has continued to rise higher. If price does come down we may see a retest of the blue median line or the previous minor resistance near 2211. To the upside, I see 2295 area being a good first target for symmetrical extension.

SandP 500 E-Mini Futures 60 CME Updated 12/13/2016Price continues to follow the blue fork up, and also to make higher highs. I have marked the most recent area where one could find support on the median line warning line. Price should not be able to extend much past the red line as resistance, as this is the maximum excursion line.

SandP 500 E-Mini Futures 240 CME Updated 12/13/2016Price has continued to rise higher, look for possibly 2300 as a symmetrical extension.

SandP 500 E-Mini Futures D CME Updated 12/13/2016Price is continuing to make higher highs in this bullish move up. First possible stop could be 2295, and also the resistance at the sliding parallel. The second spot I am looking at is 2393, the doubling of the range.

SandP 500 E-Mini Futures 60 CME Updated 12/12/2016Price has continued to rise up hitting 2265 area, and is continuing to hold on the median line. I have updated the median line to be an inside median line using the 2 points as a center line that are marked. If price comes down from here, look for 2225 area as support.

SandP 500 E-Mini Futures 240 CME Updated 12/12/2016Price has hit 2265 level, and is starting to fall a bit. look for price to come down to retrace 2225 area or lower AR trend line for support.

SandP 500 E-Mini Futures D CME Updated 12/12/2016Price has continued to drive higher, and has created a minor resistance point at 2265. Look for price to continue higher to 2295 area first symmetrical stop.

SandP 500 E-Mini Futures 60 CMEPrice has come up considerable and is still following the up sloping blue fork. We have minor support at 2240 2225 area and more major support at 2212.

SandP 500 E-Mini Futures 240 CME Updated 12/9/2016Price has come up and held the diagonal resistance center line. Look to see if price will break it or come down to minor support at 2228.

SandP 500 E-Mini Futures D CME Updated 12/9/2016Price has continued to make higher highs. First possible resistance area would be 2295, then to sliding parallel

SandP 500 E-Mini Futures 60 CME Updated 12/8/2016Price has broken up much higher, we saw a clear break of 2111 area and no real retest. Look for continued bullish momentum along the up sloping blue fork, which I had drawn in yesterday and price is respecting.

SandP 500 E-Mini Futures 240 CME Updated 12/8/2016Price has come up and made fresh highs, with clues that we are still in the uptrend showing because we have made a new reaction line. Price is now stalling a bit at the retest of the Center line. Outlook now is bullish, as we are making new higher highs and lower lows, as well a bounce heavy off of support at 2180 which i had mentioned yesterday.

SandP 500 E-Mini Futures D CME Updated 12/8/2016Price has broken to new highs. The previous 2 days of large bars were clues that price may break out of the 2211 resistance level. Look for price to continue higher. First area for resistance could be a 1:1 move of the first swing down, and also the sliding parallel which is showing frequency.

SandP 500 E-Mini Futures 60 CME Updated 12/7/2016Price has broke strong out of down fork. Look to see what price does after it breaks 2211 area, to see if it has continued energy, or if we may enter a range.
