SandP 500 E-Mini Futures D CME Updated 12/7/2016Price has continued to stay near new highs of 2211. To continue upwards, price must break with force, but I am not seeing that happen at the moment.
Medianlines

AUDUSD to extend declines to 0.7330, 0.7213Latest GDP figures threw a surprise with Q3 GDP showing a 0.5% contraction. With inflation staying weak, the prospects for RBA's rate cuts, as early as January cannot be ruled out. Technically, AUDUSD has formed a bearish flag pattern with resistance seen at 0.7450 region. A continuation to the downside will see a test to 0.7330, 18/11 close followed by a move to 0.7213 (May-June lows). The downside is likely to extend towards 0.7070 over the coming months.

SandP 500 E-Mini Futures 60 CME Updated 12/6/2016Price has hit the minor resistance near 2203. If price holds look for continuation to 2192 and lower, but price has a 80% chance of reaching the median line.
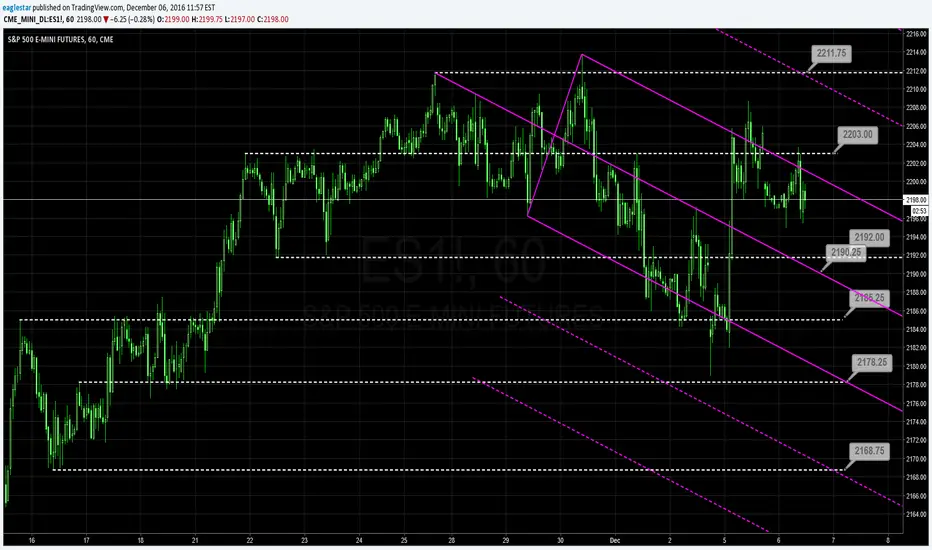
SandP 500 E-Mini Futures 240 CME Updated 12/6/2016Price has hit the upper median line, and is starting to show frequency. If price is to continue down I would like to see a break of 2180 and 2175 area.

SandP 500 E-Mini Futures D CME Updated 12/6/2016Price has come up and started to test and drop from the upper pink median line parallel. I think that we need to see strong movement down in order to have a continued bearish view. I would really like to see a break of 2180 and 2150.

SandP 500 E-Mini Futures 60 CME Updated 12/5/2016Price has started to fall after touching minor resistance near 2202 which also is near the upper median line parallel. Using a measured move with the yellow line, we can see price may drop to 2164 area if we continue lower on this first trend down. The multi colored tool you see is a Fibonacci retracement tool.

SandP 500 E-Mini Futures 240 CME Updated 12/5/2016Price is starting to fall on the upper pink median line after touching it at around 2203 area which was a prior minor resistance area from 11/22. Look to see if price will hold here and then you may see a drop lower eventually to 2100 area if we can get past 2175-80 and 2150 areas. The bullish possibility would be that price would break through 2203 and retest as support to go higher, but as we have seen such a high move up, I don't see that happening.

SandP 500 E-Mini Futures D CME Updated 12/5/2016Price has bounced off of the lower blue median line parallel. Look for price to hit the upper pink median line, and show if it is going to break down below 2175 and 2150 area,. I have added the minor support resistance areas on todays chart that are close to price.

SandP 500 E-Mini Futures 60 CME Updated 12/2/2016Price has come down and started to make a new AR set. Look for price to continue to drift and show possible small bounce at 2181, then if it breaks to 2150 area, if price holds in the downward AR set to go lower.
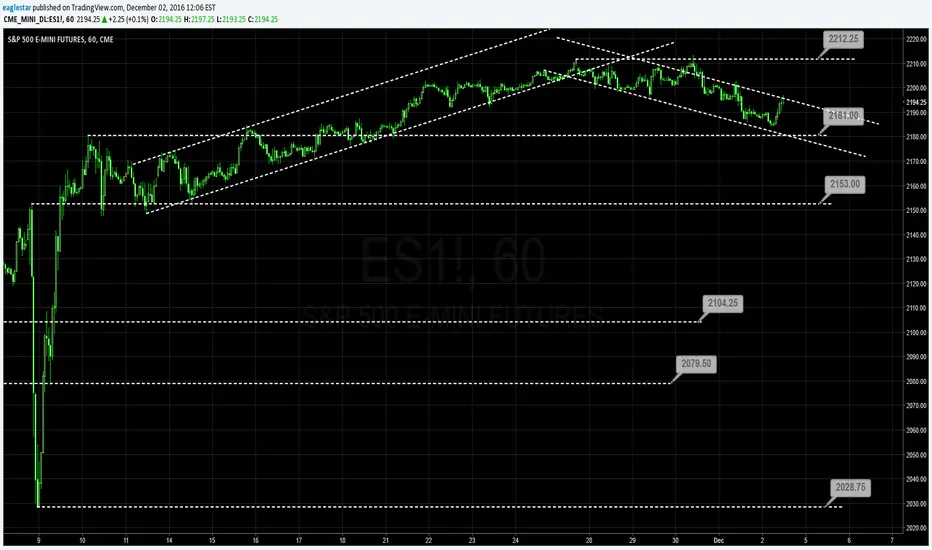
SandP 500 E-Mini Futures 240 CME Updated 12/2/2016Price has drifted down to 2184 and is starting to break minor support at 2198. Look to see if price can give a good retest of the pink upper median line to signal continued down momentum.

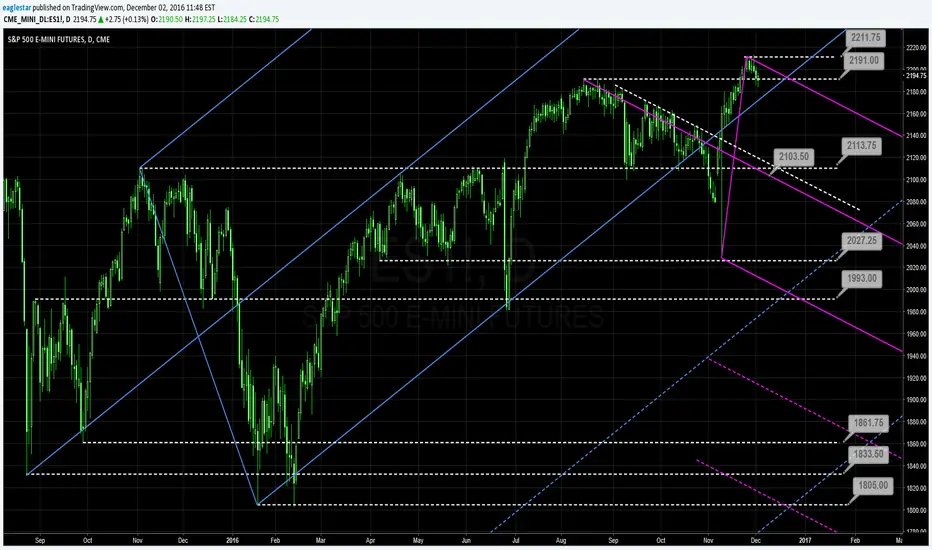
SandP 500 E-Mini Futures D CME Updated 12/2/2016Price has come up and stalled at new highs at 2211 and has started to drift lower. I have drown in a new pitchfork possibility but price needs to break 2191 hard to keep going down.
Journey XYZ - Movement / CLOPEC deal still fuels movement. We've denied breaking several supports today. 52.45 should be taken, if not today, on monday (bearing really bad news during the weekend).

SandP 500 E-Mini Futures 60 CME Updated 12/1/2016Price has come up to retest 2211 and has fallen. Look for price to test 2191 and show if it will break. If it breaks look for 2180 and 150 as possible support.

Sandp 500 E-Mini Futures 240 CME Updated 12/1/2016Price has started to fall and show a bit of frequency on the pink upper median line. Look for price to test again or fall below 2191 and then retest again the upper pink median line parallel.

SandP 500 E-Mini Futures D CME Updated 12/1/2016Price has started to drop to former resistances at 2191 area. Look what it does there to show you if it will continue lower or go up. I have highlighted 2 possible outcomes in arrows.

SandP 500 E-Mini Futures 60 CME Updated 11/30/2016Price has stalled near 2211. We need a break of 2201 and 2192 area to start a bearish downtrend. If this happens, look for a possible sell opportunities if price can start moving with energy.

SandP 500 E-Mini Futures 240 CME Updated 11/30/2016Price is hitting the upper median line parallel. It looks as if it may hold, but price need to break under 2197 for me to change to a bearish sentiment. Consider this level going forward as a signal for a possible turning point.

SandP 500 E-Mini Futures D CME Updated 11/30/2016Price has continued to stall here near all time highs. We need to see a break of recent high at 2211 to continue a bullish trend, otherwise look for price to come down to 2191 area 2165 and 2110.

SandP 500 EMini Futures 60 CME Updated 11/29/2016Price has dropped out of upward AR set, and is holding near 2112 the recent high. Look for price to break out of this consolidation shortly and show you where it wants to go. If it goes down look for 2180 and 2150 as first levels for potential support.

SandP 500 E-Mini Futures 240 CME Updated 11/29/2016Price has dropped out of upward triangle, looking now to see if it retests the upper median line with frequency to see if it has a potential to drop to middle median line around 2100 level. Lets see.

SandP 500 E-Mini futures D CME Updated 11/28/2016Price is still in new highs, looking for a retest of the 2181 area then possible the lower median line parallel, if price breaks down at all we could see a test of 2110 again, but if price continues to remain bullish it may go to next median line. My 4h chart frequency is saying that it may go down.

SandP 500 E-Mini Futures 60 CME Updated 11/28/2016Price has broken the upward AR set and is falling from a new high created at 2212. Look for price to fall to the important base at 2153 area if it can break 2181.

SandP 500 E-Mini Futures 240 CME Updated 11/28/2016Price has broken the lower trend line on a rising triangle pattern. Look for retests of the upper pink median line to consider possible lower price movement. If price does swing down, look for 2106 area as a possible first target.
