Median Line Trade RGTIPrice tests the LMH and rejects it. Look for a long at the retest. We get set at 12.50.
TP1 is logical at 2.5R and just before the prior top in case we fail to follow through
TP2 is at the median line. As Dr Andrews says "Price makes it to the Median Line 80% of the time".
Ok 'we got lucky' on some news for such a quick set of T/P's. Price definitely moved quicker than expected. However it wasn't luck that put us in the position.
Medianlinetrading

USFD – US Foods has reached its zenithIn 2020, we had the action, and since 2024 the market's reaction. Just as Newton describes the universal law of Action/Reaction.
However, we see that USFD has reached the centerline of the white Fork, which coincides with the reaction high and the upper median line (U-MLH) of the yellow fork!
There is not much more to say about it.
It's a clear Short to me, and the target are always the Forks and the A/R lines. And if you have enough fantasy, GAP's are always get filled....
...they say.

WDFC - WD-40 a good shortWD-40 changed direction to the south after the 5/0 count.
Soon it will become clear whether the support from (4) holds or not.
But what is already apparent is that WDFC is struggling significantly at the trend barrier. No surprise, since this price level coincides with the natural resistance.
To me, this seems like a cheap short, even though a new, true low hasn't been reached yet.
A stop behind the resistance Zone is a fair bet.

VISA - A Pump & Dump? Help me understand please.To places where no stock price has ever gone before..
What makes VISA so special?
The credit industry is currently staring into the abyss due to massively rising payment defaults.
Why is VISA skyrocketing in price, breaking through every barrier as if they were made of butter?
I don't know, and I'm very puzzled.
What will happen if economic conditions become even more difficult and the madness we're currently experiencing fully hits, and hardly anyone can service their consumer debt anymore?
I think at that point, VISA will look like a
Pump & Dump too like many others.
I'd appreciate any info on why VISA is rising so much.

NQ - Nasdaq's potential to reboundThe Median or Centerline:
The Median (Centerline) Line is the central element of the Pitchfork and acts as the equilibrium point. Price tends to oscillate around this line, and it often serves as a strong reference for potential reversals or price targets. A price move back toward the Median Line is common after significant moves away from it.
Pitchfork (Red):
The red Pitchfork, drawn through significant price points, provides the overall trend direction and shows the potential path to the downside. The red line indicates a bearish bias in the current setup, as it has been guiding the price lower.
Green Circles and Arrows:
These represent key areas of support.
The lower green circle and green arrows indicate price has found solid support in this region. The price has been bouncing from this support level, showing that it is reacting to the [ower boundary of the Pitchfork. This behavior aligns with the rule that the price tends to respect these boundaries, creating a foundation for a potential move back toward the Median Line.
Price Action Analysis:
The price recently tested the lower green circle and green arrows, bouncing off this support level, which is a typical reaction in a Pitchfork setup.
According to the Median Line theory , when the price moves too far away from the Median Line, it often returns toward it. Therefore, the bounce off the lower boundary suggests that price may now be setting up for a bullish reversal toward the RED Median Line .
Bottom Line:
The price action is following the general Pitchfork playbook . The bounce from the lower green circle suggests that the price is setting up for a potential bullish reversal toward the RED Median Line .
The next major test will be the upper resistance in the red Pitchfork , after the break of the Centerline. If the price can break through this resistance, a strong move higher is likely.
Keep an eye on this critical point!

ADBE - Adobe at the decision levelIf ADBE is able to jump above the Centerline, it probably will retest it, and then take off to the upside.
If ADBE is not able to crack the CL to the upside, then it's new projection is to the downside.
The natural target is the L-MLH.
But let's not forget the 1/4 lines!
These often act as good support. Specially with a catalyst like good News around the same time, it could bounce from there. So, that's why one of my PTG is always at these 1/4 line levels.

MSTR - Next ShortThere it is, at the U-MLH, stretched again.
Confluence with the 1/4 line of the white Fork.
Cheap short down to the CL and beyond, if it's able to crack it.
Long term, my view is, that it's going to zero, because it's a Scam in plain sight, accepted by the big rulers.

GOLD Reached it's Apex and is ready for a dumpIn my earlier posts I said that Gold has the potential to reach the U-MLH, which has become true.
Up there, the price of Gold is stretched. Yes it can go up even more beyond the Upper-Medianline-Parallel. But the overall numbers of occurrences are small.
So, at this natural stretch, price has a high probability to revert to the mean. And this is supported by the fact, that the overall indexes are heavenly oversold and already showing the signs of a pullback to the North (see my last NQ post).
Why not just watch how it plays out, and make a decision for a trade after the FOMC, or even tomorrow. Don't rush into these unknowing situations. Be patient and wait for clear signs to take action.

Carvana - More Fish To Come? You Bet!After the first post about CVNA, I bailed out on a small loss (see linked Chart). But then Immediately loaded Puts and had a good "Steak & Lobster" time §8-)
Price behaves like textbook when we consult the Medianlines trading framework and rule set.
First price reached the red Centerline, followed by the expected pullback to the white Lower-Medianline-Parallel.
If the "Fish" can't manage to jump back into the white Fork, then I expect much more downside to come. If this is the case, we have two good looking PTG's at PTG1 & PTG2.
To me, this Scam Company (see my first post) is done. It's just a matter of time.
For the longer time frame, I will check out ITM LEAP-Puts and let them profit from the ride to the south.
And for short term trades, I just wait for pullbacks as it did now, and take it short to finance some of my LEAPs, Dinner and Weekend Holidays.
Isn't it nice, how we can find good even in bad? §8-)
May the Fish be with us!

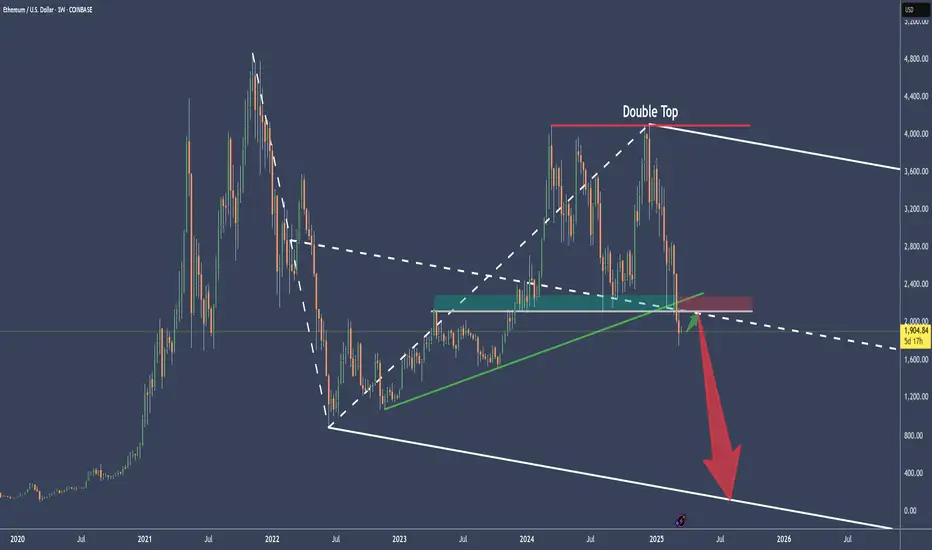
ETHUSD Cracked the longterm supportFirst there was the Double-Top.
Then there was no higher close above the last 2 highs, pressing ETHUSD brutally down to fullfill the Medianlines Rule to reach the Center-Line over 80% of times.
Then price not only reached the Center-Line by breaking through the slanted green support, but also cracked through the weekly horizontal Base (grey) which acted as the last support Bastion.
There are two scenarios possible.
a) a pullback, jump above the CL and we will see a moonshot.
or
b) price is retracing the Center-Line as it does most of the time after it's break, and then continues to the downside. Target would be the Lower-Medianline-Parallel.
Nasdaq - Potential Huge Bounce AheadPrice nearly reached the L-MLH of the Red Fork.
This is a huge price stretch and chances are super high that we will see a big bounce to the upside.
As for PTG's I focus on the Red, and the Orange Centerline.

DAX - Bullseye! Next Act: The Decline?Whenever the markets are booming, whenever a gardener starts giving stock recommendations, it’s time to brace yourself…
The German Dax has reached it's Centerline.
It's back in Balance - Or has reached it's extreme, depending on how you look at it.
Whenever this happens, we the Market
a) turns and trades in the opposite direction towards the next LIne. In this case the Lower-Medianline-Parallel.
or
b) trades through it, most of the time comes back to it, and continues in the origianl direction, which in this case would be up.
To me, this is the time to watch the DAX more closely. If you are a follower, you now that I have a Bias - which is not always helpful in my trading.
But yes, I tend to lean to the short side. Specially in these over hyped, over invested times.
So I stalk a short, but in the same time be open for a long after a confirmation on the daily time-frame.
Let's see, let's be patient and don't listen to your gardener... 🌱👨🌾 🌿👩🌾

GC - Golden Rocketship To The U-MLHWe got on the Rocket-Ship earlier and took profit.
If you're still in with a position, or if you can manage to get in with a decent Risk/Reward, you may want to aim for the U-MLH.
The Stars look good and profits are twinkling §8-)
If the 1/4 line is cracked, we will see a follow-through.

SPOT - My Mom Says I Have A short Bias...hmmm...Most of my Charts I analyze are currently showing a short setup. Mom says I'm shorting the whole world.
hmmm...
However, here's another one, just to keep the streak going. §8-)
Spotify is at the U-MLH = At the upper extreme.
The next natural move should be down to the Centerline.
Since I have no magic wand to show me the Future, I lean on my stats and my experience.
Shorting Spotify down to the Centerline or getting stopped out abve the U-MLH.
Simple (...but not easy ;-) )
...have to run, Mom calls for Dinner.

NFLX - NetFlix is overhyped an TA says tooBesides what I think about NFLX (bad for you, poor quality & service, lairs etc.), there is something that can be used to rate and judge a Stocks pricing - The Technical Analysis.
The white Fork projects the most probable path of price. The U-MLH is the upper stretch, the L-MLH the lower and the CL is the Center, where price is in equilibrium.
Where is price now?
It mooned to the upper Warning-Line!
Such moves are insane, crazy, not healthy and produce by manipulation and/or greed that eats Brains.
However - As I follow the rules of the Medianlines (Forks), I know that price is hyper extended up there. So, it can't go further? Of course it could. But Chances are poor that it will.
Instead, Chances are high that price falls down to the U-MLH. At least.
Why?
Besides price is stretched, it failed to move up to the next Warning Line (WL2).
So, there you have it.
I'm shorting NFLX and my target is at least the U-MLH, with further downside potential with PTG2 at the Centerline.

MSTR - 3 Potential Support LevelsPotential Support levels are where the green small arrows are:
white L-MLH
red CL
red L-MLH
All tough, I think MSTR Ponzi will dye over the mid term.

VRSN - VeriSign has reached it's upper extremeThe white up-sloping Fork gives us the most probable path of price for VRSN.
As we see, that was a Hell of a run.
Price has reached the U-MLH, which is the natural Extreme by the law of physics.
What's the natural reaction?
A move back to the Mean.
What's the Mean?
The Center-Line.
This is a high probability trade I take blindly.
But I mange my risk with open Eyes, even when this trade has a win rate of over 80%.
Don't let greed your Brain!

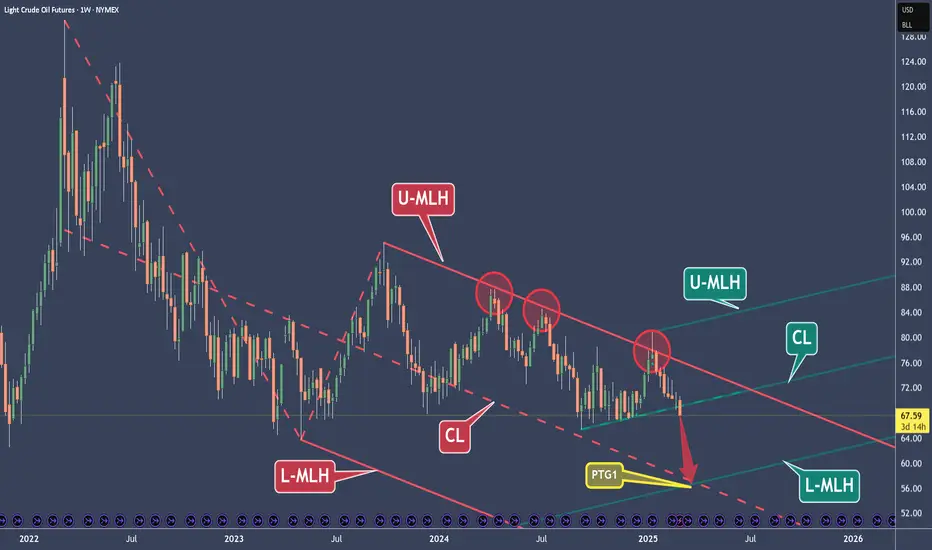
Crude Oil – A $10 Short with a Valuable LessonThe price hit the Upper Median Line Handle (U-MLH) three times and was rejected each time (red circles). These were all high-potential short trade opportunities.
However, none of these short trades managed to reach the Profit Target Goal (PTG) at the Center Line (CL). When the price repeatedly fails to hit the CL, it often builds up momentum for a larger move.
The last short opportunity from the U-MLH was at Circle #3. If you missed it, you have another chance now. Breaking the "shelf" (the petrol support line) is just like breaking a Median Line or a Center Line. It’s not magic—though it may sometimes seem like it.
The three slanted petrol lines extending to the right function the same way as a fork. So, we just broke the (petrol) Center Line, right?
Now, where is the price likely to go after breaking this (petrol) Center Line?
That’s right! There is about an 80% probability that it will move towards the (petrol) Lower Median Line Parallel.
What a coincidence—it aligns exactly with the red Center Line!
Of course, this is all based on probabilities, not guarantees. We can't predict the future, but we can rely on rules, statistics, and knowledge.
I hope you learned something today.
If you enjoy my work, I’d appreciate it if you like and share it with others.
Have a great day! 😊
NVIDIA At The 1/4 Line - Secure Profits Now?
Currently at the 1/4 line, we can expect a potential pullback. So, if you want to secure some of your fat profits, just do it.
Why not 50% ?
If it goes up again, you have secured 50%.
If it goes down, you still have 50% for a runner.
However, I'm still follow the rule-set and the trading-framework of the Medianlines. Doing this, I know that prices PTG is the Center-Line.

NQ - Nasdaq Bounce Port IntradayNasdaq is stretched, I prepare for a bounce at the Lower-Medianline-Parallel.
Targets are at the Centerline and U-MLH.
My S/L is planned for roughly 50 Points because of this crazy Volatility.

MSTR Bounce expectedIt looks like price found a support at the L-MLH.
From here, I expect a bounce, at least up to the Center-Line, if not all the way up to the Upper-Medianline-Parallel.
Long term, my expectations have not changed.

QQQ - The Warning-Line Scenario For A ShortIt's simple a s that:
If price can't make it back into the Fork, then it's doomed to reach at least the Warning-Line.
This scenario likely happens if the current weeks bar close below the Warning line, and the open of the new Bar is also outside of the Fork.
Happy Short §8-)

HIMS - The Full MonthyNo, no weed involved in this analysis.
As I said before, sometimes chart analysis is simple. But sometimes we need to extend it, combining all our knowledge to find the facts.
Let's see what we have here:
1. The white Fork.
...it's crazy, isn't it? ;-)
It looks like I was looking to fit it somehow.
But the truth can't be farther away. If you understand the principles behind this tool, WHAT it really measures, and what INFORMATION it really provides, then you get it, why this Fork is drawn like it is.
For the non Forkers:
a) Forks measure extremes, cut swings in upper, lower extremes and show where the center is.
b) they project the most probable path of price.
The A-Point was the old high.
The B-Point was the lowest low.
The C-Point is, where we had the last low, after the High was breached. So, in essence, it's a very stretched Pullback-Fork.
2. The slanted grey lines:
They just bring the natural Swings to light, and project them into the future. That's it.
I'm not going into the the minor drawings here, since they are self explaining. Just give yourself a little bit time, watch the Chart from a distance, and let your thoughts flow.
Any trades here?
Let's observe and trade from one extreme to the Center and beyond...
