L/S Swedish Equities Pairs TradeConsumer Defensive / Consumer Cyclical
30/12/2019 Close
Long: ESSITY_B Current Price SEK: 301.80
Short: WESC_AB Current Price SEK: 0.0046
ESSITY / WESC spread Entry Range: 65608.70
ESSITY / WESC spread Hard Stop: 59076.70 (10%)
ESSITY / WESC spread Soft Target: 85374.00 (30%)
BETA hedge
For every SEK 1.00 Long of ESSITY_B
SEK 9.00 Short of WESC_AB
*Build you position in two stages enter with 50% of desired exposure.
*+add too the position on a breakout or at the soft target.
*Hedge your currency exposure, unless you have a view on SEK.
*HIGH RISK trade.
Essity: Consumer Defensive (Manufacture Tissues, Toilet paper & other hygiene products) Strong fundamentals, very defensive and predictable earnings with consistent global demand, outperformed all of its competitors in 2019.
*Market Cap = 212B
*EPS = 14.10
ESSITY_B Consensus Jan 2020 =F1 Jan 2021 =F2
F1 P/E: 20.10x
F2 P/E: 17.60x
F1 Earnings Growth: 22.38%
F2 Earnings Growth: 6.70%
F1 Sales Growth: 2.70%
F2 Sales Growth: 3.00%
F1 PEG: 0.89
F2 PEG: 2.62
Risk: Reflation of the global economy, and solid resolution of political tensions. And therefore a full risk on scenario and defensive stock underperformance.
Wesc: Consumer Cyclical (Trades Apparel & related products, under it brand name WESC) Weak fundamentals, very cyclical and “polluting” as it’s fast low quality fashion. Loss making. In desperate need of a turn around, I feel the business will not attract new talent (As the brand is notoriously NOT cool for millennials and gen z) and isn’t worth turning around as a brand, also no analyst and very hard to find relevant financial information in for the company.
*Market cap = 22M
*EPS = -0.0150
Risk: Merger, acquisition or turnaround. Otherwis I’d be happy to keep this position on for the foreseeable future.
*KEEP YOUR POSITION SIZE SMALL*
This is a risky pairs trade as WESC could get bought out, or turned around and go to infinity, but I’m betting against that.
LONG High quality Swedish Consumer Staple.
SHORT Low quality Swedish Consumer Cyclical.
Medium-term

TESLA MULTI-FACTOR PREMIUM ANALYSIS+My Personal Story w/Trading TESLA(TSLA) Ahead of Q3 2019 Earnings and the Medium-term: Series on Equities #3 (12-15 Minutes read)
Just as an intro, fyi this is probably one of the most complex and well-detailed charts that I've done so far. The chart is based on a multi-factor Tesla decision tree . I know that at first sight it looks very chaotic, but I'll try to explain it as orderly as I can. Have to say that, the chart symmetry is well fitting to an exceptionally great extend. Naturally, if it takes me some time to analyse a chart to such extreme details(3 days), it will take you some time to understand it too. This analysis combines several approaches that will be analysed in three time horizons : long,medium and short-term . The multi-factor approach includes fundamental(idiosyncratic to Tesla), macroeconomic, geopolitical and technical(trend) factors. It excludes quantitative analysis , although from the decision tree drawn below, a quantitative model can be constructed. Even though my current recommendation is short, I believe that Musk in the long run, is capable enough to establish the company as one of the leading global auto manufacturers. At the end of this analysis, there will be the second part of this post, that is about my personal experience so far with charting and trading.
_________________________________________________________________________________________________________________________
Starting off with the idiosyncratic fundamental factor side combined with the macroeconomic and geopolitical risks . There are four major Tesla fundamental factors that I am looking at: net income, profit margins, deliveries and cash flows . Typically, I'd use a comparables approach , but since Tesla is still in their growth phase with highly volatile numbers , I think this would only make the analysis more confusing and won't add any value. So, how are Teslas' numbers doing ? Obviously, not that well. Their operating margin is only 0.57% . Gross margin is doing much better (17.86%), which gives me some hope that Tesla could massively benefit from improving their vertical supply chain( Reference #3 ). Ultimately, having low margins, directly impacts their net income, and if this is combined with their recent acquisitions and Chinese expansion, that adds up to Tesla's cash burning outflows. Their recent debt and SEO issuance( Reference #1 ), adds further bullish doubts. The main issue is- how is Tesla going to cover their debt obligations(even at these low rates) with non-existent margins? They will most likely have to keep adding debt/issue even more equity . Currently as it stands, the fundamentals are simply not working out. Despite the relatively well recent delivery numbers, this negative shift in investor sentiment was reflected in the latest price drop to 176 . This brings me to the Tesla decision tree diagram, that combines all of the factor approaches.
(Simplified Decision tree|The states aren't mutually exclusive(Ex. If the economy is good, chances are higher that Trump gets 2020)|On the left side Tesla's stock performance is compared to some of the top global auto manufacturers)
In my previous posts, I have thoroughly analysed most of the geopolitical and macroeconomic factors( linked in "Related ideas" ), so I will just elaborate on how they apply to Tesla. Essentially, even if Tesla has a good start in China and their recent acquisitions work out( Reference #2 ), the risk of a prolonged trade war, could affect their business in China and if this is combined with the ongoing economic slowdown, it heavily skews the risk-reward to the short side. All of the risk-reward diagram states are labelled on the chart. The darker the shade, the more probable the outcome . Before I get into the technicals, a brief summary of the Tesla's time horizons linked to the decision tree.
Short-Term : Quite a lot of uncertainty. Depending on the trade war outcome and Brexit, in the worst case outcome, we could have a recession by the 2020 US pres. elections. One of the systemic issues that will add up to the negative investor sentiment, is the rising proportion of unprofitable IPO's that are just thrown at investors( Ref #4) . What's already falling, in a recession, might as well crash . This systematic factor, applies to Tesla's profitability issues too.
Relevant VIX idea on volatility and uncertainty.
Medium-Term: If the economy survives until 2020, depending on who wins the election, we will have different outcomes. If Trump wins, the cycle could extend for another year. If any of the Democrats win, and as it looks it will most likely be E.Warren(Reference #6), we will have an economic contraction much sooner. Eventually, we will have a recession by 2022-23. Even if Trump wins 2020, his self-destructive nature will get him impeached, adding up even more uncertainty.
Discussing FED rate cycles and supercycles.
Long-Term: Assuming Tesla doesn't go bust or turns private and survives the next economic downturn, it'll be a good stock to have in a portfolio. Musk has about 10-12 more great years to lead the company. The market for biofuels and clean energy without a doubt will continue to expand. However, by then it seems that most large western OECD cities might ban cars all together, meaning that Teslas' strategic expansion into developing Asia will have a very positive payoff in the future.
Wrapping up the analysis with the technical side . The chart above ties up several carefully chosen tools and indicators such as: Elliott waves, Ichimoku cloud, (E)M averages, pitchfork band lines, fib. supports, cycles and obviously many channel trendlines . So, what are the technicals implying ? Currently, the long-term trend in Tesla is neutral, within the ichimoku cloud. After the double-combo WXY wave, there seems to be a tendency towards an ABC or ABCDE contraction . In case Tesla break off above 365 (which is extremely unlikely), I would trade Tesla based on the drawn pitchfork that fits the current chart pattern extremely well. In the comments below, I will elaborate some more on the symmetrical shapes.
That's it for Tesla, there are many other factors that could be analysed, but I tried to keep it as short and precise as possible. If you have any question, feel free to send me a private message. Now, for the second part of the analysis.
_________________________________________________________________________________________________________________________
My personal experience so far in Charting & Trading
I got into trading at the start of the crypto bearish market, the very end of 2017. It was a way to divert my college anxiety and work on something complex that took my mind off boring academia. Even now I find it very relaxing in a weird way, while I am drawing charts(hope I am not the only one). I am glad that I made a tradingview profile right away, so now I can look back and laugh at my sh*t posts about bitcoin and other altcoins. On a serious note, from those same old posts until now, I can look back and see how far I've developed my charting skills and trading mindset. All these charts and assets that I post about, serve as my notes and in a way reflect the spirit of the time(ex. 2018 sell-off). This post about Tesla gave my a sort of a conscious realization about my personal development, and this is why I am writing about my personal experience.
So far, in less than two years of being involved in charting and trading, I've came to a conclusion on few things. Firstly and obviously, trading is not easy . It's not a job, it's a lifestyle. Just as most athletes have to constantly keep their bodies in shape, a trader has to always stay sharp and attentive . Most importantly, what speed up my development was my open mindedness. Any outcome is possible- never be fooled by randomness. Part of having an open mindset, is working on your personal biases . I highly recommend taking time off trading every month to reflect on your development. Realize what for is the market following such a pattern and not why you're making the trade. Do not confuse your biases, with your intuition . Most of the time, your biases do not allow you to make a precise conscious conclusion of your intuitional drives. One of the things that elevated my charting development was adding a behavioural finance and philosophical approach . This happened last summer. If you compare the dates on my latest charts, you'd clearly see the difference. I've taken some time off trading the last couple of months, in order to fully develop my macro ideas and this has payed off remarkably well. These would be some of my tips for anyone that wants to get involved with trading, and if you're already a long term trader I'd appreciate if you commented about some of your own best trading recommendations.
How do I draw my charts and what I am currently working on? All of my recent charts are drawn naturally. I take a complete freedom and time to draw every pattern and allow for it to form and fit naturally. No pattern should be forced, just because you want the chart to turn out the way you want it to. Obviously, everyone has biases and that's why technical analysis is as subjective as it is. My latest focus has been long term. Initially when I started trading it started off with day trading on 1-30 minute charts, and you can guess the result. It's pointless to try to beat HFT algorithms or compete with them. All experienced traders start of from a macro (large time frame) approach. Additionally, it's much less stressful to reposition your portfolio every now and then when more fundamental information becomes available, compared to getting blindsided and extreme stressed while day trading. Here, I have to say that I admire the few day traders that have stayed afloat and are profitable. Takes some guts and plenty of sacrifice to perpetually live that intense lifestyle.
To conclude this boring text that's an outcome of my boredom while being sick the last couple of days, I am proud of my work. Without a doubt, I've reached a decent level of understanding in trend and multi-factor fundamental analysis. Of course, there's more things to improve on, and there'll always be. What I am currently looking to learn and improve on, is about programming and writing scripts. If you have any tips or ideas on how to get started in trading related programming, please message me right away . Even if it's not programming related, but charting related topic or an idea, I'd be happy to answer whenever I am available. Thanks for taking the time to read thorough.
This was my short text about trading and charting. Hope that my insight is at least somewhat thought provoking and useful. All the feedback is very welcomed!
-Step_ahead_ofthemarket-
________________________________________________________________________________________________________________________
References on the Tesla analysis:
1. www.nytimes.com (Corporate Structure & Financing)
2. www.youtube.com Explaining Tesla's latest investment strategies(acquisition, china expansion)
3. imgbb.com (Tesla's vertical supply chain)
4. ibb.co (IPO's Earnings trends since the 90's)
5. imgbb.com (Momentum versus Value strategy chart, sorry about the poor quality)
6. www.realclearpolitics.com
_________________________________________________________________________________________________________________________
>>I do not share my ideas for the likes or the views. This channel is only dedicated to well informed research and other noteworthy and interesting market stories.>>
However, if you'd like to support me and get informed in the greatest of details, every thumbs up and follow is greatly appreciated!
Full Disclosure : This is just an opinion, you decide what to do with your own money. For any further references or use of my content for private or corporate purposes- contact me through any of my social media channels.

NZDCAD longI'll wait for NZD CPI news in a couple of hours and then wait for price to move to that lower zone and take a long there

ETH is currently lost within it's bullish patterns (For now).Right now ETH looks like it's currently within the parameters of a falling wedge it's also broken down through many of the major support levels that is has created during the start of the bull-trend and has so far been treating the old support as resistance.
The breaks of support had resulted in an over all dip of around 60% from 2019's all time highs but since then ETH has been in a short term up-trend and has been approaching the top of the wedge and can very well break out to the upside from here.
But lets dig further into another possibility that can provide a much lower risk entry:
I have 2 big reason here why i expect a reversal to the downside.
1. While the falling wedge is a bullish pattern we are still at the top of it and right underneath both diagonal and horizontal resistance it's high risk to enter right now therefore the only valid way to enter at these high lvls would be for a break of the resistance, but the resistance here is very strong and likelihood of breaking it is low right now but still worth looking out for.
2. Our short term up trend going into this resistance zone has been pretty nice price wise but if you check the MACD you will notice that we have been bearishly diverging on the 4HR chart upon every higher high we've made in this short-term uptrend signaling that the trend has not been very strong and that we might be in for a reversal soon..
With all that said I have laid out a chart that might show some areas of value where we may have a better chance at buying then holding for the long run.
The purple zones are our S/R lvls that have yet turned to resistance
The Fibonacci levels are a retrace from our Lows back in December to or Highs this year.
And finally the harmonic over the price action in the middle of the wedge is a potential bullish shark where price might reverse. if the shark is valid price can reverse around the 149-144 dollar area marked in blue but lets say it doesn't reverse there. I believe that ETH has a major zone of support clusters between the 130-122 area in which it may be a good idea to DCA into a position at these levels.
As far as an overall stop loss is concerned I'd say a convincing break down below the wedge would be a sufficient stop.
The wedge is already quite matured and at this point we are far enough in that we could reverse at either of this support lvls which is why i suggest the DCA approach this time around and break below this wedge would take us to the 886 retracement which is confluent with a really strong support if we break the wedge and hit these levels i'd expect a violent rise back above the wedge .
So as you can see thing look overall bullish for ETH but at the same time immediate price action is still uncertain but the charts are still providing us with enough information to make plans for both the Mid-term and Longer term price action..
I hope this helped some people out; good luck traders :p

Potential Short USD/JPY (Medium-Term)Looking too potentially short the USD/JPY above 108.00, based off technicals on the 6h chart and an indication of a bearish signal. The 107.00 represents a good take profit target and should allow for a favourable risk:reward relationship. The 1.700 level served as previous resistance.

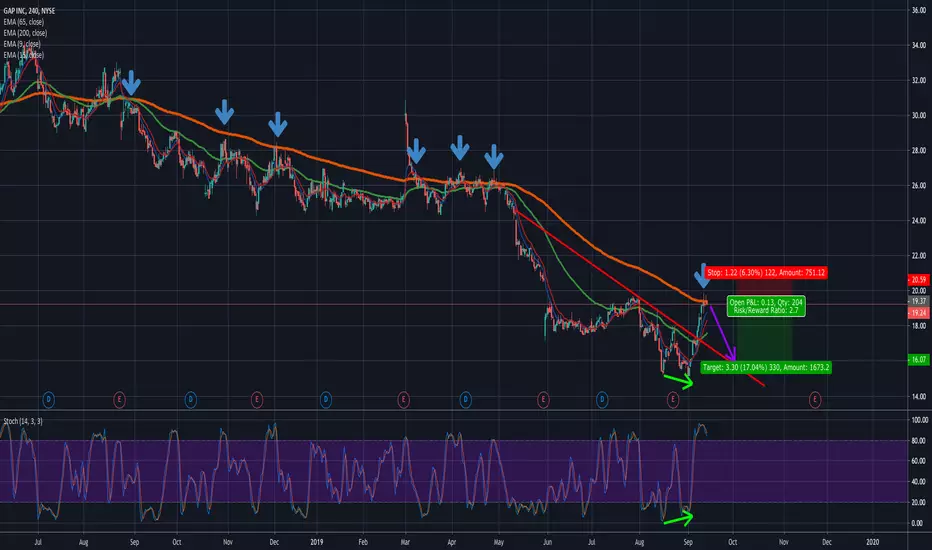
Gap Inc. Appearing to Reject 200 EMA Once AgainOn the 4-hour chart of NYSE:GPS , price action has interfered with the 200 Exponential Moving Average a numerous amount of times. And, almost every time it has, a reversal and price swing has occurred.
This latest one happened after a price surge caused by a normal stochastic oscillator divergence, sending price action straight through linear resistance. Old resistance becomes new support; the foundation of the technicals I've used to price target the short exit.
Gap Inc. is in a heavy sell off, as it has been for months on end. In some ways, this recent surge may be seen as standard price oscillation or even a short squeeze. The technicals right now are supporting a continuation of this collapsing trend.
Entry Price: $19.24.
Stop Loss: $20.55 (Resistance formed by movement before a downward gap)
Target Profit: $16.00
Methods of Capturing Gains
Short stock.
Short call credit spread.
Naked puts.
Put strike biased straddle.
Bearish strangle.
*Note: There is an infinite number of ways to capture bearishly favored gains. Be careful with the GPS weekly options because they have low volume, open interest, and liquidity, and can result in extremely unfavorable execution and fill pricing.
EUR/USD Possible 3-Wave Upswing in playI am expecting the EUR/USD to finish a abcde triangle consolidation and go into a 3-Wave abc up move in the medium-term. This trade could be either entered now (confirmation in lower timeframes) or after the A leg has been played on the pullback when the B Wave finishes.

DAX Medium-Term EW Count UpdateI assume that the German Market Index is in a corrective Wave 4 which plays out as abcde triangle (take a look at the big picture analysis). Medium Term
goal is the price area 11000-10800. The move down should come in 3 Waves now I see 2 possibilities, either the B wave is already finished and we are in the C down already or we hold around 11600 and need another pull up to the 12000 area before we start the C wave.
Take a look at inside my Facebook Community:
www.facebook.com

Bitcoin Medium-Term EW AnalysisI expect Bitcoin to drop into the 8000-7000 area in the medium term. This Zone 8000-7000 maybe even 6000 will then be a key Zone in the decision of which Big Picture Szenario plays out in the long term (take a look at my Big Picture Bullish and Bearish Count). Should we not find Support in the 8000-6000 Zone then I expect the Bic Picture Bearish Szenario to play out (Hype Kill) if we do find Support around that area we need to see if it sustainable if it is then this Zone could be a very could buying area for a long term up swing.

Top Reached and Rejected, Selling OpportunityPrevious top from early January(double topped back then) was nearly reached this week, but rejected. Fib/support levels show a short term low upcoming at .786 of the fib levels on the right of this chart, if that is hit it looks like further downward progress to the 0.382 level of the longer term run up that began in May.
Weekly Chart(not shown here) has candles reaching up toward this high from January but falling short.
Large selling volume this week helped to reject the top. Expect bear market for upcoming 1-3 weeks.

I think that XRP in a good level for jumpingIf XRP break the upper line we have a great grow to marked lines
And if it does not break the resistance line, we have a price correction within the specified lines of Fibonacci support
In all supported lines, there is a possibility to return the upward price
G.L. :)

TRXUSDT buy after breaking the lineTRX is moving toward the corner and if break up the resistance goes according to the marked lines
Sale after crossing the red line down

(NEO in a medium time) Buy NEO/USDTNEO is breaking two resistance ahead, and in the case of resistance if NEO can cross the line we have a good grow to the marked line range!

MATICUSDT medium-termIn my idea we have a pull back to marked line and after that due to fibonachi we have a great grow to upper marked line

ETHUSD, long after sell, first target 273.0.What about ETH. We have strong sell after breakout X-Lines daily level 276.21. But X-Volume indicator show slow accumulation at 268.0 so we can test 273.0 and go more upper. But you know there can been flat zone betwen 268.0 - 276.0 in medium term lets see. And dont forget there is a small chanse to go more lower to 260.2.
Levels thanks to X-Lines indicator. X-Lines always better than another .. ;)
Wait your likes. Follow me.

ETHUSD, good time for investment.Like i wrote in previous post i wait good long trend on ethusd. This trend is confirmed by volumetric analysis using the X-volume indicator.
Also, some proven people write about the rapid withdrawal of a huge amount of eth from the Bitfinex exchange. In my opinion, this is only to the benefit of asset growth, because there will be nothing to sell))
Levels thanks to X-Lines indicator.

EOSUSD, long to transit (7.83) or gold interesting price - 8.87.Ok, guys, today its Kraken and EOSUSD. I automaticaly mark all interesting price with X-lines indicator. Like you can see 8.87 its a real strong and interesting price (marked gold color). Also gold status have strong resistence level 5.47 there is a big seller on it. Volumetric analisis by X-Volume indicator show good medium purchases without obstacles. So i think you can do two things:
1) Purchase now and sell on 5.4.
2) Purchase now and wait 7.0 or higher.
It all depends on your trading activity.
Levels thanks to X-Lines indicator.

BOEING, long from accumulation zone.Sometime ago all newspapers writing about bad boeing plens and another things after which price for this stock strongly go down. But now all these worries have left the heads of investors and you can safely invest in the company's shares. There is accumulation zone for purchases 361 - 392. First level for sell is 431. So strong up.

Eventbrite, long on market opening.Eventbrite do interesting thing they sell part of shares to liquide their finance problem so i think its just best time for investing. I purchase to first strong level 19.8.

XTZUSD, long in medium term.Like we can see volume analysis by x-volume indicator show good buyers accumulation between 1.0 - 1.14 which can truly turn up price of xtz. First TP level is 1.27. Level for sell is 1.34.
Levels thanks to X-Lines indicator.

XRPUSD, long from 0.17 - 0.21. Dont invest now.Ok, guys what we have there from 10 dec 2018 to 1 april 2019 crypto makers accumulate hopes and then sell it on 2 april 2019. If you think that 0.27 - 0.29 best price for investing you truly mistaken. X-volume indicator show furser selling to 0.16-0.21. And i think that price 0.16 - 0.21 is a gold for investing. Also x-lines indicator show best interesting price for sell its 0.71884. Low trend isnt exhausted its very good shown by x-volume indicator.
All levels on this chart really right becouse they all draw by x-lines indicator.
Conclusion: we are waiting for the right price to buy an asset 0.16-0.21. We sell existing assets immediately.

ADAUSD, low trend exhausted, now long to 0.07749.Ok, like i see this situation, i draw on the chart. In past we have "selling the hopes " after which people who disappointed in ada start they native selling. So now market is empty and crypto maker need a new victims. So we go up.

Apple, long to new accumulation zone 216 - 220.Ok, today i will analize Apple on Nasdaq. There is strong upper trend after big sells under 199. This position is confirmed by volumetric analysis using x-volume indicator. Like show x-lines on day timeframe there is strong level 209. And i think be better to sell some part of long position there. Next we have accumulation zone 216-220 which is represented whith 3 strong levels. And i think in medium term price will go up to this zone. So its clear long)
Levels thanks to X-lines indicator.
