Short Term & Medium Term Gold ChartOver the next few days I'm expecting Gold to hit & bounce off 1280. After that, anticipating Gold to continue declining (likely with some pauses & upward corrections) towards 1220.
Medium-term

Bitcoin medium term very bearishBitcoin medium term outlook (2-4 weeks) is quite bearish for the following reasons
- 1 week targets would be 4600-4700
-A break of the trend line of 4700 could see us head to 4100-420
-2-4 week targets would be 3-3.5k
-Long term 1-2 months, I expect us to hit the bottom of the channel , which is around 2K area
1.TD Sequential hit 9 on the Weekly. While in strong trends it can be ignored, we have to remember that we are still in a bear market till we make a higher high, which would be roughly 6500-6800 area depending on which exchange you used. This means the TD sequential is giving us an alert on essentially counter-trend pattern, making it very strong likelihood of achieving. This was substantiated by the rally ending at the TD 9 Sequentaiil
2.Spinning Top on Weekly about to form ( closes in 1 day)
-This shows price indecision at a significant resistance.We made a very strong bullish move recently but its likely that the bullish sentiment is waning
3.Rejection by significant resistances
-We got rejected by the 21 Monthly EMA resistance
-We got rejected by the 55 Weekly EMA Resistance
-You can see this by the rejection wicks
4. Extremely overbought Stochastic RSI, and modified RSI of length 3, overbought=95, and oversold=5, shows we went past the 95 resistance RSI area and are now back below it, showing we rejected the overbought resistance area. If we were extremely bullish , we would have managed to not go back to the purple area but we have, showing a rejection
5.Contrarian Investing0Go short when others are going long and calling bull market
-Everyoen is calling this a bull market
-Retail Avg Joe heard the bitcoin buzz and is now going to buy
-Remember the Crowd is rarely right. They are only right in significant trends. The 2017 bitcoin bubble had a huge frenzy between November to December and that was PRECISELY the top. So many retail investors got burnt
6. This rally seems to be artificial/manipulated.
-According to a article titled
-This rally was pumped by this huge whale market buying.
-The article specially states " anonymous trader who recently placed $100 million USD worth of concurrent Bitcoin buy orders on Coinbase, Kraken and Bitstamp probably triggered a ‘frenzy’ of automated buys,"
-Essentailly after a certain price point a ton of stops got triggered. This, along with a breach of resistance likely made bots auto buy and caused this tremendous rally
-This entire rally wasn't really the retail traders and bitcoin ecosystem showing renewed interest ( this would show we are actually transitioning to a bull market ), but just a big powerful whale
-He likely bought a ton of bitcoin cheap 3-3.5k OTC, then went on the futures market and likely longed x100 ( since he knows it can only go up ). Then decided to market buy 100M on these exchanges. After a certain price, likely 4400-4500, bots took over and began a buying spree to push us higher.
-Now, this same whale will likely market sell. And since retail things its a bull market, as soon as they see a drop of more then 10% in a span of a few hours, guess what will happen ( mass panic selling )
-This whale could likely be wanting to orchestrate a mass panic sell of bitcoin by trapping tons of bitcoin long orders and retail fomo in to cause a huge capitulation
You can keep up with my trading setups at
telegram-@CryptoFuturesGroup ( Its a public group, so just type in the username and it will pop up ).
-


EURNZD – Do you remember this?By Andria Pichidi - March 27, 2019
EURNZD Medium-Term
Back in November, we identified a very interesting pattern in EURNZD, the famous Elliott Wave pattern. In November, the pair was in a bearish trend, forming a corrective “A” wave to the downside, following a confirmation of 5 Elliott Waves movements (the dominant Trend was placed between January 2017 – September 2018).
Since then the Elliott’s model has been fully deployed, as the asset illustrated a rebound from 1.6360 on December 5, the “B” wave in the Elliott’s corrective 3-wave trend. The B-wave ended on January 3, after it peaked at a 1.7207 high. From the time of that reversal, the asset entered the 3rd phase of the Elliott wave model, i.e. “C” wave, by trading in a down channel, with the latest low swing at 1.6292 . The breach of this area confirmed our forecasts as stated in November’s post below:
Today’s break of the 4-month low, opened the doors for the 1.6235-1.6360 area , set at the latest swing lower (November 2017) and the 50% Fibonacci retracement level. Further gains could then target the 61.8% Fib. level at 1.5830 .
Despite Kiwi’s tumble by 1.5% on RBNZ’s dovish turn overnight, the above statement remains strongly alive. The EURNZD is holding within a down channel, by forming lower highs in the medium term, with attention on the downside, on the already re-opened area at 1.6235-1.6360, with risk for further declines rising. Momentum indicators comply with this 5-month bearish outlook, as RSI and MACD are negatively configured, in the daily and weekly frame, suggesting the continuation of the fall.
On the break of this area, the next leg lower could be found between the 1.5835-1.5890 area , which presents the 127.2 Fibonacci retracement level set on wave A and the 61.8% Fib. level on the 2017-2018 rally.
Theoretically however, we need to mention that the “C” wave is typically at least as large as wave A and often extends to 1.618 times wave A or beyond. This could lead below the 1.5400 barrier.
In the near term, correction to the upside could occur as the overall bias is negative, with immediate Resistance at 1.6600 and 1.6740.
Disclaimer: This material is provided as a general marketing communication for information purposes only and does not constitute an independent investment research. Nothing in this communication contains, or should be considered as containing, an investment advice or an investment recommendation or a solicitation for the purpose of buying or selling of any financial instrument. All information provided is gathered from reputable sources and any information containing an indication of past performance is not a guarantee or reliable indicator of future performance. Users acknowledge that any investment in FX and CFDs products is characterized by a certain degree of uncertainty and that any investment of this nature involves a high level of risk for which the users are solely responsible and liable. We assume no liability for any loss arising from any investment made based on the information provided in this communication. This communication must not be reproduced or further distributed without our prior written permission.

USDCAD AnalysisPrice action is forming trend reversal signal showing that USDCAD COULD REVERSE TO THE DOWNSIDE.....Read chart and monitor price action to sell.

GBPUSD Weekly Chart AnalysisAfter breaking the long-term trend line, GBPUSD has built a ground for itself in the 1.2760 area.
My view is long GBPUSD at 1.2850 (buy limit) with a stop loss at 1.2650 and targets as shown above, however, maximum target is 1.3490
It is recommended to open multiple deals and close one at each target, as well as dragging all SL orders to breakeven once price reaches first target.
Good luck everyone.
Saif Qaddoura , CFTe, ACI-Dealing

BTC/USD - Medium Term Bull TrendThe Bitcoin prices has shown a marked reluctance. It has registered a devaluation since the highs made at the end of 2017, close to $20k. The breakdown of the 100 weeks Simple Moving Average ( SMA ) accelerated the devaluation, but promoted a period of accumulation near the 200 SMA .
Additionally RSI 14 breaking up the 30 level, its another significant bullish signal.
Target price @ 5780

EurUsdPrice has been ranging within a 200/250 pip range since mid October. Price broke out of the key 1.1500 area which has acted as major resistance for a while. Price broke this 1.1500 zone with a very bullish candle, a retest has occurred of the zone and I see more upside potential with this pair. I would like to see the next upside target of 1.1600 in the short term, and then I believe price has the potential again to move even higher to test the 1.1800 handle in the short/medium term.

USDCNH - Medium Term Bear TrendUSDCNH reached historical max values and start the descendant channel approaching. Traget price @6.63.

NATGAS - Medium term Bear TrendWedge pattern promoting a Short position opportunity on medium term. Target price at $3.55. RSI indicator have cross below 70 pointing out bearish conditions.


BTC Medium-term: Sunny, but you never know, so bring a coat.In my first published idea here (mid-September), I suggested that BTC seemed poised to fall and re-test the bottom of a long-forming descending wedge.
Well, it did fall, but not quite to the bottom of the wedge. For the first time in a long while, we started forming higher lows. This trend has continued, and we now find ourselves in a very nice looking ascending wedge (drawn here in light green) -- still *within* a descending wedge (drawn in purple), but with solid support at around $6200 USD, and nicely shaping up to look a lot like a possible breakout/trend reversal.
For the first time within this downtrend, the 200 MA -- which has acted as a solid resistance over the past few months, rejecting several rallies at or near its mark -- is *above* this descending wedge (as I've drawn it, here), instead of right on top of it, or cutting thru it.
On the RSI side, we have a nice, long-forming ascending wedge (blue lines on RSI chart) -- a strengthening market.
But, on the shorter term, we have a *possible* RSI downtrend forming (red line on RSI chart). We'll soon see how that shakes out.
If we break up out of this wedge -- which seems likely in a few days, that's hugely positive. I'd imagine we'll test that 200 MA again, but this time, it's sitting higher, so if we break up, the next target is around $7250. We might see a small rejection at that point, but if this bullish momentum sustains, I think we have a good chance of bouncing right back to test -- and break -- it for good.
Bearish scenario, we fall to the bottom of this ascending wedge, test it, fail, and fall down to our next support at around $5880 USD.
Feeling pretty bullish right now, though.

GBPCAD longterm shortthe daily sellers have taken over, the 4H on the other hand had to retrace, however I expect it to exhaust some of its energy before I enter. This is a long term trend.

The price go into descending channel. Wait for Shot!The price go into descending channel.
Wait for Shot!
Remember:
+Always use stoploss
+Next 2 hours, USD have strong news.

S&P 500 bearish for a few days?This is a great opportunity with 1:4 risk to reward ratio to short this market with a fair amount of reasons (indicated on the chart). A classic mistake is trading countertrend hence this could follow the parabola and shoot to new highs fairly easily.
This is just an idea, not advice! Good luck in trading the tough markets everyone!!

EURGBP h4 SHORTEG head and shoulder H4, this is a really choppy pair in its nature, hardly any definitive directional trend.
Price met resistance at what may be the formation of the 2nd shoulder at the same height as that of the first.
It is not a high probability setup, but may prove to be meaningful, as price moving to the upside after having broken the descending weekly channel. So a move to the downside to retest previous significant supports may be in play.
I will go light on it.

BRENT C. OIL SHORT H4/DAILYBrent crude oil
Double top resistance setup on daily followed by medium to long term uptrend break and currently retesting.
Sell towards retest of the support level below at TP1, chances of it reaching below $60 per barrel is unlikely but possible.


Market Heating Up? 28,64% Profit #BTC Could hit final target? Is market heating up?
A while ago I posted a chart:
Because, the Moving Water Technical Analysis was showing that BTC was about to take off, and a big wave was forming.
I advised all my followers and haters that pro surfers can see the big waves way before it happens, and that is one of their main advantages.
Here is the same thing, because when you see the wave it is already too late.
Who bought BTC at $ 5,800, and I did post 2 times for this opportunity. Above is the chart with the second opportunity. Below is the chart with the first opportunity:
So, now some followers are already with 28,64% profit on BTC, riding what we call on surfing: "The Tube", or the best part of the wave.
But to get here, you had to believe in the wave, because before that it was not possible to see it.
Many followers are now thanking me. I am really happy to help.
Our Final target is $ 8,500 and is not very far now. Moving Water prediction, did spot a time frame, and that would be medium term from the chart that spots it. So, probably from July 30 to August 2nd, we should see our target.
What do you believe. Is it possible?
I hope the best to all.
Good Luck and Good Profit.


USDCAD Short Trade SetupHello traders.
USDCAD went up and broke the previous top. Now, it looks like we have a completed 3 wave structure. I have placed an entry order to the confluence level of 0.886 retracement and 1.118 extension and the trendline. As you can see it's still in the downtrend and my forecast will remain down as long as it doesn't break the trendline. My minimum target for any short trade is the breaking the previous bottom.

Can we hit 1.21? EUR/USD longThis is a good 1 to 2 risk/reward ratio trade that could work if the current strong bearish momentum starts dying off.
This is just an idea everyone! Good luck!!

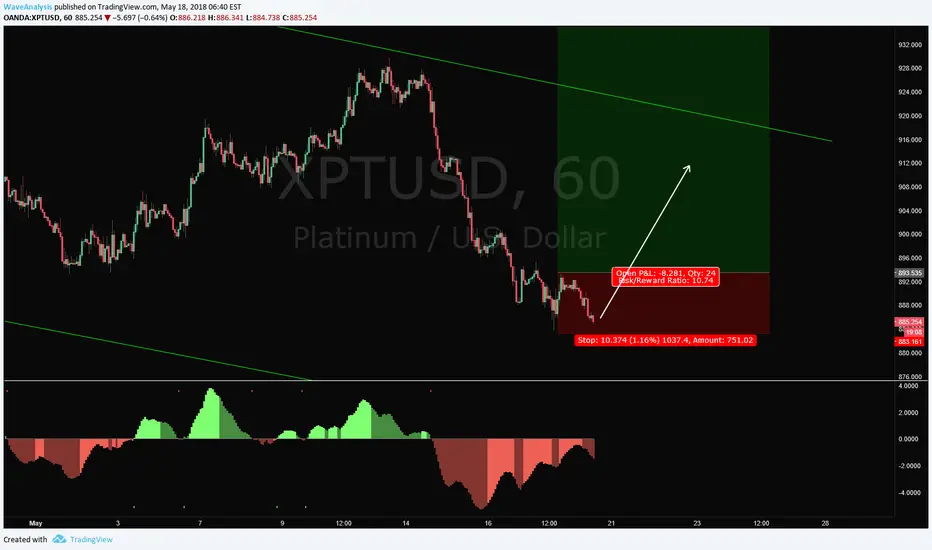
XPTUSD Long Trade SetupHello traders
Platinum has a great potential for upside but in the meantime, there is still chance for more down move. If the structure between the yellow lines is a contracting flat the structure between green lines should be the correction after reversal impulse and it should go up. If the structure between orange lines is a running flat, it will keep going down. But even in this scenario, I'm expecting some correction. That's why I have placed an entry order. My plan is to take the trade move stop-loss to break even and see the potential. If it breaks the previous bottom, I will move the entry price and stop-loss accordingly.