PNUT - Re-entry - LONG - 4 hourNow we do have a better opportunity to enter (see related publications). We are in a good place to resume and make a reentry of the previous trade.
T1: 1.38
T2: 1.52
MEME

<HIGH> FOR BUY!!!Hello friends
This coin has succeeded in turning the trend due to the good flooring it has done.
Now considering that the price is a good place, it increases the value of buying it.
If you like it, we will be happy to support us with likes and comments.

WHY - Long - Re-entry - (4-hour timeframe)Now we do have a better opportunity to enter (see related publications). We are in a good place to resume and make a reentry of the previous trade.
Target: 0.0000001840 (close - 1 day)

WHY - Long - Re-entry - (2-hour or 4-hour timeframe)We are in a good place to resume and make a reentry of the previous trade (see related publications). This one is somewhat shorter because it is also riskier. We will close it when the 2-hour or 4-hour timeframe gives us an exit pattern tomorrow.
Target: 0.0000001850 (close - 1 day)

$DOGE - Bullish Continuation - Target 0.8$Looking at the DOGEUSDT Perpetual Contract 4-hour chart, we're seeing a remarkable parabolic uptrend that began in mid-October and accelerated significantly in November.
The price action shows three distinct phases: First, there was a period of accumulation from August through September, where DOGE traded sideways around $0.10. Then, starting in October, we saw the beginning of a gentle uptrend with higher lows and higher highs. Finally, in early November, the price action turned parabolic, surging from around $0.20 to peaks above $0.45.
What's particularly interesting is the current consolidation pattern forming near the highs. After reaching the peak, instead of a sharp reversal that often follows parabolic moves, DOGE has formed what appears to be a bull flag pattern between approximately $0.40 and $0.47. This type of consolidation after a strong upward move typically suggests the potential for continuation rather than reversal.
However, there are a few important considerations to keep in mind. The angle of the ascent was quite steep, which historically can lead to sharp corrections when parabolic trends eventually break. The current consolidation could be either a pause before another leg higher or distribution before a larger correction.
For traders looking at this chart, key levels to watch would be:
- Support: The $0.40 level, which has acted as a floor during recent consolidation
- Resistance: The recent high around $0.47
- Critical Support: The previous resistance turned support around $0.35

Stars Stargaze
Stars usdt Daily analysis
Time frame daily
Risk rewards ratio >1.6 👈👌
For more information about stargaze read section news in trading view
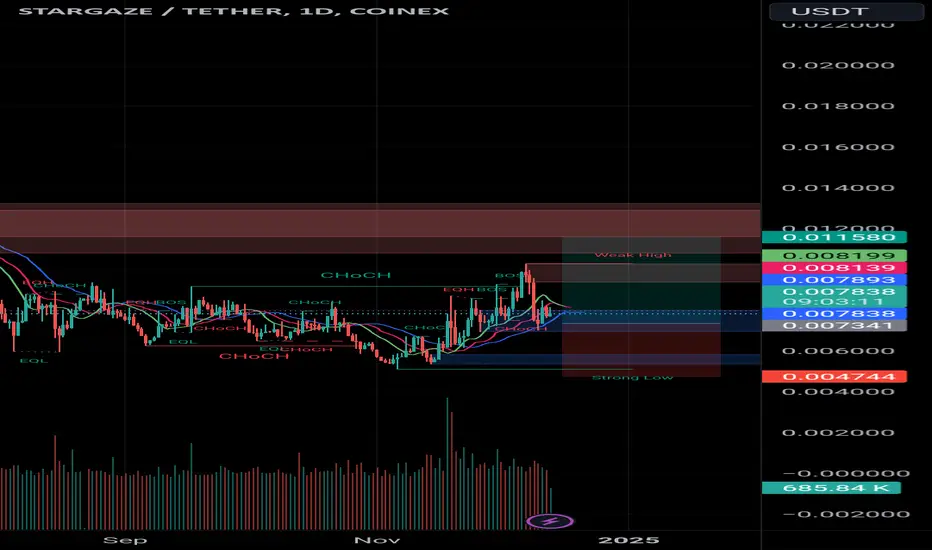
Potential meme...According to its upward trend after a correction, it was able to keep itself at this level, and by maintaining the trend and being continuous and maintaining the specified range, it is expected to move to the specified targets.
Don't forget capital management.
Be successful and profitable.

WHY - Long - 4 hour This is a new setup, better confirmed but very risky with a very tight stop. Be careful.
We are at a strong support level. Get ready for a significant move.

SOLANA GOING OVER $300 VERY SOON Want to keep this short because I am working a lot of different coins right now. Also, the work is on the chart. I've marked the relevant price levels for resistance and support and included a fib analysis for a price target.
Try and get in on a red candle on a little draw back so you don't experience death by stop hunt.
Good luck Lads.

PNUT - Strong Support - LONG - 4 hour*This is a new setup, better confirmed but very risky with a very tight stop. Be careful.
We are at a strong support level. Get ready for a significant move. If BTC doesn't have an impact, we could reach a favorable price level.
T1: 1.18 - 1.20 (protect trade) - 4 hour
T2: 1.35 (partial or close) - 4 hour
T3: 1.50 (close) - daily

RISKY MEME LONG TRADE4H Closed above previous high which indicates a potential upward move!
I am going long at 0.00239865
Stoploss 0.0232029
Initial target: 0.12
taking profits on each fib level as shown in my chart
Good Luck

memeI think you can check the green box for buying and if there is support in the green box, it can grow to the red box.

PNUT - Strong Support - LONGWe are at a strong support level. Get ready for a significant move. If BTC doesn't have an impact, we could reach a favorable price level.
T1: 1.18 - 1.20 (protect trade) - 4 hour
T2: 1.35 (partial or close) - 4 hour
T3: 1.50 (close) - daily
Stoploss: 0.85 (4 hour) or 0.75 (daily)

WHY Long We are at a strong support level. Get ready for a significant move. If BTC doesn't have an impact, we could reach a favorable price level.

Very Suitable For Hold Baskethello friends
This coin faced a price drop after being listed as expected.
Now, by holding his own and making a reliable floor, he proved that he can calculate the method...
We have specified the entry steps for you and don't forget capital management.
Be successful and profitable.

Big growth coming...hello friends
Due to the strong growth that we had, the price is in the resting phase and has hit higher ceilings and rounded from the bottom, which shows us that another rise is on the way.
Now, it is worth taking a risk to enter for one step, and we have specified the second step for you.
Capital management must be followed.
Be successful and profitable.

BOBA/USDT = THE NEXT SOLANA (CYCLE ACCTIVATED) $25This is a follow-up update for BOBA/USDT with next targets.
Hybrid Compute tech could become a game-changer, as some top developers recognize its potential impact.
Expected Targets for 2024/2025:
$0.21 to $0.45
$0.45 to $1.23
$1.23 to $5.40
Outlook for 2025:
The technological advancements and ecosystem data indicate that 2025 could be a pivotal year for BOBA/USDT, potentially pushing the coin to $10 in 2025 , with a significant chance of reaching $25 by 2025/2026.
There is an activation of market cycles, suggesting that new whale accumulation could begin at any moment. BOBA has the potential to become the next Solana, which also started below $1.
For perspective: Solana rose from $0.51 to $200, showcasing how underpriced tokens with solid fundamentals can skyrocket.
For short-term insights, see this update:
Why Boba Stands Out:
Hybrid Compute Technology: BOBA enables smart contracts to seamlessly access real-world data and off-chain APIs, expanding the potential of decentralized applications.
Layer-2 Scaling: It lowers Ethereum transaction fees and boosts transaction speeds, offering both scalability and innovation that many competitors lack.
Ecosystem Growth:
Boba Network’s Liftoff Accelerator Program, in partnership with Brinc, is fostering innovation in Web3 by supporting startups in DeFi, gaming, AI, and real-world asset applications. This initiative provides grants, technical assistance, and mentorship, further solidifying Boba's unique position in the blockchain space.This is a follow-up update for BOBA/USDT with next targets.
Hybrid Compute tech could become a game-changer, as some top developers recognize its potential impact.
Outlook for 2025:
The technological advancements and ecosystem data indicate that 2025 could be a pivotal year for BOBA/USDT, potentially pushing the coin to $10 in 2025 , with a significant chance of reaching $25 by 2025/2026.
There is an activation of market cycles, suggesting that new whale accumulation could begin at any moment. BOBA has the potential to become the next Solana, which also started below $1.
For perspective: Solana rose from $0.51 to $200, showcasing how underpriced tokens with solid fundamentals can skyrocket.
Why Boba Stands Out:
Hybrid Compute Technology: BOBA enables smart contracts to seamlessly access real-world data and off-chain APIs, expanding the potential of decentralized applications.
Layer-2 Scaling: It lowers Ethereum transaction fees and boosts transaction speeds, offering both scalability and innovation that many competitors lack.
Ecosystem Growth:
Boba Network’s Liftoff Accelerator Program, in partnership with Brinc, is fostering innovation in Web3 by supporting startups in DeFi, gaming, AI, and real-world asset applications. This initiative provides grants, technical assistance, and mentorship, further solidifying Boba's unique position in the blockchain space.

HODLE BASKEThello friends
This coin gave a buy signal and we informed you.
After defeating your resistance, it's a good situation...
We have specified the entry steps for you and don't forget capital management.
Be successful and profitable.

Mumu On AirThis chart displays a symmetrical triangle pattern on the MUMU/USDT trading pair. The price action shows tightening between ascending support and descending resistance, often signaling potential breakout momentum. The bullish bias is evident with higher lows, suggesting buyers gaining control. A breakout above the resistance line could trigger significant upside momentum.

Trading opportunity for DOGEUSDTBased on technical factors there is a Buy position in :
📊 DOGEUSDT
🔵 Buy Now
🪫Stop loss 0.39000
🔋Target 1 0.54000
🔋Target 2 0.74000
🔋Target 3 0.99000
💸RISK : 1%
We hope it is profitable for you ❤️
Please support our activity with your likes👍 and comments📝

Kween on SOL - AI movies next big thing?Kween
AI movies as philosophical art with dark humor - next big thing?
It is irresponsible to recommend the purchase of kween, I only note an exceptional chart and something new has arrived the crypto space. Worth checking out for some inspiration. If kween plays her cards right, this could be something.
I don't want to call kween memecoin she is something else even though the chart is similar to a pumping meme coin.
With a market cap of around 17 million, it could be a big fall or an explosion.

Re-Visit MOG , Update from OCT 16thThe last Idea posted about MOG was a dead on hit. Amazing how the tOCT 16th was hit. My arrows were spot on but not with time, nailed price though, now in price discovery, Fibs can give areas to watch all 61.8's and hole numbers , best plan, don't trade, wait for BTC to top out and meme season really hits, Billions & Billions
