GOATSEUS MAXIMUS - CONSOLIDATION BEFORE EXPLOSION TO THE TOP 100Technical Analysis for GOATSEUS MAXIMUS (GOATUSDT) + TRADE PLAN
Overview and Price Movement:
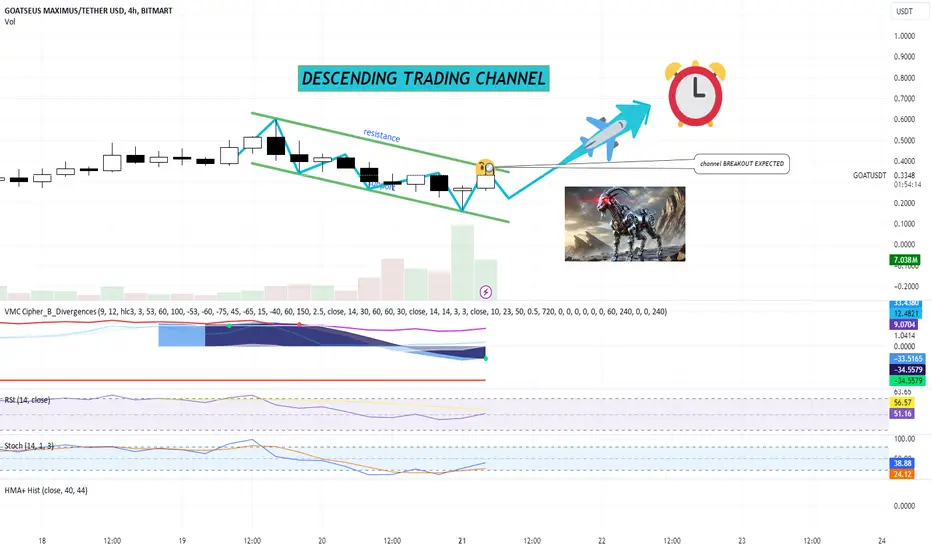
Current Price: $0.3180 (according to the chart).
Price Range: The price has fluctuated between a low of $0.2571 and a high of $0.3800 within the observed time frame.
Volume: Significant trading volume is noted, with a recent surge reaching 6.703M, suggesting rising interest and liquidity.
Descending Trading Channel:
The chart shows a descending trading channel, with price consistently testing the lower and upper bounds.
Resistance Level: The upper trendline of the descending channel represents a resistance level where the price has struggled to break through.
Support Level: The lower boundary of the descending channel serves as a support level, and the price has bounced back multiple times from this level.
Breakout Potential:
There is an indication of a potential breakout. The price has recently tested the upper trendline and is approaching a critical resistance level. The illustrated expectation suggests that the price may break out of the channel.
Time-sensitive breakout: The chart suggests that a breakout might occur shortly, as highlighted by the visual cues (alarm clock).
Indicators Analysis:
VMC Cipher B: Displays divergences, which are often early signals of potential trend reversals. In this case, the indicator suggests a weakening downward momentum.
RSI: Currently at 49.61, which indicates a neutral zone. It implies that the asset is neither overbought nor oversold, giving room for potential upward momentum after a breakout.
Stochastic RSI: Currently at 22.83, which is in the oversold zone. This reinforces the potential for a bullish reversal in the near term.
Hull Moving Average (HMA): The HMA is smoothing out the price movements, but its current position supports the possibility of a breakout from the channel in the next few candles.
Trading Plan for GOATUSDT
Entry Strategy:
Aggressive Entry: Enter at the current price ($0.3180) with the expectation of a breakout. This strategy capitalizes on momentum.
Conservative Entry: Wait for a confirmed breakout above the resistance level of the descending channel (around $0.3800) with a 4-hour candle close above this level.
Stop-Loss Placement:
Place a stop-loss below the support level of the descending channel (around $0.2570), as a breakdown below this level would invalidate the bullish thesis.
A tight stop-loss can be placed at around $0.2900 to manage risk more conservatively in case of a false breakout.
Profit Targets:
First target: If the breakout occurs, aim for the first profit target near $0.5000, as psychological resistance tends to form around these round figures.
Second target: A more extended target can be placed around $0.7000, which could be reached in a strong bullish continuation.
Risk Management:
Risk no more than 1-2% of your capital on this trade to ensure proper risk management.
Adjust the position size according to the stop-loss and entry level.
Time Horizon:
Short to medium term, with a breakout expected within the next few trading sessions (as highlighted by the chart's time-sensitive breakout indicator).
Continuously monitor the chart for any invalidations of the descending channel breakout.
Potential Risks:
False breakout: Be cautious of a possible fake breakout where the price might briefly cross above resistance but then fall back into the channel.
Market Sentiment:
Cryptocurrency markets can be volatile, and any broader market movements (such as Bitcoin price changes) could impact this analysis.
Conclusion:
The GOATSEUS MAXIMUS (GOATUSDT) price is positioned at a potential breakout zone, with several indicators showing early signs of a reversal. A well-structured trading plan that includes careful risk management and flexible profit targets is essential to maximize the potential of this trade. Always consider broader market conditions and adjust the plan accordingly.
MEME
Last Ditch Effort on $CAT: Aiming for a Bullish Breakout!Giving this one one last try. NYSE:CAT
It’s currently setting up for a deviation with the daily downtrend expiring today.
An aggressive entry should be closer to 0.000025 if it gives another shot, but I’m willing to jump in on a break of 0.000027.
Keeping it simple this time, as it caught me off guard on my last long for not following my instincts.

Shiba Inu / SHIB analysisShiba Inu price today is $0.000012 with a 24hour trading volume of 300 million dollar. SHIB price is up 45% since last month
SHIB is a meme token which began as a fun currency and has now transformed into a decentralized ecosystem. during the initial launch, 50% of the supply was allocated into Vitalik Buterin's ethereum wallet. The price of SHIB has soared from as low as $0.000000000056 to an all time high of $0.000084, that is a 1500X times increase within 8 months. some call it Dogekiller too! welcome to crypto zoo!!
Shiba Inu lead developer Shytoshi Kusama hints at rising development activity as Shibarium Beta launch date comes near. but lets talk about the chart
most of charts looks the same and waiting for break out , I personally took profit and waiting to see can bulldogs break 0.000013 if yes then longing to 0.000014 make sense. if btc goes down then we can back to 0.00001

DC. Soon.Price tests moving average for the first time in over half a year + buying volume is at its best in 8 months. If market trend continues, the result of testing the upper line of the triangle will be pattern breakout and an upward move to $0.0008

Fottie - Potential Leap to 1,000x
Currently a $960k market cap at the time of writing, this frog memecoin has plenty of space to the upside.
Fottie is displaying an extremely similar fractal/behavior that saw Pepe bottom in October 2023 and breakout from a downward wedge.
See below chart for PEPE:
PEPE at the time of writing has a $4.4bn market cap. Fottie has just shy of $1million. Even with a 1,000x it will still remain in the shadow of Pepe.
So back to PEPE:
Recently Fottie on it's exit from the white wedge also broke out into the RSI bull zone (from the indicator at the bottom of the chart). It is now on a volatile rampage up to the 0.5 or 0.618 fib level.
From there it will likely correct to form its first completed Wave 1 of 5 wave. That would create an inverse head & shoulders.
Dec 2024 to Feb 2025 is likely to will lead to the most volatile 3rd wave in the memecoin space. Before it finally tops out on it's Macro Wave 3 around February 2025.
From break-out (green vertical line) to T1 (Target 1) this is a 227,000% gain (2,270x). From current levels a 86,000% gain (860x) in dollar terms.
Ignore this frog at your peril.
See you in 6-7 months!
P.S. If you like the RSI Bull/Bear Thresholds indicator at the bottom of the screen, drop a comment below. It will soon be made available for a small exclusive audience.

Pepe - Diminishing Potential Returns
Pepe has seen quite the rise in recent years. That said the days of exponential returns may be behind it and found elsewhere in the meme coin space (more on that below).
Currently it looks like Pepe is beginning is on its way to completing an initial Wave 1 of 5.
By May 2025, it stands to reason that Pepe will see a 6-7x in USD terms.
According to fibonacci levels, this would see it enter the pocket between 2.272 and 2.414.
As much as it looks like meme-coins will see a resurgence in the next 9 months, my attention is going to be in an alternative meme-coin, that has just begun an exponential breakout like Pepe did in October 2023 (green arrow & vertical line).
Once you see it, you too will notice the similarities with Pepe's original breakout.
Want to know which meme-coin is looking like it will show exponential returns instead of Pepe? Check out my next post... (it begins with an F).
P.S. If you like the RSI Bull/Bear Thresholds indicator at the bottom of the screen, drop a comment below. It will soon be made available for a small exclusive audience.

PEPE Is Looking SEXY MartyBoots here , I have been trading for 17 years and sharing my thoughts on PEPE .
Pepe is looking beautiful , very sexy chart for more upside
Very similar to Bigtime which is up nearly 30% today
Do not miss out on PEPE as this is a great opportunity
Watch videos for more details

Phemex Analysis #29: RSI Divergence Raises Concerns for WIFPHEMEX:WIFUSDT.P has experienced a remarkable 93% surge over the past month, indicating a significant increase in market confidence. However, recent price action has shown signs of weakness, raising questions about the sustainability of this bullish momentum. A 1D RSI divergence observed on October 14th further complicates the picture, as the price is rising while the RSI is declining.
Analyzing the RSI Divergence
A 1D RSI divergence occurs when the price creates a higher high, but the RSI forms a lower high. This divergence often signals a potential reversal or a pause in the uptrend. In the case of WIF, the divergence suggests that the buying momentum may be waning, and a correction or consolidation phase could be imminent.
Overall Bullish Sentiment
Despite the recent divergence, the overall bullish sentiment surrounding WIF remains strong. The 93% surge over the past month is a clear indication of growing investor interest and confidence in the project. This positive sentiment could continue to drive the price higher, especially if there are further developments or announcements that support the bullish narrative.
Potential Scenarios
1. Continuation of Upward Trend: If WIF can overcome the RSI divergence and sustain its upward momentum, the price could continue to rise. Positive news, increased adoption, or favorable market conditions could fuel further gains.
2. Temporary Correction: A correction or consolidation phase may be necessary to digest the recent gains and allow for a more sustainable uptrend. If the price retraces but remains above key support levels, it could be seen as a healthy buying opportunity.
3. Reversal: In the worst-case scenario, the RSI divergence could signal a reversal of the uptrend. However, this would require a significant breakdown below key support levels and a change in market sentiment.
Potential Trading Strategy
Given the current market conditions, a cautious approach may be prudent. Traders could consider the following strategies:
I. Partial Profit Taking: For those who have already realized substantial gains, taking profits on a portion of their position could help protect against potential losses.
II. Tight Stop-Loss Orders: Placing tight stop-loss orders below key support levels can help limit losses in case of a sudden price decline.
III. Wait for Confirmation: Traders could wait for a clear breakout above the resistance level or a confirmation of a bullish reversal pattern before entering new positions.
Conclusion
While WIF's recent surge is a positive sign, the RSI divergence suggests that a period of consolidation or correction may be necessary. Traders should be mindful of the potential risks and carefully evaluate the market conditions before making investment decisions. If WIF can successfully overcome the current challenges, it has the potential to continue its upward trajectory.
Tips:
Trade Smarter, Not Harder with Phemex. Benefit from cutting-edge features like multiple watchlists, basket orders, and real-time strategy adjustments. Our unique scaled order system and iceberg order functionality give you a competitive edge.
Disclaimer: This is NOT financial or investment advice. Please conduct your own research (DYOR). Phemex is not responsible, directly or indirectly, for any damage or loss incurred or claimed to be caused by or in association with the use of or reliance on any content, goods, or services mentioned in this article.

btcusd h3 best level to buy/hold tp 75 000 usd🔸Hello traders, today let's review 3 hour price chart for BTCUSD . Currently
strong sequence of higher lows in progress so expecting more gains in this
market into US elections in November. I recommend to focus on accumulating on dips, bulls maintain control next few weeks.
🔸Previously recommended buying low at/near 60 000 usd. trade made money.
🔸Sequence of higher lows defined by 53 000 / 54 500 / 60 000 / next
higher low expecting near 62 000 / 63 000 usd.
🔸Recommended strategy bulls: accumulate on dips / wait for shallow
pullback and buy low near 62 000 / 63 000 usd. target is 74 / 75 000 usd
into early November. get out before US Elections. good luck.
🎁Please hit the like button and
🎁Leave a comment to support our team!
RISK DISCLAIMER:
Trading Futures , Forex, CFDs and Stocks involves a risk of loss.
Please consider carefully if such trading is appropriate for you.
Past performance is not indicative of future results.
Always limit your leverage and use tight stop loss.

PEPE’s Next Move: Anticipating a Correction Amidst OvervaluationIn the wake of the recent rally in BINANCE:BTCUSDT , BINANCE:1000PEPEUSDT.P has followed suit, joining the upward momentum and achieving fresh higher highs. Looking at historical patterns, it's plausible that we could witness a 10% retracement in the coming days, as corrections have been common following similar surges. Furthermore, we’ve been tracking a month-long upward trend where strategic pullbacks have consistently set the stage for new highs, reinforcing the potential for a short-term decline.
The current price action appears somewhat inflated, especially when considering key indicators such as the EMA200 and Bollinger Bands , both of which suggest overvaluation at this stage. With these confluences in mind, I foresee a potential move towards filling the imbalance that has been left behind by recent price spikes.
For this setup, I have identified two target profit zones:
TP1: 0.0100676
TP2: 0.0096963
To manage risk, the stop-loss is placed at 0.0112460, allowing for a balanced approach that accounts for market volatility while still capturing potential downside movement.

MEMEUSDT (MEMECOIN) Updated till 15-10-24MEMEUSDT (MEMECOIN) Daily timeframe range. another meme coin literally name memecoin which got nice potential if not its local low breaks. specially it got huge space to cover. it got a clean close over 0.01276 which may push it if volume stays.

$MOG 80% move coming! Inverse Head & Shoulders $MOG/USDT breaking out from an Inverse Head & Shoulders in white line
Yellow Lark Lines, as Krown says, show a measured move to 27800, breaking ATH first
then I would geuss for a retest, then punch to 35000 which is the 1.618 FIB ext
I'm in...see where it goes and revisit in a week or so
I also can see memes crushing it and to go to where Shiba was last run would be a 40X

Unleashing the $CAT: Waiting for the Purr-fect Move!Price looks to be stabilizing. I've posted other NYSE:CAT charts previously, so please check them for better reference.
This one is fresh, and I think it’s on the verge of making a strong move, similar to the other cat memes.
From a technical perspective, I like seeing the price stay above the 0.000028 zone, so I’m bidding everything close to that area.
If it starts trading below that zone, I’ll assume it’s not ready to move.
Overall, I’m just following the cat meme trend, and this one has barely moved. Maybe CRYPTOCAP:BNB needs to explode for this to move along with it.

#MEME/USDT#MEME
The price is moving in a descending channel on a 1-day frame upwards and is expected to continue
We have a trend to stabilize above the moving average 100 again
We have an upward trend on the RSI indicator that supports the rise by breaking it upwards
We have a support area at the lower limit of the channel at a price of 0.00900
Entry price 0.01100
First target 0.01427
Second target 0.01773
Third target 0.02300

Andy: Your Go-To for Gains—The Momentum is Far from Finished!I needed to open a second idea since the current one has hit all its targets. This coin, in particular, has been fun to trade, but I’m anticipating a range to form within the mid-level retracement.
If CRYPTOCAP:BTC retraces to 60k, I’ll be cautious about how low it might dip. Keep in mind, this one still has potential; we’re just capitalizing on the initial impulse for now.
Once CRYPTOCAP:BTC breaks above the current level of 64k (if it does), things will become much more profitable. There’s still a temptation to short at these levels, as it has repeatedly failed to break above. For now, I remain bullish on the market, as most of my posts have been on the long side. However, if the market flips and 60k doesn’t hold, we may have to shift to the dark side and short until CRYPTOCAP:BTC reaches the first target at 44k.
For now, we continue to bid on dips.

TURBO is really preparing for Turbo mode (TA + trade plan by BF)Technical Analysis by Blaž Fabjan
Falling Wedge Pattern:
The chart displays a falling wedge, which is a bullish continuation pattern. Typically, this pattern signifies a potential breakout to the upside as the price consolidates before resuming its upward trend.
The wedge is identified with the resistance (upper line) and support (lower line) converging. The price is nearing the apex, suggesting that a breakout may be imminent.
Volume:
The volume seems to be relatively stable. A breakout from the wedge with a corresponding increase in volume would confirm the strength of the move.
In falling wedge patterns, diminishing volume during the consolidation phase is common, which aligns with the current scenario. Traders should watch for volume spikes on a breakout.
Indicators:
VMC Cipher_B Divergences:
The indicators at the bottom are showing several divergences. Notably, the green dots (or divergence indicators) suggest potential bullish momentum building up.
RSI (Relative Strength Index):
The RSI is around the 47.49 mark, suggesting a neutral zone, neither oversold nor overbought. An upward movement in RSI above 50 would signal increased bullish momentum.
Stochastic Oscillator:
The Stochastic Oscillator is at 62.61 (with the signal line at 58.17), indicating moderate bullish momentum. The oscillator has moved upward from a lower level, which could be a prelude to a potential bullish breakout.
Support and Resistance:
Support: The lower line of the falling wedge around 0.00625 USDT acts as a key support zone.
Resistance: The upper line of the wedge around 0.00685 USDT acts as resistance. A break above this level could lead to significant price appreciation.
If the price breaks the 0.00685 USDT resistance with strong volume, it could test the 0.0075 USDT area and beyond.
Trading Plan:
Entry:
Aggressive Entry: Consider entering the trade now, near the bottom of the falling wedge, around the 0.0064 USDT area, expecting the wedge to break out soon.
Conservative Entry: Wait for a confirmed breakout above the wedge's resistance at 0.00685 USDT. Look for a close above this level with a volume spike to confirm the breakout.
Stop Loss:
Place a stop-loss below the support of the wedge, around 0.0062 USDT. This gives room for minor price fluctuations but protects against a downside breakout.
Take Profit Targets:
First Target: 0.0075 USDT (measuring the height of the wedge and projecting it from the breakout point).
Second Target: 0.0080 USDT (psychological resistance level).
Final Target: If momentum continues strong, 0.0085-0.0090 USDT.
Risk Management:
Risk 1-2% of your portfolio on this trade.
Ensure a risk/reward ratio of at least 1:3 for a favorable setup.
Monitor the RSI and Stochastic:
If the RSI rises above 50 and the Stochastic Oscillator continues to trend upward, the likelihood of a breakout increases.
Exit Strategy:
In case the wedge pattern fails and the price breaks down below 0.0062 USDT, exit the trade to avoid larger losses.
If the price hits the first target (0.0075 USDT), consider taking partial profits and moving your stop loss to break-even to secure the trade.
Summary:
Potential breakout: The chart is indicating a falling wedge continuation pattern with a potential breakout to the upside. Indicators are showing neutral-to-bullish signals, and volume is crucial for confirming any upcoming breakout.
Risk/Reward:
Set up your entry points based on either a more aggressive or conservative approach, but ensure proper risk management and stop-loss placement.
Monitor the price action closely as it approaches the resistance, and act accordingly based on confirmation signals.

MEME target 0.01314h time frame
-
Entry: $0.0097
TP: $0.0131
SL: $0.00885
RR: 4
-
(1) Double bottom is creating
(2) Bullish engulfing triggered reversal on 1h time frame
(3) For bottom structure like this, fib projection 2.0 is the general target around $0.0124
(4) Considering the ongoing big consolidation structure, set target higher at $0.0131
(5) Stop loss once going below $0.00885

MEMEUSDTMEME ~ 2D ✅
#MEME If you ask when this coin will stop falling,. The answer is, When this descending channel is successfully broken,. So wait for this pattern to be successfully broken, to make a purchase.

DC. Bottomed out.DC through the prism of the Fibonacci grid has a minimum 389% growth potential. If CRYPTOCAP:DOGE shake out the market again then all dogs-meme assets will spike hard. RSI is oversold on the monthly and weekly charts. Bottomed out.

Bullish on $FLOKI1. We have structure shift in H2 and H1
2. We have treated the H2 OB+ as 'support'
3. We have buyside liquidity to purge at OTE

KOKO - Daily Pump AgainMEXC:KOKOUSDT is currently sitting on its key support zone, signaling a potential pump soon. The price of Koala AI (KOKO) has seen some volatility recently, dropping by more than 10% over the last week. However, it remains a popular token in the meme coin and AI space, with expectations of recovery as it finds support. Market indicators suggest that once KOKO bounces from this support, it could rally again, especially considering its potential to capitalize on AI-driven trends in the coming months

$DOGE range strategy for 3000% runthe best place to buy doge has always been in the lower half of the breakout range (s/r flip) targeting the diag channel upper sell zone.
each low has been marked by sweeping the previous low within the diag buy zone.
in other words lower half range + buy zone = good buy
and breaking above previous range into sell zone = good sell
its a very easy strategy for opportunistic buying and selling.

PEPE Prepares for Parabolic Growth: Bullish Momentum Building PEPE’s price action is following a classic Elliott Wave structure, with Wave 1 now complete, followed by an ABC correction, which also appears to have finished. This signals that we’re now entering Wave 3 of a larger degree trend (marked yellow), with Waves 1 and 2 behind us.
Zooming in, the Roman numeral wave count (white) shows the completion of Wave 1 of 3 of the higher degree trend, with i (green) forming the current wave. Once i completes, we can expect a brief ABC correction, followed by parabolic growth in Wave 3.
It’s exciting to see a meme coin like PEPE following such a strong bullish trajectory. The overall outlook is highly promising, and this setup could lead to significant upside potential!
