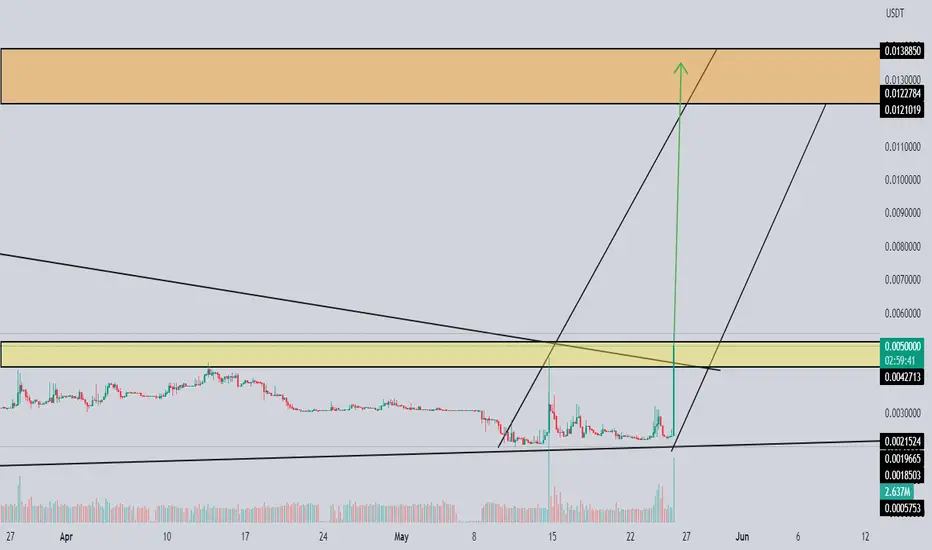
#10000LADYS/USDT 4h (#Bybit) Falling wedge breakout and retestMilady Meme Coin printed a bullish hammer and bounced back, looks ready for short-term recovery towards 100EMA.
⚡️⚡️ #10000LADYS/USDT ⚡️⚡️
Exchanges: ByBit USDT
Signal Type: Regular (Long)
Leverage: Isolated (1.15X)
Amount: 5.0%
Current Price:
0.0002215
Entry Zone:
0.0002220 - 0.0001920
Take-Profit Targets:
1) 0.0002940
2) 0.0003590
3) 0.0004245
Stop Targets:
1) 0.0001345
Published By: @Zblaba
$LADYS #10000LADYSUSDT #LADYS #Milady #Meme
Risk/Reward= 1:1.2 | 1:2.1 | 1:3.0
Expected Profit= +48.3% | +84.4% | +120.8%
Possible Loss= -40.3%
Estimated Gaintime= 1-2 weeks
milady.gg
MEME

Meme Coins VS Web 3.0 Cryptocurrencies !I'm writing this article during the crypto selloff, almost as a joke, taking inspiration from the story of a trader who purchased a cryptocurrency known as SAFEMOON, basically a shitcoin:
After remaining inactive for a period of two years, a significant whale recently sold 10,000 BNB tokens at a price of $230, amounting to $2.3 million.
What's interesting is that this particular whale was previously involved in the SAFEMOON cryptocurrency and managed to generate a substantial profit of 110,000 BNB tokens, equivalent to $47.5 million at that time, with an initial investment of just 10 BNB tokens, valued at $2,400 back then.
So he made $47.5 million with only $2.5 thousand invested, and now the project is dead!
I remember this SHIB signal back in the days:
I still consider it worthless, even if i bought it back then.
I don't see any difference between SHIB, SAFEMOON, FLOKI, KEKE, and other crypto projects that are solely based on a community rather than focusing on developing the infrastructure of Web 3.0, similar to larger projects.
There`s no intrinsic value in any of those.
But opportunities will come!

DOGEchain $0.0010 | for Twitter & Social Freedom an ecosystem chain ready to be utilized by DOGE
dogechain.dog
the BRAND just gets sexier funnier and promising
RESERVE at $0.0005/3

PEPE Coin | A Whale Sold PEPE at 52% Loss !A substantial loss was incurred by a whale who sold over 400 billion PEPE tokens at a 52% loss. The sale involved the transaction of 468.5 billion PEPE tokens, in exchange for 109 ETH valued at $190,000 and 237.5 thousand USDT.
The unfortunate outcome of this transaction left the whale with a significant loss. On May 9, the whale withdrew approximately $890,000 worth of PEPE tokens from the KuCoin exchange.
In my view, there appears to be a significant downward trajectory ahead.
Looking forward to read your opinion about it.

Doge Pizza Dip FormationDoge monthly chart showing a second slice of pizza formed and ready to be dipped. Moving onto slice 3 soon. Bullish.

🔥 NEO Looks Like Reversal: Double Bottom + Bullish DivergenceNEO is currently bouncing from a strong area of support, purple, whilst it also showed bullish divergence on the RSI.
Theoretically, this must be very bullish. With the stock market reversing and BTC seeming trading neutral, it might be time for alts to shine.
Looking for an entry around 9.21 and a stop below the most recent local low. Target at the May high.

🔥 PEPE Leaving Oversold Area: Is This The Bottom?In my most recent PEPE analysis I argued that it was likely that PEPE was forming some kind of bottom. The initial trade hit SL due to it being a bit too tight. However, the second trade is still in profit and is currently looking great.
For the people who missed the last entry, a new entry signal has emerged.
- PEPE is leaving the oversold (<30) area on the daily RSI.
- PEPE has formed a higher-low on the 4H time frame.
Entry placed at 114, which is yesterday's local top. SL under the swing low, around 104. Target still remains at 200.

🔥 PEPE Double Bottom Trade With High Potential RewardPEPE has been declining for nearly a month now. One would think that a highly anticipated token of this magnitude will bottom out at some point.
This trade is based on the idea that PEPE will retest the fear bottom of 105, which will hold and cause a big bounce towards the 200 region, like it did immediately after the fear dump on 12-05.
Keeping a tight stop at 99 to keep a very decent risk-reward of almost 16.

Meme Coin Double BottomKEKE is a meme coin (the euphemism for shitcoin) similar to the new wave of no intrinsic value coins like PEPE, DINO and LADYS.
They don`t produce any value in the crypto space, just speculation and FOMO from crypto degens. SHIB and DOGE are in the same category, just that they launched before memecoins were a thing.
KEK KEKE market cap is lower than $2Million right now.
Chart looks like a double bottom, don`t know who is still selling at this valuation.
Could go to $0, is worthless anyway, or make a 10X at some point.
Trade carefully!

Pepe Memecoin will Retest a New Low on Binance PEPEUSDTPEPE has recently experienced a bearish breakout below the support level, marked by the recent lows on the PEPE/USDT pair on Binance. This breakout is expected to continue, resulting in further downside movement and a potential retest of new lows. According to the Fibonacci levels, the 1.618% extension is identified at $0.0000004, which is believed to be a possible target for the price to test.

AIBB: BREAKOUT VIEW 3xAIBB is a coin that we can see in the format of pepe, this idea is based on the Technical side of this coin.
It seems that there is a good possibility this coin can break out in the coming time.
This study was made on the big side by TA.
Know that investing in meme coins can be risky, and do always your study.

Is AMC setting up to go long?On the 15 minute chart, AMC is in deep vundervalued territory between one and two standard
deviations below the mean VWAP band. IT is near to and abouve to cross over the central POC
line of the volume profile. It is the price area where the highest volumes of trading have
occurred. The zero-lag MACD shows a buy signal with a K and D line intersection under a green
histogram while the RSI Ichimoku shows relative strength to have risen from the bottom of
its upward-sloping regression channel and over the 50 value. Overall I see a potential setup
here for a breakout. It might be the best time to get a ride on a rocket is before the launch.
FOMO riders typically are disappointed. I will take a long trade with 1/4 my usual risk and
Que Sera Sera.

DOGE - Critical Zone / Time ⏱Hello TradingView Family / Fellow Traders. This is Richard, also known as theSignalyst.
DOGE has been stuck inside a range around the 0.065 support zone in green.
📈 For the bulls to take over, we need a daily candle close above the last major high in orange.
📉 Meanwhile , as we approach the green support again, we will be looking for short-term buy setups again.
Which scenario is more likely to happen next? and why?
📚 Always follow your trading plan regarding entry, risk management, and trade management.
Good luck!
All Strategies Are Good; If Managed Properly!
~Rich

PEPE the new meme coin! The resolution of the debt ceiling issue brings optimism and stability to the financial landscape, which has a positive ripple effect on the cryptocurrency market.
There is a potential reversal here for this new memecoin: PEPE.
PEPE/USDT
Entry Range: $0.00000110 - 0.00000130
Price Target 1: $0.00000150
Price Target 2: $0.00000165
Price Target 3: $0.00000190
Stop Loss: $0.00000082

🔥 PEPE vs SHIBA: Entering Accumulation ZoneA few weeks ago I made an analysis on PEPE vs SHIBA where I discussed how PEPE and SHIBA are alike and potentially following the same kind of price action.
Now that we're a couple of weeks further, it's time to see how PEPE is performing against the historical price action of SHIBA.
As seen on the chart, we're following a very similar pattern (1-2-3). Initial pump after Binance listing, huge sell-off (1), 100% recovery (2), continued selling followed by a small recovery (3).
In my eyes, PEPE is currently in an accumulation phase, just like SHIBA did in 2021. Not sure yet how long this accumulation takes and how low we potentially can go, but I'm fairly certain that PEPE will pump again at some point in the future.
If we follow SHIBA very closely, expect PEPE to sell-off towards the ~90 area in the near future. If we find strong support there we might pump 50%, just like SHIBA did back then.
A speculative bet, but nevertheless a very profitable one if it plays out.

AI is the meme of 2023. This is $AI stock. SimpleWith only a 3 billion market cap this stock has potential to rocket from retail money. Love the ticker. This stock has already had a huge rally this year and I expect it to continue and become a new meme stock of sorts, fueled by hype for the AI sector. Target is 109, the price it reached on it's IPO day.

🔥 SHIBA High Risk / Reward Reversal: Oversold BounceSHIBA is trading inside a sideways wedge pattern. This pattern has been playing out for nearly a year now, so the expectation is that the support will cause some kind of bounce.
A less risky approach would be to take profits around 1000 instead of 1300.
To add to this analysis, the 3-day RSI is approaching oversold levels very rapidly. An oversold 3-day RSI can often cause a major long-term bottom to be set.

🔥 PEPE Breaking Out: Insane Risk Reward OpportunityAs of this morning, PEPE is trying to break through the bearish diagonal resistance line drawn on the chart.
With BTC trading neutral and stocks exploding upwards, there's little holding volatile tokens like PEPE down. Speaking of volatility, once this token actually catches an uptrend, expect it to be violent.
Wait for the 2H candle to close above the diagonal resistance to confirm the break out. TP/SL are on the chart. Ideally, take some profits around 193 and/or move the SL to break-even.

FOUR: 10x MEME COIN?This is the last meme coin share on this channel for the next 2 months, since the request to add most volume meme coin of the time.
We don't invest in meme coins, and its very risky. This is also no trading advice.
Update
This coin seems to have high volume on more exchange and are able to be a coin that can gain 10x
LBANK exchange seems to have high volume for this memecoin.

MIMIR : MEME COIN THAT CAN SHOW VOLUME $1? long term
This coin have low supply with max 100M further a coin that did breakdown before, and last times it seems that its making a new entry zone.
We are following to see if this new zone can get volume, what will allow this coin to breakout.
This week is an meme update week, this update should not be seeing as investments since the high risk of it.
We just follow the trend of this meme coins with no further finance advice. ( the most risky coins in the markets are meme coins) High reward, high risk.
The big question is this coin able to gain $1 long term with this supply
its never good idea to invest fully on coins that are not known as this one.
This is a high risk meme coin.
This week sharing some meme coins that can move, more on study side, but it means not that it should happen.
Meme coinsIntroducing Meme-Coin Perspectives: Discovering the Art of Folly.
Are you familiar with the ubiquitous X's on Pepe, Doge, Shiba, and the like? These symbols have permeated the world of meme-coins, capturing the attention of many.
Now, let's delve into a captivating speculative concept known as the "Big Fool's Theory." Picture this: you knowingly acquire something seemingly worthless, fully aware that a bigger fool will emerge to purchase it at a higher price. In simpler terms, you anticipate someone eagerly buying an unnecessary wrapper at an exorbitant cost.
What lies in store for those who embark on this venture? The allure stems from witnessing numerous individuals amassing fortunes out of thin air. As a result, a fiery blend of FOMO and curiosity engulfs the hearts of onlookers, compelling them to impulsively dive into the realm of memecoins. They yearn to emulate someone else's triumph or, perhaps, acquire a memecoin that has been resold countless times, now soaring at its zenith.
Amusingly, some proponents extol the virtues of these whimsical tokens. When questioned about the benefits of such projects or their potential for growth, the answer is often a resounding, "someone else will buy."
This prompts us to ponder: how does this fundamentally differ from a casino?
In conclusion, the question remains: Can one truly profit by embracing the Big Fool's Theory, banking on the existence of a fool willing to pay a higher price? The resounding answer is yes.
Yet, pause for a moment and contemplate: Could you, in turn, become that very fool?
Best regards EXCAVO

Refund coin is gonna be unstoppableI have never seen so many exchanges list a coin so quickly this project had a 50 mill cap day 1 by day 3 major exchange listings now.... just about every exchange has listed it we are still ranging so get in forlift off

Sponge's Kraby Patty analysis for May.Hello fans of Meme coins.
Today I decided to post some of my holding.
It is more for fun, like PEPE.
There's not too much history, so I made some Fibo's and waves and want to monitor futher.
Especially, if it's a new coin.
Let 's wait if SPONGE coin find a way to Golden spatula : )
Yours Emvo.
