The FVG told the story. The chart just caught upThis wasn’t a pump. It was a re-delivery. Price tapped into the daily Fair Value Gap, respected the zone, and printed structure off the low. The retracement didn’t break us — it loaded us.
The logic:
The move began from an untouched Daily FVG — clean displacement, low retest, and now price is working its way through old inefficiencies. There’s no breakout here. Just one thing: delivery.
TP: 0.0163 — high timeframe imbalance resolution and prior volume pivot
The setup didn’t beg. It whispered. And now it’s unfolding, with confluence from every angle — market structure, volume, and intention.
Execution:
Entry: 0.0109–0.0113 (already in the zone)
SL: Below 0.0092
TP: 0.0163
Let others laugh at frogs. I’m here to extract liquidity from their disbelief.
Final thought:
“The move doesn’t care if you believe in it. It just needs a reason to unfold.”
Memecoin

You saw a meme. I saw imbalanceWIF doesn’t need to be serious — because I am. This move isn’t about hype. It’s about inefficiency, reclaimed structure, and a clear delivery path.
The logic:
Price swept the lows and gave a clean reaction off the OB. From there, it filled the local FVG but didn’t expand — it paused. That tells me it’s not finished building. The first push wasn’t the move. It was the positioning.
The real draw is layered above:
TP1: 0.9591 — inefficiency midpoint
TP2: 1.0469 — external liquidity and high-volume cluster
The FVG-OB combo below (0.8736–0.8565) is the reload zone. That’s where Smart Money buys. Not above. Not late.
Execution:
Entry: 0.857–0.875 zone
SL: Below 0.825
TP1: 0.959
TP2: 1.046
Let retail react to candles. I’m reacting to context.
Final thought:
“You can laugh at the ticker. Just don’t laugh at the R/R.”

SPX6900: From base building to history making.Price is fractal, right? RIGHT?!
Before the recent run, SPX6900 printed almost the same setup.
See it yourself....
Now it’s playing that over-under dance near ATH (#2). Classic. Build the base, shake the tourists.
Then comes the move... THE move.
First stop: $10.
After that, a quick push into the $50-70 zone.
Once the weak hands get flushed, $100 becomes the next base.
Long term? Way higher.
If the community keeps growing.
If people stay tired of the same rigged game.
This could and probably will make history....
Like Murad says: stop trading. Believe in something.
We’re still SO early.
This is just a "Classical charting style fractal analysis..." but the reality is that... there is no Chart. ...

BOBER - you don't need itWhy BOBER Could Perform in Autumn 2025 Bullrun
Meme Coin Hype: Bullruns favor meme coins with strong branding. BOBER’s capybara meme and MultiversX’s low fees make it accessible for retail investors seeking high returns.
Micro-Cap Potential: With a ~$6.8M market cap, BOBER has significant room for growth, appealing to speculative investors chasing 10x-100x gains in a bullrun.
MultiversX Ecosystem: MultiversX’s scalability and growing DeFi/NFT adoption could elevate BOBER, especially if the chain gains broader traction in 2025.
NFT and Gaming Catalysts: Successful NFT utility or a “Bober Land” game launch by Autumn 2025 could drive demand, particularly if the NFT/gaming market rebounds.
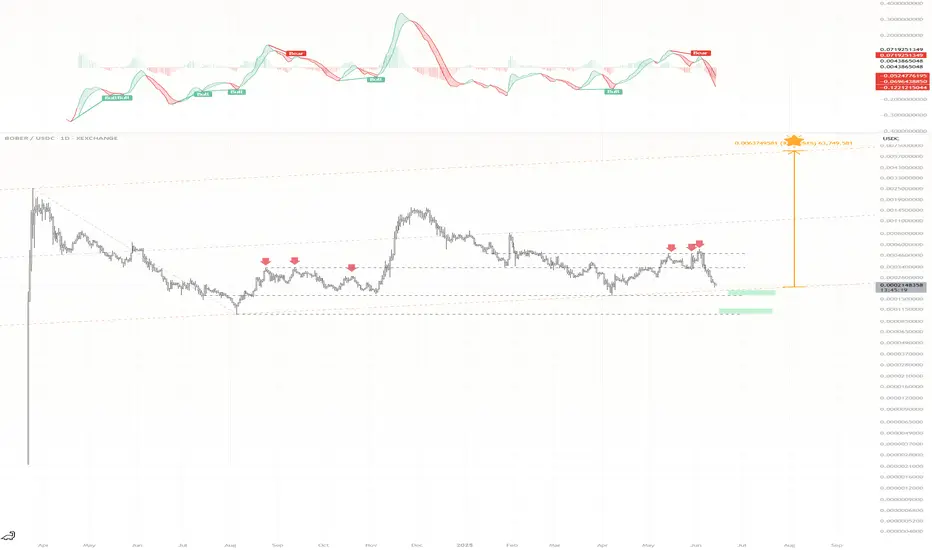
BOBER - 10.000x that nobody wantsWhy BOBER Could Perform in Autumn 2025 Bullrun
Meme Coin Hype: Bullruns favor meme coins with strong branding. BOBER’s meme and MultiversX’s low fees make it accessible for retail investors seeking high returns.
Micro-Cap Potential: With a ~$1.5M market cap, BOBER has significant room for growth, appealing to speculative investors chasing 100x-10000x gains in a bullrun.
MultiversX Ecosystem: MultiversX’s scalability and growing DeFi/NFT adoption could elevate BOBER, especially if the chain gains broader traction in 2025.
NFT and Gaming Catalysts: Successful NFT utility or a “Bober Land” game launch by Autumn 2025 could drive demand, particularly if the NFT/gaming market rebounds.

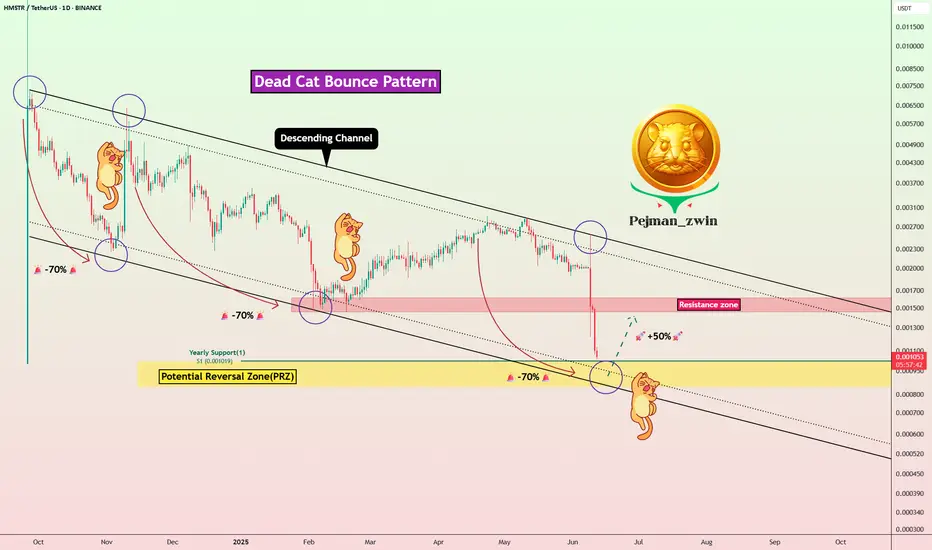
Dead Cat Incoming? HMSTR Eyes +50% Rebound Before Full MeltdownToday, let’s take a look back at HMSTR( BINANCE:HMSTRUSDT ), the token from the Telegram game Hamster Kombat .
While the game quickly gained global popularity and attracted massive user attention, it unfortunately seems to be failing — and may already be on the path to collapse .
Let’s break down some of the key reasons behind Hamster Kombat’s apparent failure :
Widespread Fake Airdrops & Scams:
In 2024–2025, Hamster Kombat became a major target for fake airdrop scams. These schemes tricked users into sharing private keys or signing malicious contracts, resulting in millions in losses. This shows the project lacked proper infrastructure to protect its community.
Unsustainable Tokenomics:
Despite publishing a whitepaper, the core economic model remains unclear. Relying only on a tap-to-earn mechanic without real utility or deflationary systems is not a viable long-term strategy.
Artificial Hype & Fake Engagement:
The project heavily depended on viral marketing and was flooded with bot-generated comments and fake testimonials, creating unrealistic expectations.
Lack of Transparency:
To this day, there is no clearly identified team or registered company behind the project, which is unusual for any serious crypto initiative.
Multiple Phishing Attacks & Fake Pages:
Many scam websites impersonated the project to steal user assets. The lack of strong, coordinated efforts from the team to prevent or warn users raises major concerns about security and credibility.
---------------------------------------------------------------------
Let's take a look at the HMSTR chart on the daily timeframe and see if this token can still be profited from !?
HMSTR token is trading near the lower line of the descending channel , Potential Reversal Zone(PRZ) , and Yearly Support(1) .
From a Classic Technical perspective and considering the fundamental conditions of the Hamster Kombat project , it seems that this project has succeeded in forming an Dead Cat Bounce Pattern .
In addition, in previous months , the cat of this Dead Cat Bounce Pattern would wake up and make a leap after every -70% decline .
I expect the HMSTR token to start rising again ( of course, a temporary increase ) and can increase its price by +50% .
Do you think the HMSTR chart cat will act again this time?
Note: If the HMSTR token goes to PRZ, we should expect more declines
Note: Please pay more attention to capital management in this analysis.
Please respect each other's ideas and express them politely if you agree or disagree.
Hamster Kombat Analyze (HMSTRUSDT), Daily time frame.
Be sure to follow the updated ideas.
Do not forget to put a Stop loss for your positions (For every position you want to open).
Please follow your strategy and updates; this is just my Idea, and I will gladly see your ideas in this post.
Please do not forget the ✅' like '✅ button 🙏😊 & Share it with your friends; thanks, and Trade safe.
Doge Meme Coin daily demand level is playing out wellThe strong daily demand imbalance mentioned in a previous update is still in control and trying to play out as expected. Any long positions on this meme coin should be managed.

Pepe Support Confirmed, Bullish Continuation Next (Trade & Win)Support is now confirmed with four green days after EMA55 and EMA89 hold as support. PEPEUSDT is bullish now and set to grow.
The peak happened 24-May. The low 5-June.
This retrace lasted 13 days with a total drop of 36%. For future reference.
After each bullish wave, there is always a retrace or correction. In this case only a retrace because the bullish cycle is just getting started, the previous wave of growth was very small.
The next advance will be very, very strong so we can expect a correction after it. The difference between the retrace and a correction is about size. The correction lasts longer and goes deeper, that's all there is.
Expect maximum growth now but this won't be the end. It will grow super strong in the coming weeks and months, then we get a correction and then even more growth. But the fifth wave is the last one, after this we get a bear market so pay attention.
Pepe's support has been confirmed. This bullish continuation will turn the market full green.
Follow me to trade with me and win.
Namaste.

BabyDoge to 1800% Growth? Breakout Confirmed — A Strong Pump AheI expect BabyDoge to grow by 1800%. We've broken out of a triangle pattern with volume, and while it might seem like a distribution phase, the volume is still there, indicating continuation. BabyDoge hasn't been pumped as much as Dogecoin, and it's still ranked #184 on CoinMarketCap at the time of writing — so there’s huge potential for growth.
The price broke a key level and did a successful retest. If the price continues to rise on volume after this retest, it will confirm my scenario for strong upside movement.
If BabyDoge continues to build volume and rise, it could repeat Dogecoin’s explosive growth — but this time, with BabyDoge as the underdog. Keep an eye on the volume and price action over the next few days. If volume picks up, we could see the big move coming!

MEMEUSDT 1D AnalysisMEME ~ 1D Analysis
#MEME Buy back gradually from here if you still have confidence in this coin with a short term target of at least 15%+ from here.

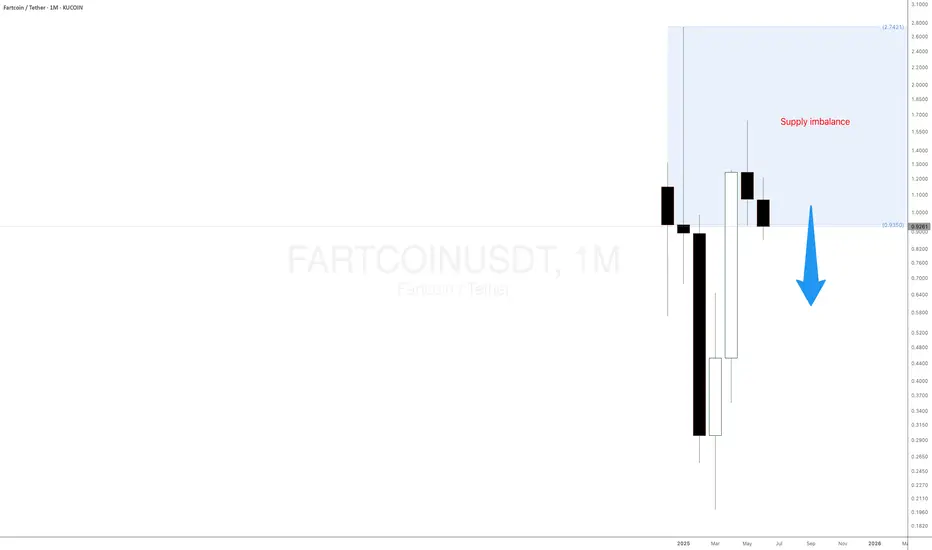
Is Fartcoin Meme Coin About to Crash Hard?In the ever-evolving world of crypto investment, memecoins continue to attract waves of speculative interest, even as their real-world use remains effectively nonexistent. One such meme coin token that’s recently caught the attention of traders and meme enthusiasts alike is Fartcoin—a cryptocurrency as ridiculous as its name implies. While Fartcoin may not be suitable for serious applications, it presents a fascinating case study in how to trade memecoins based purely on supply and demand imbalances.
The Origins of Fartcoin
Fartcoin emerged, predictably, as a joke. Like most memecoins, it was born not out of innovation but out of internet culture. Designed with no technical edge, no roadmap, and no ecosystem, its primary function is virality—riding the waves of social media hype and influencer shills. Fartcoin’s creators never intended it to disrupt finance or decentralize the web; they just wanted to make people laugh (and perhaps get rich in the process).
Yet, despite the lack of fundamentals, Fartcoin gained traction, thanks to Twitter and X memes, Reddit threads, and YouTube influencers who thrive on ironic tokens with humorous names. This is the bizarre paradox of memecoins and crypto investment: irrational exuberance often beats utility.
Why Fartcoin (Like All Memecoins) Can’t Be Used in Real Life
Let’s be clear—memecoins like Fartcoin offer no practical use. Unlike Bitcoin (store of value) or Ethereum (smart contract infrastructure), Fartcoin can’t pay for goods or services, nor does it solve any technological or economic problem. It exists solely for speculation.
Most real-world businesses won’t touch it. It lacks a stable price mechanism, a credible development team, and a long-term value proposition. In other words, Fartcoin is entirely unfit for real-life utility, making it a textbook example of a speculative asset detached from fundamentals.
Technical Analysis: Supply Level Suggests a Dump Is Imminent
While Fartcoin may lack intrinsic value, it offers opportunities for active traders who understand market psychology and how to trade cryptos. Currently, the price action reveals a notable supply imbalance around the $0.8982 level—a monthly supply zone that has acted as a key area of institutional selling pressure.
This level is currently “in control,” meaning buyers have consistently failed to push through this resistance. Price is now hovering close to this supply level, suggesting a high probability of rejection. For traders familiar with trading memecoins, this presents a prime opportunity to take short positions using futures contracts available on select cryptocurrency exchanges, such as Kucoin, Binance, and ByBit.
PEPE at Key Reversal Zone — Support Test Coming Soon?Today I want to look at the PEPE token ( BINANCE:PEPEUSDT ), which is part of the memecoin category, and provide you with a short-term analysis on the 1-hour timeframe .
PEPE token is trading in Potential Reversal Zone(PRZ) .
In terms of Elliott wave theory , the PEPE token appears to be completing the microwave 5 of the main wave C . The structure is a Zigzag Correction(ABC/5-3-5) .
Also, we can see the Regular Divergence(RD-) between Consecutive Peaks .
I expect the PEPE token to attack the Support zone($0.0000120-$0.0000108) after completing the main wave C .
Note: Stop Loss = $0.0000362
Please respect each other's ideas and express them politely if you agree or disagree.
Pepe Analyze (PEPEUSDT), 1-hour time frame.
Be sure to follow the updated ideas.
Do not forget to put a Stop loss for your positions (For every position you want to open).
Please follow your strategy and updates; this is just my Idea, and I will gladly see your ideas in this post.
Please do not forget the ✅' like '✅ button 🙏😊 & Share it with your friends; thanks, and Trade safe.

KACY - Main Character EnergyMillions of tiktok and instagram followers, so it's got the audience needed to stay relevant in a competitive meme market.
Showing some good strength and a higher low recently. If the bowl gets filled and a return to ATH occurs, that's 500x gains from bottom to top.
For now, i"d like to see a consolidation to 0.0008 area before we get lost in the clouds on the way to the moon.

NAIIVE. Pullback before the next leg up.CTO Token in an up trend now and it seems community pretty strong and bullish. Binance Smart Chain is experiencing a surge in liquidity. Regarding TA, the price may Pullback to the moving average before trend continuation.

CHILLGUY Tight Range Play – Patience Could PayCHILLGUY/USDT Analysis – 6H Chart
CHILLGUY is currently consolidating above a strong demand zone and key support line. Price is squeezing into a tight range, showing signs of buildup after the recent uptrend.
As long as the support holds, a bounce toward the mid S/R levels looks likely. A strong breakout from this zone could fuel the next leg higher.
But if price loses the demand zone, it may trigger a deeper correction.
Stay alert — a decisive move is nearing.

Bozo Benk – Road to Top 300
Bozo is a low-float, high-conviction breakout that’s showing all the early signs of a full-blown cycle runner. Right now, it’s flying under the radar — but that won’t last long.
coingecko: BozoBenk
Key Metrics:
Current Market Cap: $4.72M
Target Market Cap (Top 300 Range): ~$200M
Total Supply: 800M
Circulating Supply: ~400M (50% of tokens are locked)
If we hit a $200M market cap on just 400M circulating tokens, that gives a projected price of:
$200,000,000 / 400,000,000 = $0.50 per token
That's a 100x from here — and yes, that’s within striking distance in meme coin terms when a proper run begins.
Why This Isn’t Just “What If” Talk:
Low Float = High Velocity
With only 400M tokens in circulation, price impact per dollar is massive. When buyers show up, price moves fast — and that speed becomes the magnet.
Breakout Is Confirmed
After months of accumulation, Bozo just cleared its resistance zone. Volume spike. Momentum flip. Classic early-stage markup.
Reflexivity Effect
As price rises, more eyes come in. CT starts posting. Telegrams start firing signals. The crowd sees the move, and FOMO becomes self-fueling. This is how 10x becomes 50x.
Realistic Target Based on Ecosystem
$200M is not a moonshot. There are dozens of meme coins with less utility and worse structure sitting at or above that level. If capital rotates back into memes — and it always does — Bozo is positioned to ride that wave hard.
The Alpha:
This isn’t about “maybe” — it’s a perfect mix of low cap, reduced float, clean chart, and momentum fuel.
A $200M market cap on 400M circulating tokens = $0.50.
You're here at ~$0.005.
That’s the kind of asymmetry you don’t get often — and when it runs, there won't be time to chase.
Know what you hold. Trade it like you mean it.

Beginners Guide To Winning Memecoin Trades! Moo DengMeme coins have taken the cryptocurrency world by storm, often starting as jokes but evolving into high-volatility assets that attract crypto traders seeking quick gains. From Dogecoin to Shiba Inu and now Moo Deng, these so-called useless meme coins can offer trading opportunities—if you know where to look.
In this updated crypto analysis, I will build on our previous analysis where I identified a strong monthly supply zone for Moo Deng meme coin at $0.26. If you're wondering how to trade meme coins like Moo Deng, even with little experience, this supply and demand analysis breaks it down using simple supply and demand concepts on larger timeframes.
The sell-off is trying to happen.

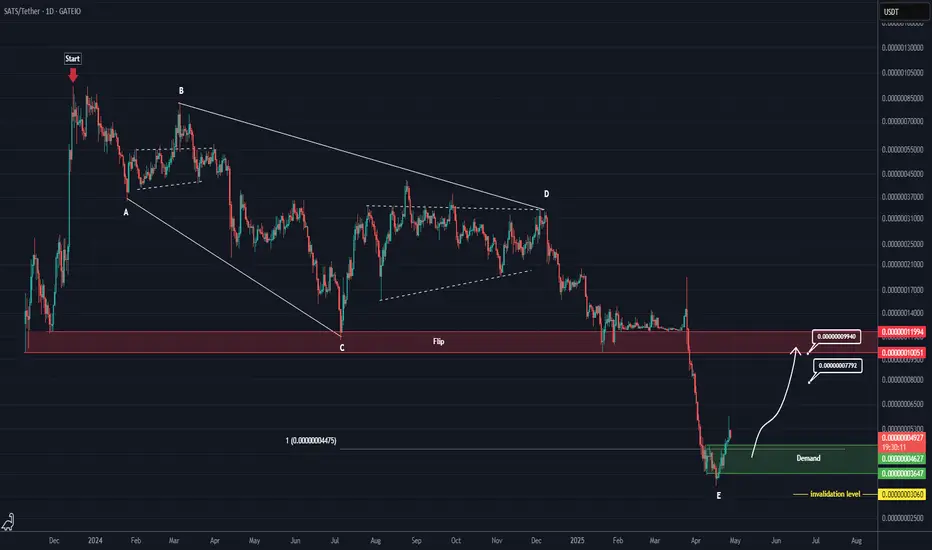
SATS has completed a corrective pattern (1D)Attention: This is a risky and highly volatile meme coin.
The correction of SATS started from the point where we placed the red arrow on the chart.
This correction appears to be an expanding triangle, as wave C is longer than wave A, and wave E is longer than wave C.
Currently, a support zone has formed below the price. As long as this area holds, the price can move toward the flip zone or near it.
Since the flip zone is fresh and untouched, the price may get rejected from this level.
The closure of a daily candle below the invalidation level would invalidate this analysis.
For risk management, please don't forget stop loss and capital management
When we reach the first target, save some profit and then change the stop to entry
Comment if you have any questions
Thank You
BONK About to Explode or Fakeout? Key Levels Are UnfoldingYello, Paradisers! Is #BONK gearing up for a face-melting rally, or is this just another trap designed for emotional traders?
💎BONKUSDT has recently formed a double bottom, a key reversal pattern that often appears before significant bullish momentum kicks in. This comes after a sustained bearish trend, and we’re now seeing signs of strength re-entering the market.
💎What’s even more interesting, a lookalike of skewed triangle pattern is starting to emerge. These often signal continuation of strength, and when paired with an already bullish reversal, it paints a potentially explosive short-term picture.
💎#BONKUSDT is currently sitting on ascending support around the $0.00001980 level. This zone is further bolstered by the EMA-50, adding extra technical significance. If BONK can continue to hold this level, the price is well-positioned to push higher toward the $0.00002470 mark, a moderate resistance zone that could serve as the next stepping stone in this bullish scenario.
💎If BONK clears this resistance with conviction, momentum could pick up rapidly, opening the doors for an aggressive move toward the $0.00003100 to $0.00003400 region. This is a critical profit-taking zone, not only because of historical resistance but also due to a dense confluence of technical barriers.
💎Zooming into the 12-hour timeframe, BONK has just entered a golden cross formation. This bullish crossover is acting as dynamic support, with the $0.00001800 level becoming an important defensive area for price stability moving forward.
Paradisers, strive for consistency, not quick profits. Treat the market as a businessman, not as a gambler.
MyCryptoParadise
iFeel the success🌴

Phemex Analysis #84: Pro Tips for Trading PEPEIn the vibrant and ever-changing landscape of cryptocurrency trading, PEPE ( PHEMEX:1000PEPEUSDT.P ) has recently captured significant attention from investors. Over the past 30 days, PEPE surged an impressive 130%, showcasing strong bullish momentum after a prolonged downtrend. This recent rally has rekindled investor interest, suggesting that a potential bullish reversal may be underway.
Yet, with volatility remaining high, traders should remain cautious.
Let’s explore several possible price scenarios and strategies to capitalize effectively on PEPE’s movements.
Possible Scenarios
1. Accumulation Followed by Breakout Rise
Currently, PEPE is showing signs of accumulation in the $0.015 to $0.012 range. This sideways consolidation typically indicates that market participants are gathering positions before a potentially significant upward move. If PEPE breaks decisively above the critical resistance at $0.0163, especially accompanied by a notable spike in trading volume, it would be a strong confirmation of bullish sentiment.
Pro Tips:
Entry Strategy: Consider accumulating positions within the consolidation range ($0.015 - $0.012). Wait for confirmation of a breakout above $0.0163 to scale up your positions confidently.
Risk Management: Place stop-loss orders below $0.012 to mitigate downside risk should the breakout fail to materialize.
2. Retesting the $0.007 Support Area
A pullback scenario could also unfold, bringing PEPE’s price down to retest the critical support zone around $0.007. If this retest occurs with relatively low trading volume and the RSI remains higher compared to previous lows—signaling a Double Bottom formation with RSI divergence—this could provide an excellent accumulation opportunity.
Pro Tips:
Accumulation Signals: Monitor trading volume and RSI closely. A successful retest at $0.007 with bullish divergence could indicate strong buying pressure.
Entry Confirmation: Conservative traders may prefer waiting for a confirmed breakout upward from the $0.007 support area before entering positions.
3. Bearish Drop Scenario
Despite the recent bullish signs, a bearish scenario remains possible. If PEPE declines towards the support level at $0.012 with increasing trading volume, and subsequently drops to $0.007 with even higher volume, it could indicate strong bearish momentum and weak market sentiment. Under these conditions, caution is highly recommended.
Pro Tips:
Market Caution: If price action unfolds this way, it’s advisable to refrain from entering positions immediately.
Wait and Observe: Allow price to stabilize before reconsidering any potential entry points, ensuring clear evidence of support.
Conclusion
PEPE’s recent 130% surge represents promising signs of a bullish reversal, yet navigating such volatility demands careful planning and strategic execution. By closely monitoring the outlined scenarios—recognizing accumulation signals, bullish divergences, and maintaining disciplined risk management—traders can maximize their potential returns while minimizing risk exposure. Always stay alert, responsive to market signals, and ready to adapt to changing conditions to trade PEPE confidently and profitably.
Tips:
Trade Smarter, Not Harder with Phemex. Benefit from cutting-edge features like multiple watchlists, basket orders, and real-time strategy adjustments. Our unique scaled order system and iceberg order functionality give you a competitive edge.
Disclaimer: This is NOT financial or investment advice. Please conduct your own research (DYOR). Phemex is not responsible, directly or indirectly, for any damage or loss incurred or claimed to be caused by or in association with the use of or reliance on any content, goods, or services mentioned in this article.

PEPE RIGHT TIME TO BUY PEPE coin is currently gaining momentum as market sentiment turns bullish across meme coins. With increased community engagement, rising trading volume, and attention from crypto influencers, PEPE appears poised for its next leg up. If current support holds and broader market conditions remain favorable, PEPE could break out from its current consolidation and target the next resistance level, potentially setting a new short-term high.

PEPE Daily – Testing Key Fib Support
After getting rejected at the 0.5 Fibonacci level on May 14, PEPE is now retesting it as support.
On the way down, price found support at the 200MA, even after briefly closing below it on the daily chart.
You could argue MLR > SMA, but both are still above the BB center and the 200MA, which maintains the overall bullish structure.
⚠️ Watch for a daily close below the 0.5 Fib—that would weaken the structure and could lead to further downside.
Look closer at smaller time frames.
Thanks for reading—if you found this engaging, react or comment.
Always manage risk and take profits. 📊

Official TRUMP Dinner PUMP?Many Altcoins, specially memecoins, in the past few weeks were growing strongly, is OFFICIAL TRUMP being suppressed?
Let's speculate a little bit.
If you were Trump. No, if I were Trump, Master Trump or Alan Trump, and I have this upcoming event on 22-May. Would I want declining prices or a super-pump right at the same time the event is happening?
If I am a very powerful man and know the power of the media, would I want the memecoin that goes by my name to be super-pumping the same night, at the exact same time as the event goes on? Wouldn't this bring that much more attention if prices were to blow up?
What's your take? What do you think will happen?
The chart looks good for TRUMPUSDT, there is no reason why prices shouldn't be going up. Other pairs are similar, many very similar, but many others continued to grow.
Last week and the week before, it was all memecoins in the top performers. This week, somehow, this market behavior was shutdown and we now only have real projects at the top of the list, which is pretty good actually and refreshing.
Overall, these memecoins can cause real harm to the market. The exchanges can fix this by not listing and delisting but that's not the topic today.
TRUMPUSDT looks good, chart-wise, based on TA. It can grow easily and the action is happening within the "bullish zone."
Another one, the biggest candle since March is a bullish candle. And this is also the biggest candle after the All-Time Low. So the bulls have the upper-hand period. So TRUMPUSDT can grow.
But what about the dinner pump?
You think they are waiting and will buy heavily on the day of the event? Maybe a 100% jump?
I am curious as to what your opinion is, and I'll tell you mine... IT IS GOING UP!
Dinner or no dinner...
Thanks a lot for your continued support.
Namaste.
