BRETT/USDT- Breaks out of 3 month of trendline.
-Yesterday listed on Coinbase Futures.
Entry: 0.043-0.039
Target:100%-200%
Memecoin

OFFICIAL TRUMP: Bullish Potential Invalidated? Back To 1,000%+As can be seen here, price action moved below our defined support (now resistance). The question naturally arises, is the previous analysis now invalid? Quick answer, no! We are still bullish and I will explain why.
It is true that the break above resistance makes this chart ultra-bullish, so moving back below can be considered an invalidation. The truth is that the low yesterday is still a higher low compared to 28-Feb. when the All-Time Low was hit. We have both a higher low and also a green close, the session yesterday ended green as a hammer which is bullish.
The bullish case is weaker now in the short-term but the bullish bias and potential remains intact. TRUMPUSDT is set to grow; patience is key.
The low is in and this low was followed by a high volume bullish breakout. This breakout is followed by a retrace, which is a classic and this retrace ends as a higher low. This is standard price action. From this higher low TRUMPUSDT can and will grow.
Even if the market decides to shakeout more people out, we are bullish long-term. You know what I love to say; once we hit bottom, the only place left to go is up.
Notice in early 2025 there is a clear downtrend on the chart. Now, instead of a downtrend the action is sideways. This is the transition period. First down, then sideways and then up.
We are going up next. It can take a few months, a few weeks or simple just a few days.
The potential for growth here is as good as with any other pair.
Thanks a lot for your continued support. It is truly appreciated.
Namaste.

PEPE UPDATE : AGAIN BUYhello friends
Due to the fall of this currency, we are now at the price floor and good conditions have been provided for buying, of course, with capital and risk management...
*Trade safely with us*

#MEME/USDT#MEME
The price is moving in a descending channel on the 1-hour frame and is adhering to it well and is heading to break it strongly upwards and retest it
We have a bounce from the lower limit of the descending channel, this support is at a price of 0.00284
We have a downtrend on the RSI indicator that is about to break and retest, which supports the rise
We have a trend to stabilize above the moving average 100
Entry price 0.00309
First target 0.00334
Second target 0.00355
Third target 0.00381

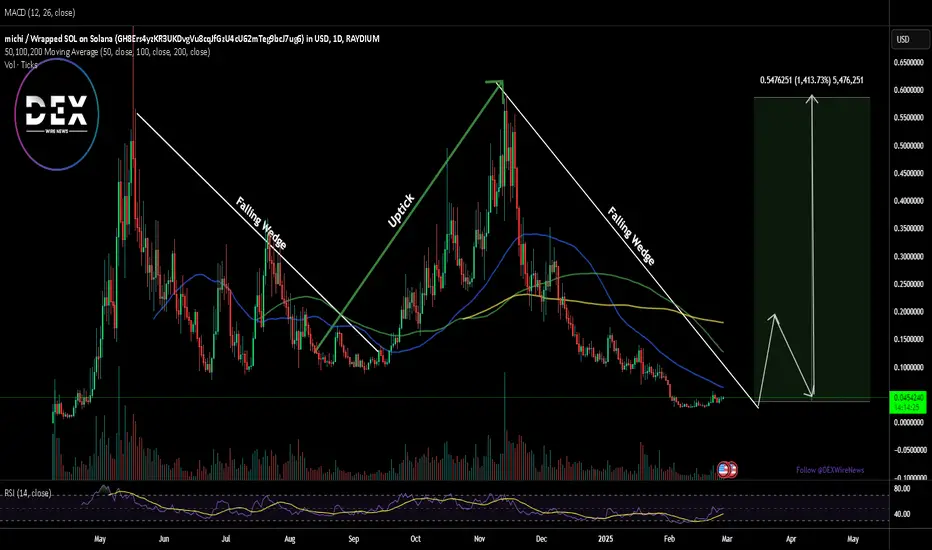
$MICHI Set for 1400% Leap Amidst Historic Falling wedge PatternThe Solana-based memecoin $MICHI is showing strong signs of a potential 1400% rally, with its price action forming a historic falling wedge pattern—a setup that has previously led to massive breakouts. As market conditions align for a bullish reversal, investors are keeping a close eye on $MICHI's next move.
Technical Analysis
A falling wedge pattern is often a bullish reversal indicator, and $MICHI has repeatedly followed this pattern before making parabolic moves. Currently, the token is trading below key moving averages, creating room for a sharp recovery. With an RSI of 49.28, $MICHI is nearing neutral territory, indicating that selling pressure has eased, and a breakout could be imminent.
If this pattern plays out as expected, the memecoin could revisit its all-time high (ATH) of $0.57, marking a staggering 1400% surge from current levels.
Final Thoughts:
All indicators suggest that $MICHI is primed for a major move. With a well-established pattern, key technical indicators aligning, and strong fundamentals backing it, the stage is set for a potential bullish breakout. However, as always, traders should monitor key resistance levels and overall market sentiment before making a move.
DOGE - LONGI think Doge will rise soon. It has support around 0.155, and I don't think it will break. The star meme coin is ready to bounce back after a 50% drop. The Fear & Greed Index is at 10, which hasn't happened since 2022. It's the right time to buy, at least on SPOT, as it will make big moves.

BTCUSDT H8 : SHORT positionHi Guys ,
This my new analysis for BITCOIN , Please check it and do your best.
SecondChanceCrypto
⏰ 26/FEB/25
⛔️DYOR
Always do your research.
If you have any questions, you can write them in the comments below and I will answer them.
And please don't forget to support this idea with your likes and comments.

GOAT - LONGRisky but high profit entry. Be very careful. If it breaks that support it will go very low.
TP 1: 0.75
TP 2: 0.92

TRUMP - LONGRisky trade on TRUMP, it should bounce in these areas. I don't recommend using too much capital. Protect the trade soon.

Bull Meme: Golden BreakthroughThe first meme coin draws a bull flag! You know, it's like finding an undervalued stock in a pile of garbage - rare, but it happens. In the medium term, I expect the growth to 1.618 Fibonacci levels - the golden ratio, friends, nature is not wrong. Plus, a small bullish divergence is coming.
Horban Brothers.

PEPE Spot Long Trade Psychological trade
the market behavior and trader psychology that can drive price movements during breakout events. Traders often react to certain price levels, trends, and patterns in ways that influence decision-making and price action.
How to Manage Psychological Challenges in Breakout Trades:
Plan and Discipline: Having a clear plan helps avoid the emotional traps that can lead to rash decisions. This includes setting entry points, stop losses, and take profits ahead of time, so traders don’t rely on emotional reactions to price moves.
Risk Management: Proper position sizing, stop losses, and using a risk-reward ratio can help mitigate the psychological stress of a breakout trade. When risk is controlled, traders are less likely to panic during a false breakout or sudden market reversal.
Avoiding Overtrading: Traders who become overzealous or overly excited about breakouts can end up entering trades without proper confirmation or at bad risk-reward ratios. Sticking to a strategy and being selective with trades helps in avoiding emotional burnout.
Recognize False Breakouts:
False breakouts can be psychologically draining, especially when traders experience significant losses. Being able to step back, reassess, and avoid chasing every breakout can help reduce the psychological impact.

TradeCityPro | WIF: Diving into the Dynamics of a Popular Meme👋 Welcome to TradeCityPro!
In this analysis, I want to examine the coin WIF, which you requested in the comments. This project is one of the famous meme coins in the crypto world, operating on the Solana network, and it has a market cap of $655 million, ranking it 105th on CoinMarketCap.
📅 Daily Timeframe
In the daily timeframe, we are witnessing a downward trend that started from a high of 3.9560 and has continued down to 0.5852. The market volume has also converged with the trend, indicating that the selling pressure has been much stronger than buying.
❌ If you previously purchased this coin, you should have set a stop-loss after the price stabilized below 1.3886. However, if you haven’t done this yet, I cannot specify a stop-loss area for you now because there's a significant support area at 0.4464, and we need to see how the price reacts to this area.
🛒 If you're looking to buy this coin, first of all, I should mention that purchasing meme coins is very risky, and I personally neither buy meme coins nor recommend buying them. But if you want to buy this coin, you should wait for a trend reversal. For a trend change, we need a new structure to form and a suitable trigger to confirm the trend change.
🔼 If the price breaks 0.5852 and the RSI enters the oversold area, we could open a very good long-term position. A break of 34.36 in this indicator gives us the first confirmation of entering bullish momentum, but this confirmation is not reliable at all and only serves to confirm futures triggers.
⏳ 4-Hour Timeframe
In the 4-hour timeframe, I want to specify the futures triggers for you. We also have an interesting ascending channel, to which the price has reacted very well so far, and breaking this channel from any side could provide a good position.
🔍 Currently, it seems there's a range box between 0.5734 and 0.7803, which has timed the price's move from the box's floor to its ceiling.
📈 For a long position after the channel break, you can enter with a trigger of 0.7803 targeting 1.0411 and 1.345, but keep in mind that we've had a very strong downtrend, and this position is against the trend.
🔽 For a short position, our trigger is very clear, and if 0.5734 is broken, you can enter, and your target could be the bottom of the channel.
📝 Final Thoughts
This analysis reflects our opinions and is not financial advice.
Share your thoughts in the comments, and don’t forget to share this analysis with your friends! ❤️

HODLE BASKEThello friends
This coin gave a buy signal and we informed you.
After hitting the bottom of the channel, it showed a good reaction, which is a good position to buy.
We have specified the entry steps for you and don't forget capital management.
Be successful and profitable.

Shiro Neko – From the Same Creators as Shiba InuPeople ask me to analyze $Shiro, and my response is: calm down, stay cool. After all, nothing can go wrong, right? At least, that's what they say on Twitter and well-known YouTube channels: "Invest without fear, it's going to hit 2B, 5B, 10B market cap!"
But the reality is that no prediction actually works. And that’s a big problem. I've been analyzing $Shiro, and honestly, I don't see any signs. BINANCE:SHIBUSDT

Grok Coin Faces Bearish Pressure: Is a Reversal on the Horizon?Grok ($GROK), a meme coin inspired by Elon Musk's AI venture, has been on a downward spiral, shedding 26% of its value in the past 24 hours. Currently trading at $0.003962, with a 24-hour trading volume of $15,794,286, the token has seen consistent selling pressure since its November 2024 highs. With a live market cap of $25,044,798, the question remains: is this just another dip, or is a potential breakout on the horizon?
Technical Analysis
Grok has been forming a falling wedge pattern, a classic technical setup that often precedes a bullish breakout. However, the continued downward momentum suggests that traders remain cautious amid broader Ethereum market conditions. Should the selling pressure persist, Grok’s price could test its one-month low, serving as a key support level.
On the flip side, a breakout past its one-month high would be a strong signal of renewed bullish momentum. The Relative Strength Index (RSI) currently sits at 52.46, signaling a potential reversal if buyers step in. Given the past price action, traders are eyeing the next resistance zone, where a sustained move above key levels could ignite a fresh rally.
Grok’s Position in the Market
Grok is a meme coin that capitalizes on the hype surrounding Elon Musk’s xAI project. Unlike many utility-driven tokens, its primary appeal lies in its meme status and community-driven momentum. While it has seen strong surges in the past, the current decline suggests a cooling-off period in speculative interest.
Despite the drop, the trading volume remains relatively high, indicating that liquidity is still present. The circulating supply stands at 6,320,722,346 GROK, with a maximum supply of 6.9 billion tokens. Investors are watching closely for any fundamental catalysts, such as Musk’s engagement with Grok or broader meme coin trends that could spark renewed interest.
What’s Next for Grok?
With the RSI indicating potential upside and the falling wedge pattern nearing its apex, traders are on the lookout for a breakout. If Grok manages to hold its key support levels and regain bullish sentiment, it could see a significant price recovery. However, failure to maintain support could lead to further retracements.

DOGE to $10?Its very possible for DOGE to reach $10 this coming altseason, I believe we are now on the primary wave 5 just completing the subwaves of 1-2 will give us a boost for a potential price discovery for DOGE.

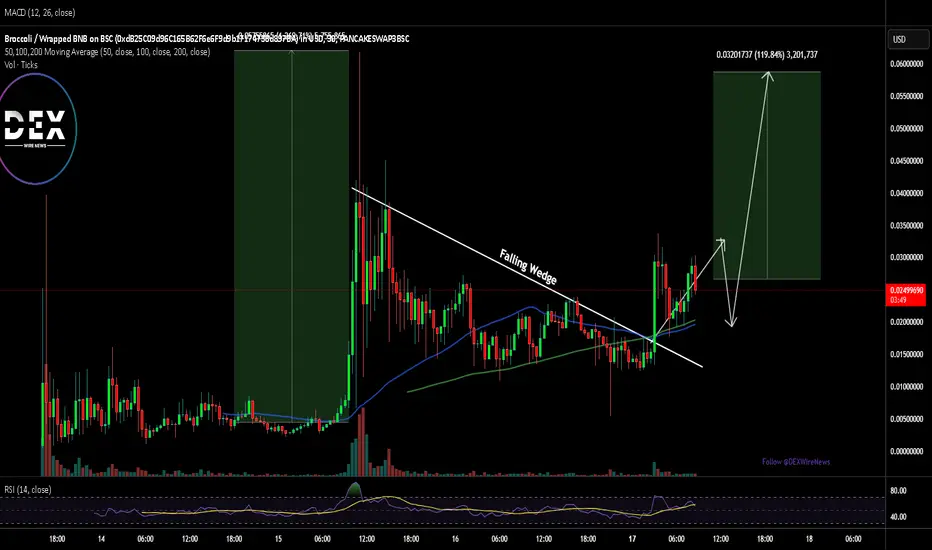
Broccoli Coin Poised for 150% Surge Amidst Falling Wedge PatternThe cryptocurrency market is no stranger to volatility, meme-driven narratives, and explosive price movements. Among the latest entrants capturing the attention of traders and meme enthusiasts alike is Broccoli (FirstBroccoli), a community-driven memecoin built on the Binance Smart Chain (BSC). After a staggering 1500% surge in the past week, Broccoli Coin is now showing signs of another potential breakout.
Technical Analysis
Broccoli Coin's recent price action has been nothing short of dramatic. After skyrocketing by 1500% in just two days, the coin entered a consolidation phase, forming a falling wedge pattern—a classic technical indicator often associated with bullish reversals.
A falling wedge is characterized by converging trendlines sloping downward, with the price making lower highs and lower lows. This pattern typically signals a build-up of bullish momentum as selling pressure diminishes and buyers prepare for a breakout. For Broccoli Coin, the key resistance level to watch is $0.045. A decisive breakout above this level could trigger a significant upward move, potentially retesting its all-time high (ATH) and beyond.
The recent 42.16% price increase in the last 24 hours, coupled with a 24-hour trading volume of $18 million, indicates strong interest and liquidity. With the market cap sitting at $25.7 million, Broccoli Coin is still relatively small compared to other memecoins, leaving ample room for growth if the bullish thesis plays out.
Why Broccoli Coin Stands Out
While Broccoli Coin is not yet listed on major exchanges, this could work in its favor. The lack of mainstream exposure means that early adopters have the opportunity to get in before the coin gains wider recognition. Additionally, the project's low market cap and high volatility make it an attractive option for traders seeking high-risk, high-reward opportunities.
The recent 1500% surge and subsequent consolidation suggest that the coin is still in its early stages of price discovery. If the falling wedge pattern resolves with a breakout, Broccoli Coin could see another parabolic move, especially if it garners more attention from the broader crypto community.
Conclusion: A Memecoin with Potential
Broccoli (FirstBroccoli) Coin is a fascinating blend of technical potential and fundamental appeal. The falling wedge pattern, combined with its unique narrative and strong community support, makes it a compelling candidate for traders and memecoin enthusiasts. While the road ahead may be volatile, the coin's recent performance and bullish setup suggest that it could be on the verge of another significant run.
As always, do your own research (DYOR) and approach with caution. But for those willing to take the risk, Broccoli Coin might just be the next memecoin to watch in the ever-evolving crypto landscape.
Bad Idea AI ($BAD) Surges 550%: Is This Just the Beginning?The cryptocurrency market has witnessed yet another explosive meme coin rally, with Bad Idea AI ( BCBA:BAD ) skyrocketing 554% in the past week. Initially launched as an experiment combining blockchain, artificial intelligence (AI), and decentralization, BCBA:BAD has evolved into a potential breakout player in the memecoin sector. Despite a recent cooling off, the token is showing strong signs of renewed momentum.
Technical Analysis
BCBA:BAD 's recent price action has followed a classic falling wedge pattern, a typically bullish setup that led to its massive breakout. After peaking, the token retraced to the 38.2% Fibonacci level, a key support zone where price stabilization often occurs before another leg up.
The Relative Strength Index (RSI) remains in overbought territory, suggesting possible consolidation before another surge. Similarly, the 38.2% Fib retracement level is a crucial support zone; a breakdown below could push prices toward the base of the falling wedge.
A breakout above the 1-month high or the recent all-time high could trigger another parabolic move toward uncharted territory.
With the crypto market experiencing a retracement, including Bitcoin ( CRYPTOCAP:BTC ) dipping to $95K, investors are closely watching if BCBA:BAD can sustain its momentum amid broader market corrections.
What Makes BCBA:BAD Unique?
Bad Idea AI ( BCBA:BAD ) is not just another memecoin; it is an experimental project that merges AI, blockchain, and decentralized governance. The project raises an intriguing question: Will AI be humanity’s greatest innovation or its downfall? With a focus on AI-driven decision-making and community participation, BCBA:BAD offers a unique narrative in the crowded memecoin space.
Market Performance and Tokenomics
- Current Price: $0.00000004193
- 24H Trading Volume: $5,963,170
- Market Cap: $26.8 million
- Circulating Supply: 626.4 trillion BAD
- Max Supply: 831.0 trillion BAD
Final Thoughts
BCBA:BAD 's explosive growth and compelling narrative make it a token to watch in the evolving crypto landscape. With strong technical support at the 38.2% Fib level and a rapidly growing community, the memecoin has the potential to ride AI hype to new highs—if it can maintain momentum.
However, high volatility remains a concern, and investors should approach with caution, keeping an eye on key support and resistance levels.
Will BCBA:BAD continue its meteoric rise, or is a correction on the horizon? Time will tell, but for now, it's certainly on the radar of traders and AI enthusiasts alike.

Pepe's analysis: buy again!!!hello friends
Considering the 70% drop, now the price has returned from a good support area, and by maintaining this rand, we will go for the specified goals, of course, with capital management...
Trade safely with us

Phemex Analysis #59: How to Trade TRUMP Like a ProNot long ago, PHEMEX:TRUMPUSDT.P coin was the talk of the crypto world, soaring to a staggering $83 in a spectacular rally. But as with every euphoric rise, the pullback was inevitable. TRUMP plunged to $14, leaving many traders wondering—was the hype over?
Yet, in the ever-unpredictable world of crypto, nothing stays still for long. TRUMP has shown signs of life again, bouncing back to $18.8. Now, the burning question is: Is this the beginning of another explosive rally, or is more downside ahead?
Let’s explore these possible scenarios and how you can trade TRUMP like a pro.
Possible Scenarios
1. Price Bouncing Back Strong
Momentum traders are eyeing a potential comeback as TRUMP attempts to reclaim lost ground. If the rally continues, key resistance levels to watch include:
• $20.5 – The first major resistance; breaking above this level could trigger a short-term rally.
• $28.3 – A key psychological level where profit-taking may occur.
• $43.8 – A critical resistance point; if TRUMP reaches this zone, it could attract significant buying interest and FOMO-driven momentum.
Pro Tips:
• If TRUMP breaks above $20.5 with high volume, consider entering a long position.
• As price approaches $28.3 and $43.8, take partial profits to secure gains while keeping exposure to further upside.
• Use trailing stop-losses to protect profits in case of sudden reversals.
• If price fails to break resistance levels, consider reducing exposure or waiting for a better entry.
2. Bearish Drop – Another Leg Down?
Despite the recent bounce, the market remains uncertain. If TRUMP fails to hold $14 and breaks below it with high volume, it could signal renewed bearish pressure.
Key psychological support levels to watch:
• $10 – A major round-number support level where buyers may step in.
• $5 – A historical low that could serve as a strong accumulation zone.
Pro Tips:
• If TRUMP breaks below $14 with high volume, consider shorting the asset to capitalize on further downside.
• For dip buyers, wait for signs of stabilization at $10 or $5 before entering. A strong bounce off these levels could present a great buying opportunity.
• Watch RSI and volume—if TRUMP drops on low volume with RSI divergence, it may indicate a potential bottom formation.
Final Thoughts
TRUMP coin remains a highly volatile asset, offering both risk and reward for traders. Whether it stages a strong recovery, drops to new lows, or consolidates in a range, staying patient and adapting to market conditions is key.
• For bulls – Look for volume-driven breakouts above resistance levels.
• For bears – Monitor price action near key supports and be ready to short if weakness prevails.
• For patient traders – Watch for confirmation signals before committing to a trade.
Crypto markets are unpredictable, but with the right strategy and discipline, you can trade TRUMP like a pro.
Would you go long, short, or stay on the sidelines? Drop your thoughts below! 🚀📉
Pro Tips:
Elevate Your Trading Game with Phemex. Experience unparalleled flexibility with features like multiple watchlists, basket orders, and real-time adjustments to strategy orders. Our USDT-based scaled orders give you precise control over your risk, while iceberg orders provide stealthy execution.
Disclaimer: This is NOT financial or investment advice. Please conduct your own research (DYOR). Phemex is not responsible, directly or indirectly, for any damage or loss incurred or claimed to be caused by or in association with the use of or reliance on any content, goods, or services mentioned in this article.

#MEME/USDT#MEME
The price is moving in a descending channel on the 1-hour frame and is adhering to it well and is heading to break it upwards strongly and retest it
We have a bounce from the lower limit of the descending channel, this support is at a price of 0.00424
We have a downtrend on the RSI indicator that is about to break and retest, which supports the rise
We have a trend to stabilize above the moving average 100
Entry price 0.00442
First target 0.00460
Second target 0.00475
Third target 0.00492

FARTCOIN INVERSE H&S ??A clear head and shoulder pattern seems to be forming around a key HTF S/R Level. It is my belief that we are currently at the "right shoulder" which is level with "left shoulder" and notably higher than the "head".
Should price climb back above the KEY S/R and above the 1H 200 EMA level (purple MA) that would mark a series of higher lows from the head onwards and a clear move up to the neckline. Should price clear the neckline I could see a mirrored price move of the way down going the other way working towards the bearish orderblock.
Now like with all altcoins currently, this move does rely on BTC making a similar bullish move, if bitcoin were to roll over and go sub $91,000 then FARTCOIN and others will continue the bearish trend as shown in the chart.
As always these are just my thoughts and could very well be wrong, if so it's best to have a plan in place and proper risk management.

$TRUMP Memecoin Tanks 80%: What Went Wrong?The $TRUMP memecoin, a token inspired by the 45th U.S. President Donald Trump, has seen a dramatic collapse in value, plummeting to $15 per token—a staggering 80% drop from its all-time high of $75. This sharp decline has left investors reeling, especially after initial euphoria surrounding its launch and Trump’s swearing-in ceremony in early January 2025. But what caused this downturn, and is there hope for a recovery?
A Memecoin Built on Political Sentiment
$TRUMP was launched as a PolitFi (political finance) token, capitalizing on the fervor surrounding Donald Trump’s political career and his iconic "Fight, Fight, Fight" battle cry following a dramatic event on July 13, 2024. The token was marketed as a way to own a piece of history, celebrating Trump’s resilience and leadership. At its peak, $TRUMP reached $75, driven by hype and the emotional connection of Trump’s supporters.
However, memecoins like $TRUMP are inherently volatile and heavily reliant on sentiment rather than utility. Unlike projects with tangible use cases or technological innovations, $TRUMP’s value is tied to the popularity and perception of its namesake. As the initial excitement faded, so did the token’s price, leading to the current downturn.
Technical Analysis
From a technical perspective, $TRUMP’s price action tells a story of rapid gains followed by an even sharper correction. Here’s what the charts are showing:
1. Price Collapse:
$TRUMP has fallen from its all-time high of $75 to $15, marking an 80% loss. This kind of volatility is not uncommon in memecoins, which often experience parabolic rises and steep declines.
2. Immediate Resistance:
The $48 level is a critical resistance point for $TRUMP. Breaking above this level could reignite bullish momentum and signal a potential recovery. However, given the current market sentiment, this seems like a challenging hurdle.
3. Market Cap and Volume:
Despite the crash, $TRUMP still holds a market cap of $3.08 billion, ranking it #37 on CoinMarketCap. The 24-hour trading volume remains high at $900 million, indicating that there is still significant interest in the token. This liquidity could provide a foundation for a potential rebound.
4. Sentiment and RSI:
The Relative Strength Index (RSI) is in oversold territory, suggesting that the selling pressure may be exhausting itself. If buyers step in, this could create a short-term bounce, though sustained recovery would require a shift in market sentiment.
What Caused the Crash?
Several factors likely contributed to $TRUMP’s dramatic decline:
- Hype Fading: Memecoins often experience a "pump and dump" cycle, where early investors cash out after the initial surge, leaving latecomers to bear the losses.
- Lack of Utility: Unlike utility-driven cryptocurrencies, $TRUMP lacks a clear use case, making it vulnerable to sentiment-driven price swings.
- Market Conditions: Broader market trends and risk-off sentiment in the crypto space may have exacerbated the sell-off.
Conclusion
The rise and fall of $TRUMP serve as a reminder of the risks associated with memecoins. While they can offer explosive gains, they are equally prone to devastating losses. For $TRUMP, the path to recovery hinges on regaining market confidence and finding new catalysts to drive demand.
