AMC - Building momentum but know your levels
Double bottom breakout in progress.
Price just bellow next supply zone..building energy for a big move.
I'd expect test of 29, with trendline in play.
pullback there and consolidation above 24 should set it for next leg up around 44.
Memestocks

AMC next leg up | Road to $100 a sharethis is what I believe the next leg could look like, I expect further sideways action as we hover above the daily 200 EMA. We could make another move up to $30 next week, again not financial advice just what I believe will happen next & wanted to share my thoughts. LFG APES

Meme PowerIf you're going to play any meme NOW, it is BBBY.
GME and AMC have run up to high resistance levels so if you didn't join early on, you're too late.
BBBY on the other hand, still has room to go.
Looking for closes on the hourly above 28, 31 ish areas and squeeze can commence.
Purely degen play. No point in charting other than resistance levels.
Cohen all over this as his next play. This may be the next (dare I say...) MOASS.
Do your own DD.
NFA.
Whole market is just on some drugs. Might as well join in on the fun if you like gambling lel.
In 04/01 30c
04/08 35c

Investigating GME (I am super excited)I AM NOT A FINANCIAL ADVISOR. I passed the Series 6, but failed the SIE before I could take Series 63 hahahaha.
**************
Following current market cycles we seem to be having ourselves a bit of a melt up even with everything going on. We have also a lot of incoming news, rotation into beat up stocks, and a lot of hype built up on meme stocks. Could this be it?
To start, volume is finally picking up! Fees to borrow are crazy high and short #s are posted higher than usual. We are above the 200 Daily and Weekly averages. We are about to have a bullish MACD cross on the weekly. The fibs look setup for some bouncy movement. The list can go on and on...
Based off my gut , I am speculating that GME can fill the $290 range gap within the next few weeks. Although I think it is reasonable to assume a dip to test the lows is in order, I have been wrong in the past. Weekly MACD crosses usually have a dip for confirmation before continuing upwards. Therefore I am posting 3 possible scenarios I imagine the price action is headed.
Scenario 1 assumes rapid upside to fill gap with very minimal dips or consolidation. This would be wild!
Scenario 2 assumes a little dip and a little consolidation before push up towards filling the gap. I see this being the most realistic scenario given we could use a few days of consolidation and possible a dip as the market cools off from recent price action. Hoping this happens soon!
Scenario 3 assumes downside to at or around $58, which would scare out a lot of people and then gradual upside to fill gap with very minimal dips or consolidation. This scenario is a worst case scenario, and I imagine would only happen if the market has a fast sell off from recent highs dragging everything down.
Wherever the price goes from there idk yet! So we wait :)
*************
Please careful with any short term plays, you don't wanna be getting too caught up in premium with options especially if we drop. Also some additional wisdom is that sometimes its safest and smartest to hedge your positions just in case you don't get the timing right.
Not financial advice as always.
Please feel free to donate some BTC or ETH as always.
BTC Address:
1HrvESU1Kin56C9y12jvhTCfmy7euj5HKc
ETH Address: (ERC 20)
0x3154ed34fcfd6e54f1747c7f78b2397134fbb17c

Long The High Risk Psilocybin Mushroom Therapy Secular Bull RunNot looking for an immediate turn around because Macro-Market conditions and retail risk tolerance is severely negative right now. However, this sector has huge potential to be a bullish meme in years ahead. Think of getting into Pot Stocks 2.0 before the moon pumps
In 2018–19, the United States Food and Drug Administration (FDA) granted breakthrough therapy designation to facilitate further research for psilocybin in the possible treatment of depressive disorders. As of 2020, research on the use of psilocybin indicated it caused hallucinations with inability to establish reality from fantasy, panic reactions, and possible psychoses at high doses.
In November 2020, the U.S. state of Oregon legalized psilocybin for people age 21 and older, and decriminalized possession or use of psilocybin mushrooms for medical conditions, such as depression, anxiety, or PTSD.

Alphabet Inc. (GOOG) bullish scenario:The technical figure Triangle can be found in the US company Alphabet Inc. (GOOG) at daily chart. Alphabet Inc. is an American multinational technology conglomerate holding company. It was created through a restructuring of Google on October 2, 2015, and became the parent company of Google and several former Google subsidiaries. It is one of the Big Five American information technology companies, alongside Amazon, Apple, Meta and Microsoft. The Triangle has broken through the resistance line on 10/03/2022, if the price holds above this level you can have a possible bullish price movement with a forecast for the next 8 days towards 2 815.67 USD. Your stop loss order according to experts should be placed at 2 517.22 USD if you decide to enter this position.
Google is in talks to buy cybersecurity consultancy Mandiant, which two years ago discovered the infamous SolarWinds hack, according to a person with knowledge of the discussion. A deal could bolster Google’s cloud computing business, which generates more than $19 billion annually but has been losing billions of dollars a year, and help it compete with bigger rival Microsoft, which also is reportedly interested in buying Mandiant.
Risk Disclosure: Trading Foreign Exchange (Forex) and Contracts of Difference (CFD's) carries a high level of risk. By registering and signing up, any client affirms their understanding of their own personal accountability for all transactions performed within their account and recognizes the risks associated with trading on such markets and on such sites. Furthermore, one understands that the company carries zero influence over transactions, markets, and trading signals, therefore, cannot be held liable nor guarantee any profits or losses.

An observation on the 12-Hour SHIB Chart: Long Swing Trade*Extreme green candles are not recommended to open a trade on in a down-trend. Not all trades are successful. Do your own Due Diligence to maximize your success with this observation before making ANY trade. This is not financial advice; this is just an observation. Don't invest with currency you're not willing to lose*
Crypto Currency: SHIBUSD
Time Frame: 12-Hour
Main Chart: 5 EMA , 13 EMA , 20 SMA
Sub Charts: MACD , RSI 14 with 14 SMA line, Volume with 20-period average volume line
Main Chart Musts: 13 EMA Must cross over the 20 SMA . 12-Hour Candle body and lower wick Must be completely above the 13 EMA . Must exit position on ANY close under the 5 EMA .
Sub Chart Musts: MACD must be green. RSI must be relatively or recently over-sold near 30; or the RSI must be testing support on the mid-line (50), and the RSI must be above the RSI 14 SMA line. Volume must be relatively close to, or above, the 20-period average volume line.

Carrefour (CA.pa) bearish scenario:The technical figure Triangle can be found in the French company Carrefour (CA.pa) at daily chart . Carrefour is a French multinational retail corporation headquartered in Massy, France. The eighth-largest retailer in the world by revenue, it operates a chain of hypermarkets, groceries stores, and convenience stores, which as of January 2021, comprises its 12,225 stores in over 30 countries. The Triangle has broken through the support line on 08/03/2022, if the price holds below this level you can have a possible bearish price movement with a forecast for the next 22 days towards 15.755 EUR. Your stop loss order according to experts should be placed at 18.310 EUR if you decide to enter this position.
Carrefour it was confident about its turnaround after Europe's largest food retailer delivered record free cash flow of 1.23 billion euros ($1.40 billion) and a 7.7% rise in operating profit for 2021. On the back of these strong results Carrefour handed investors an 8% dividend hike to 0.52 euros per share and launched a new share buyback plan of 750 million euros for 2022. Cash is also key to the French food retailer's plans to step up digital commerce expansion without the extra financial resources that would have been on hand if two planned tie-ups last year had not failed - one with Canada's Couche-Tard and one with France's Auchan.
Risk Disclosure: Trading Foreign Exchange (Forex) and Contracts of Difference (CFD's) carries a high level of risk. By registering and signing up, any client affirms their understanding of their own personal accountability for all transactions performed within their account and recognizes the risks associated with trading on such markets and on such sites. Furthermore, one understands that the company carries zero influence over transactions, markets, and trading signals, therefore, cannot be held liable nor guarantee any profits or losses.

Boeing (BA) bearish scenario:The technical figure Descending Triangle can be found in the US company The Boeing Company (BA) at daily chart. The Boeing Company is an American multinational corporation that designs, manufactures, and sells airplanes, rotorcraft, rockets, satellites, telecommunications equipment, and missiles worldwide. The company also provides leasing and product support services. Boeing is among the largest global aerospace manufacturers; it is the third-largest defense contractor in the world based on 2020 revenue, and is the largest exporter in the United States by dollar value. Boeing stock is included in the Dow Jones Industrial Average. The Descending Triangle has broken through the support line on 05/03/2022, if the price holds below this level you can have a possible bearish price movement with a forecast for the next 17 days towards 150.00 USD. Your stop loss order according to experts should be placed at 223.23 USD if you decide to enter this position.
Boeing Co. has preliminary plans to boost production of its cash cow 737-family narrowbody to around 47 per month by the end of next year, as the U.S. planemaker looks to extend its recovery from successive crises, two people familiar with the matter said. After slashing production due mainly to the pandemic, Boeing and European rival Airbus SE are seeing more demand for their medium-haul passenger jets, with both planemakers adding eye-catching deals to their order books in recent weeks.
Risk Disclosure: Trading Foreign Exchange (Forex) and Contracts of Difference (CFD's) carries a high level of risk. By registering and signing up, any client affirms their understanding of their own personal accountability for all transactions performed within their account and recognizes the risks associated with trading on such markets and on such sites. Furthermore, one understands that the company carries zero influence over transactions, markets, and trading signals, therefore, cannot be held liable nor guarantee any profits or losses.

Consolidation Im gathering more shares at this low lvl today i think we will stay at this price lvl rest of today. (2.30 - 2.55 maybe 2.6ish)
#BBIG #notfinancialadvice

#AMC - YOU TRIED, BLESS YOU ALL...Enjoy. For the record, i said back in Dec2020/Jan2021, that this wouldn't end well for the simpletons thinking social media terms like "diamond hands" and "hold the line" ever would have worked out, and thanks to Evergrande (3333.HK) and Inflation, its NOW time for those little slogans to REALLY get tested.
Lets see how "diamond" your hands are soon, when you're wife is blowing your neighbour for a can of beans.
as i said....Enjoy...

AMC - Nasty Double Top. All Eyes On SupportWhile NYSE:AMC broke out of 200EMA resistance earlier this month, things do not look good for longs currently.
We see a nasty double top on a strong resistance level, followed by a close below the recent upwards swing. We see both buyers and sellers trying their best to steer price levels to go either way, as seen from multiple dojis on a CRUCIAL support level. Whether or not this level turns into resistance, is anyone's guess.
Personally, I am looking to enter a short position once price falls through support and sets us up for a beautiful double top setup.
As with meme stocks, I would refrain from holding my position for a prolonged period of time in the event of an unlikely short squeeze.
Will be monitoring AMC closely today.
Happy trading

Printer turned into shredder2020-going on:
-Pandemic with failed vaccines and endless boosters
-Supply shortages
-Struggling job market
-Skyrocketing bond purchases
-Tapering right after
-Never ending tensions between the US and China
-Never ending tensions between the US and Russia
-Extreme tensions between Russia and Ukraine + western countries
-Small and mid cap stocks tanking non stop
while the same tech stocks are pumping non stop over and over again, keeping the market alive
Here is my opinion:
I just don't see any logical reason to keep it going like that, like we have seen in the past months/years.
You can't keep running non stop without collapsing and gravity always wins. All the perma pumpers,
especially the new generation of meme and pandemic traders need a reality check. It's easy to scream
non stop "to the moon...new all time high...stocks only go up...etc." in a propped up stock market.
It's funny how they disappear in online forums when the market suddenly decides not to gap up non stop.
They literelly don't know what to do. That goes for "small" traders, but also for traders who gained
many followers during that time, acting like wise gurus.
Have fun trading BOTH ways and trade the charts, not your hopes and wishes (or blindly follow others)

$ATER => WatchlistMaybe Aterian deserves a spot on a trader's watchlist here. Above 4$, crazy things COULD happen.
Those 2021 highs most likely won't be seen any time soon if ever again, but already a mild retrace to the 23 or 38 retraces would mean big gains.
A break above 4$ and closing above it at least on daily timeframe is mandatory here though, for putting some money on line in my opinion.
Good Luck on your trading!

Important Buy Signal Flashing for AMC!Hey Traders,
As you can see on the Daily Chart of AMC. A Technical Indicated a BUY. Historically these Indicators work very well among stocks, crypto, and forex. Even in the past of AMC stock, the BUY signals were great for this. However there is a chance I am wrong and this keeps going down, maybe take this to start DCAing. AMC's target for the recovery is $50 (Fibonacci Golden Pocket). We can put in calls/ longs to be in massive profits!
Safe trading,
-Pulkanator

FinecoBank (FBK.mi) bullish scenario:The technical figure Falling Wedge can be found in the Italian company FinecoBank S.p.A. (FBK.mi) at daily chart. FinecoBank S.p.A., known as FinecoBank or just Fineco is an Italian bank that specializes in online brokerage. Launched in 1999 with its Fineco Online service for retail traders, Fineco became a listed company in 2014 and has been independent from UniCredit banking group since 2019. FinecoBank is a constituent of FTSE MIB (since 2016), the blue chip index of the Borsa Italiana. Since 2015 it has over a million customers in Italy, where its role has been compared to that of Schwab in USA. The Falling Wedge has broken through the resistance line on 10/02/2022, if the price holds above this level you can have a possible bullish price movement with a forecast for the next 35 days towards 16.550 EUR. Your stop loss order according to experts should be placed at 14.280 EUR if you decide to enter this position.
Italy's FinecoBank said its full-year net profit hit a record 349.2 million euros ($399 million) driven by stronger net commissions, lifting its shares on Wednesday. The bank proposed a dividend of 0.39 euro per share. FinecoBank said in a slide presentation it expects 2022 net financial income - the net interest income and profit from treasury management - to at least match 2021, when it was 280 million euros.
Risk Disclosure: Trading Foreign Exchange (Forex) and Contracts of Difference (CFD's) carries a high level of risk. By registering and signing up, any client affirms their understanding of their own personal accountability for all transactions performed within their account and recognizes the risks associated with trading on such markets and on such sites. Furthermore, one understands that the company carries zero influence over transactions, markets, and trading signals, therefore, cannot be held liable nor guarantee any profits or losses.

Easy 80% move to the upsideI don't know if AMC will make a new high, although I think it will, still this is a nice trade as I believe it will retest the breakdown level and the 2015, 2017 high which is a nice 80% higher. Would set a stop at $17 range. GL friends. Please follow.

IAG (IAG.mc) bullish scenario:The technical figure Triangle can be found in the Spanish company International Consolidated Airlines Group S.A. (IAG.mc) at daily chart. International Consolidated Airlines Group S.A., trading as International Airlines Group and usually shortened to IAG, is an Anglo-Spanish multinational airline holding company. It was formed in January 2011 after a merger agreement between British Airways and Iberia, the flag carriers of the United Kingdom and Spain respectively, when British Airways and Iberia became wholly owned subsidiaries of IAG. The Triangle has broken through the resistance line on 10/02/2022, if the price holds above this level you can have a possible bullish price movement with a forecast for the next 21 days towards 2.2830 EUR. Your stop loss order according to experts should be placed at 1.8120 EUR if you decide to enter this position.
IAG is set to cancel its takeover of Air Europa after European regulators indicated they would not allow it to go through without further concessions, though CEO Luis Gallego hasn't given up hope of some sort of tie-up. British Airways and Iberia owner IAG's proposed acquisition from privately held Spanish company Globalia was designed to help the group's Madrid hub to compete more effectively against its European rivals. Air Europa provides connections to Latin America as well as serving destinations in Europe.
Risk Disclosure: Trading Foreign Exchange (Forex) and Contracts of Difference (CFD's) carries a high level of risk. By registering and signing up, any client affirms their understanding of their own personal accountability for all transactions performed within their account and recognizes the risks associated with trading on such markets and on such sites. Furthermore, one understands that the company carries zero influence over transactions, markets, and trading signals, therefore, cannot be held liable nor guarantee any profits or losses.

$AMC to the moon pt.2 ?? Is the ape army back?? LONG SetupI really like AMC here.
Came back beautifully to the 88 retrace of a major harmonic structure.
RSI looks like its ready to go, too
Easy risk management possible

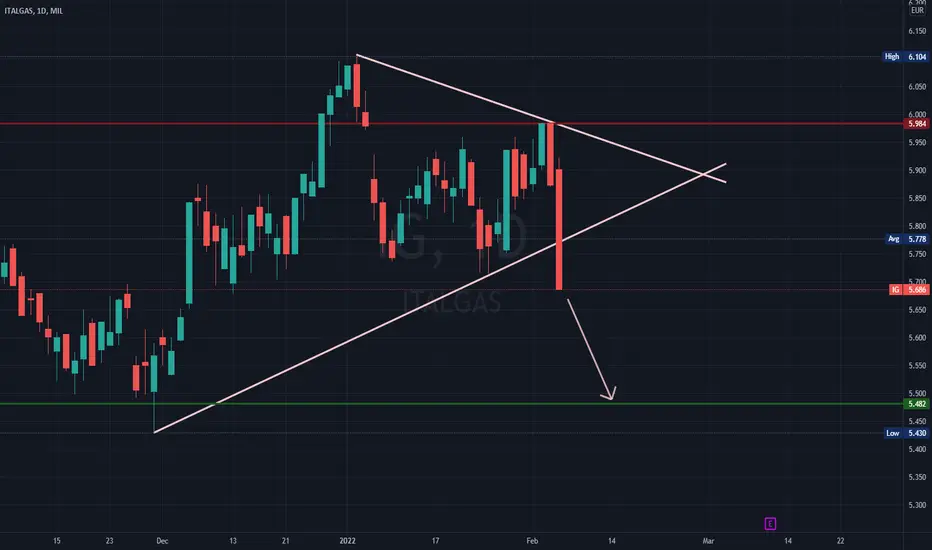
Italgas (IG.mi) bearish scenario:The technical figure Triangle can be found in the Italian company Italgas S.p.A. (IG.mi) at daily chart. Italgas S.p.A. is an Italian company specialised in the distribution of natural gas. It is listed on the Milan Stock Exchange and included in the FTSE MIB index. The Triangle has broken through the support line on 04/02/2022, if the price holds below this level you can have a possible bearish price movement with a forecast for the next 15 days towards 5.482 EUR. Your stop loss order according to experts should be placed at 5.984 EUR if you decide to enter this position.
Italgas and Buzzi Unicem have signed an agreement for the development of a feasibility study on the implementation of Power to Gas plants in combination with Carbon Capture Systems at Buzzi Unicem's production plants. The implementation of these technologies is aimed at promoting the decarbonization of cement and concrete production processes in order to increase environmental sustainability and facilitate the energy transition.
Risk Disclosure: Trading Foreign Exchange (Forex) and Contracts of Difference (CFD's) carries a high level of risk. By registering and signing up, any client affirms their understanding of their own personal accountability for all transactions performed within their account and recognizes the risks associated with trading on such markets and on such sites. Furthermore, one understands that the company carries zero influence over transactions, markets, and trading signals, therefore, cannot be held liable nor guarantee any profits or losses.
meme stocks showing pairity (HOOD, GME, AMC)the grouping of retail longs and its mothership, Robinhood are showing bullish divergence from oscillators and oversold conditions in rsi. the relative strenght based qqe signals strategy has put in nothing but shorts and faile long entries. the chances of the strategy continuing to make money short is low.
elliott wave sage of youtube has released a video detailing why this wave 5 leg down could lead to reversal. a cross above the VWMA 12, close, 9 in HOOD would be bullish for this group. if we fail the 1.618 and hold or fakeout bear the 0, or continue above 13.89 immediately, not breaking 12.39, a trip over 16 could be in the cards.
this stock is a great buy under $10, and shows there is attractive value around these internal and fundamental levels to do with proportions of debt to earnings with the credit they have and p/e compared to cash on hand.
ask yourself would robinhood buy itself at these prices. if the answer is yes then its a good time to invest. they are a brokerage like any other. they make money when people change their outlook. prices can go up or down, but they profit from volatility and uncertainty.

The cycle theory is not over 🚀Since the pandemic, AMC and other stocks have been heavily manipulated and we are feeding more and more to the kolaps. It's not financial advice just a technical analysis from my side

SAP SE (SAP.de) bearish scenario:The technical figure Descending Triangle can be found in the German company SAP SE (SAP.de) at daily chart. SAP SE is a German multinational software corporation, that develops enterprise software to manage business operations and customer relations. The company is especially known for its ERP software. SAP is the largest non-American software company by revenue, the world's third-largest publicly-traded software company by revenue, and the largest German company by market capitalisation. The Descending Triangle has broken through the support line on 28/01/2022, if the price holds below this level you can have a possible bearish price movement with a forecast for the next 26 days towards 100.00 EUR. Your stop loss order according to experts should be placed at 125.32 EUR if you decide to enter this position.
SAP said on Thursday it has agreed to buy a majority stake in privately held U.S. fintech firm Taulia as the German business software group seeks to expand its presence in supply-chain financing and working capital management. SAP, said it was looking at opportunities in the ‘metaverse’ - virtual online worlds where people can work, play and socialize.
Risk Disclosure: Trading Foreign Exchange (Forex) and Contracts of Difference (CFD's) carries a high level of risk. By registering and signing up, any client affirms their understanding of their own personal accountability for all transactions performed within their account and recognizes the risks associated with trading on such markets and on such sites. Furthermore, one understands that the company carries zero influence over transactions, markets, and trading signals, therefore, cannot be held liable nor guarantee any profits or losses.
