$Clov in the ascending channeltp1=1.6 BC=$10.5 *reached*
tp2=0.6 XA=2 BC=$12
tp3=0.78 XA=2.6 BC=$14
tp4=0.88 XA=$15
tp5=1.13 XA=3.6 BC=$19
tp6=1.27 XA=4.2 BC=$22
tp7=1.41 XA=$25
tp8=1.6 XA=$31
Memestocks

Trade Idea💡: Ticker (BB) Black Berry 🚀Ticker: (BB) Black Berry : Eyes on BB Above 16.25 with volume .
✅As you can see here we have formed a bullish pennant on the 1 hour backed with strong volume .
The red spinning top at supply closed with over 144 million volume . After a healthy retracement to
the downside, we were able to find support just below the 9MA (blue curve) where we formed
an engulfing bullish pinbar .
✅We also have a double doji inside holding the 9MA (Circled Angle). This tells me that a big move to the upside
or downside is approaching. Based upon the previous trend and unusal order flow. I am anticipating
a strong impulse to the upside in the near future.
✔️Confirmation: I would like to see BB gain strong volume above 16.25 for an upside move to 18.
🎯Anticipated Targets & Stop loss:
Target 1: 16.25
Target 2: 16.50
Target 3: 17.00 - 18.00
Stop Loss: 15.75
🤝Contracts:
High Risk- 17.5 BB 06/04 EXP
Low Risk - 15 BB 06/11/21 EXP

Ticker: (BB) Black Berry - Swing Trade Idea: June 3, 2020 🚀Ticker: (BB) Black Berry : Eyes on BB Above 16.25 with volume.
✅As you can see here we have formed a bullish pennant on the 1 hour backed with strong volume.
The red spinning top at supply closed with over 144 million volume. After a healthy retracement to
the downside, we were able to find support just below the 9MA (blue curve) where we formed
an engulfing bullish pinbar.
✅We also have a double doji inside holding the 9MA (Circled Angle). This tells me that a big move to the upside
or downside is approaching. Based upon the previous trend and unusal order flow. I am anticipating
a strong impulse to the upside in the near future.
✔️Confirmation: I would like to see BB gain strong volume above 16.25 for an upside move to 18.
🎯Anticipated Targets & Stop loss:
Target 1: 16.25
Target 2: 16.50
Target 3: 17.00 - 18.00
Stop Loss: 15.75
🤝Contracts:
High Risk- 17.5 BB 06/04 EXP
Low Risk - 15 BB 06/11/21 EXP

$GMBL Update & Prediction$GMBL met resistance at its previous resistance level at near the $12 level, a break above $12.15 would bring its next target to near $14.50. Watching closely, needs further volume and momentum

$BB Analysis & Predictions Based on Parabolic Squeeze MomentumWith BB now reaching a new high since the previous January squeeze, the level reached was approximately near the $20 Level, or the 61% Retracement level. It is now currently using the 50% retracement level of $17 as support for a potential next leg up. If parabolic movement continues in the "meme stocks" , you can look for your next targets of resistance levels near $20 (61% retracement) and then $24 (78% retracement).
The zones are as shown on the chart, shows how these fibonacci retracement levels play a significant role in determing support and resistance on 1D chart.
My position on this was strictly options, I purchased so called YOLO calls on Tuesday of this week
6/4 $16 Calls - 0.86 /c
as well as yesterday at the close purchased
6/11 $20 Calls - 3.30 / c
Sold the June 4's for 4.85 at the open today, cant complain about that gain and they expire soon, and I will hold these $20 calls for next week if the current support zone holds.
GLTA, follow for more

be careful at the price zone of ($43-$53)AB=0.61 XA
BC=1.13 AB=$53
$43 is the target of butterfly pattern that I published recently.

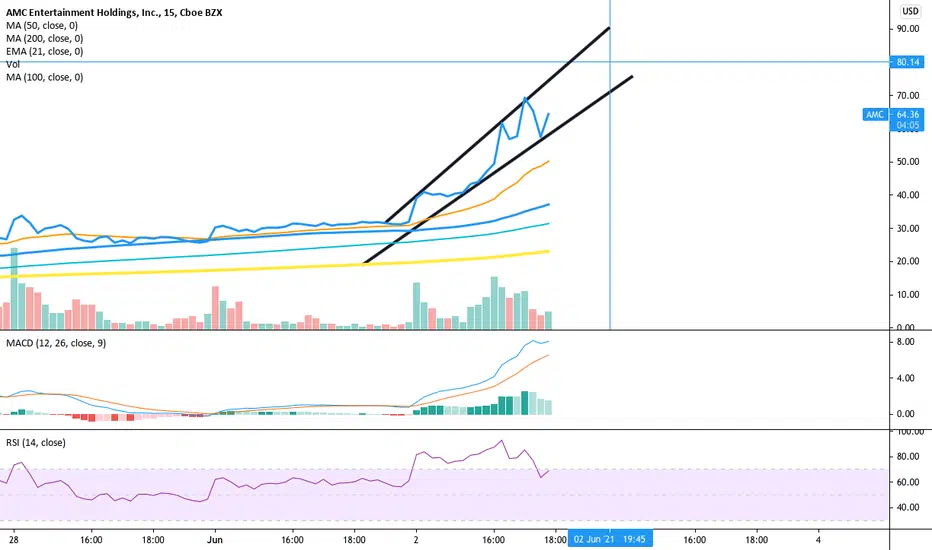
AMC might close above $80Momentum is on its side and whispers are that the shorts have actually been leaning into the short and sizing up hoping that the retail traders have "paper hands". If retail holds, continues the frenzy, the new short positions will have to cover. Not sure who in their right mind would lean into that short but it's contrary to what happened with GME where they got out of their shorts as it went up.
No value, just a momentum and short squeeze play. probably best to play it through options so you don't get stuck with stock. Psychologically we always want to see the next round number. Unusual activity in the $73 call options so I think it shoots to $80 briefly after it gets back to its intraday high of 72.62
AMC Running out of Banana, 45 is hard?With other streaming services running wild and Apes seems running out of bananas, this making the hold almost reach it's perk. I want to see AMC break 45 - 50, but historically and with current pandemic situation, I'm not so sure about it. What do you think?

TLRY Potential BreakoutAll meme stocks are beginning to breakout.. maybe TLRY is next?
Great set up here. We have the 200MA and the POC (volume profile) giving us support @ 16.50-17.00
Here are the levels we are looking for:
Entry (Full Pos) @ 18.75
1st Target @ 22.06
2nd Target @ 24.42
Watch for increasing volume for entry and be patient.


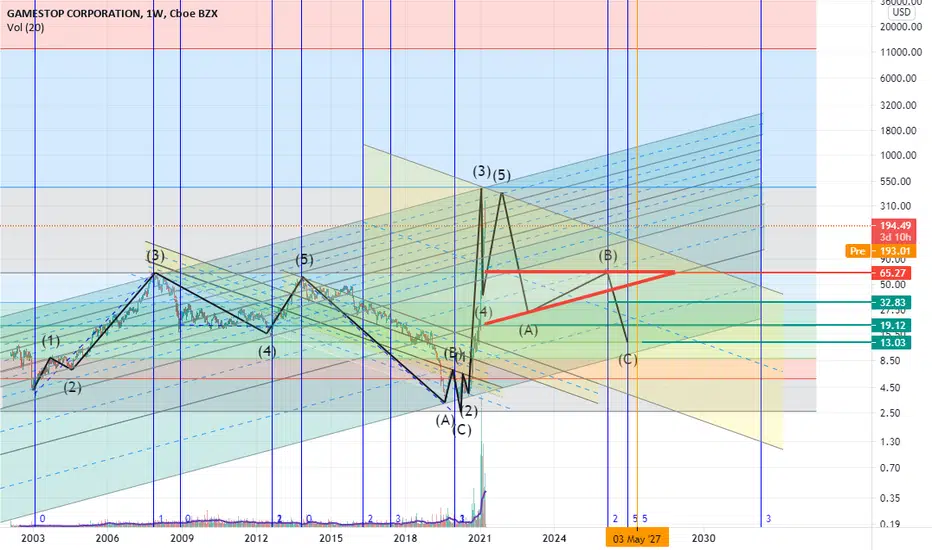
$GME is a shark and cypher with the target of $3500recently I was extremely bearish on GME because of a reversal butterfly harmonic pattern with the target of $9. today I noticed a big shark or cypher on the chart and changed my mind.
AB=0.61 XA
BC=1.13 AB
tp1=0.78 BC=$32
tp2=0.88 BC=$44
tp3=0.78 XA=$132
tp4=1.27 BC=$154
tp5=0.88 XA=$207
tp6=1.6 BC=470
tp7=1.13 XA=$626
tp8=2 BC=$1607
tp9=2.24 BC=$3482

the extreme volatility of $GMEtargets have obtained using the Fibonacci levels of the shark harmonic pattern mentioned in the previous post.


Palantir breaking downSince PLTR IPO, the price has been ranging in 3 areas.
It appears we are breaking down from the strongest support (bottom on range 2), and will potentially enter the range 1. This level is also coincidental with 61.8% Fibonacci Retracement line.
I would be willing to enter a position for a long-term trade, if we can reach the high of the IPO, which is approximately $11

Goodboy DogeThis is not investment advice, unless you are considering investing in a puppy. In that case...bullish..
#dogecoin to the moon BITFINEX:DOGEUSD

Butterfly reversal scenario with $215 target on the 3rd wavein the last post, I had about AMC I showed you we are on the 3rd wave of Elliott and the target could be $215. if this target is true it could have a butterfly reversal scenario. with this target and butterfly harmonic pattern I have calculated the 4th wave and the 5th wave of Elliott and the ABC correction. you could see the targets in the chart.

don't trap in the long-term ABC correctionthe microwave 5 of wave 5 has remained but the risk of it is too much
The key levels on the path of 9Yellow: what you saw the last week
Green: what you saw on Friday
Red: what you will see in the future

GME could rise to $530 or $560 after it drops to $9targets have calculated with butterfly and shark harmonic patterns.

the targets of $Plug with harmonic patternsXABC is a butterfly harmonic pattern:
AB=0.78 XA
BC=0.38 AB
tp1=1.6 BC=$62 *reached*
tp2=1.27 XA=$134
tp3=2.24 BC=$325
other targets with X345 cypher or shark possibility:
tp4=1.13 3-4=$94
tp5=1.41 3-4=$155 *more likely*
tp6=1.6 3-4=$220
since other targets of butterfly are higher than $75 the price zone of could not be dangerous, but be careful at this price zone.


