GME Bullish Setup Jun 6-7th Update#GME had a very strong close today, hitting my Main Target box to the penny!
#TTR was long #GME (again) from $24.54, we are 50% out today, near the highs, holding the rest for Friday.
#TTR was also long GME from $13.01 and we exited the most at 64.54, 57 and 51 on the main gap up day!
#TTR is also long #AMC, all the targets were posted
Memestocks

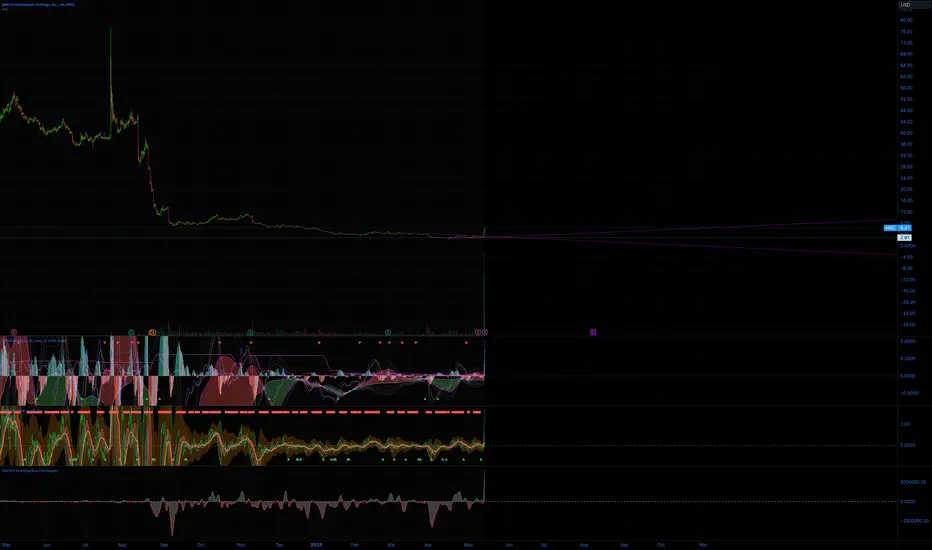
AMC pumps price and volume into fair value zone LONGAMC is on a 4H chart with a set of VWAP bands overlaid In the past two trading sessions price
and volume have pumps and so also the PV Trend indicator. There is no fundamental
footprint on this move. it is a pure meme much like a similar move of GME. I will go long
here hoping to ride the momentum and capture profit. I will set a stop loss fo 10% n
recognition of the volatilit The final target is the $ 120 range pivots of April and
August 202. The initial target is the $35 range of the ranging zone of August 2023. Upon
reaching the first target I will cut the position to 50% for the leg higher. I will cut the position
if momentum fades especially if the volume fades with it. This will be interesting at the least
and highly profitable at the very most.

The Ongoing GameStop Saga: A New Chapter UnfoldsThe GameStop (GME) story continues to captivate both retail traders and Wall Street veterans alike. 🏆 While the epic showdown between retail investors and hedge funds last year marked a significant chapter, recent developments indicate that this saga is far from over. Let's take a closer look at the latest twists and turns in the GameStop narrative.
A Rocky Start to the Week 📉
On Monday, GameStop opened in a monthly supply zone—a critical price area where selling pressure is typically high. As anticipated, the stock faced significant resistance and dropped 34% by the end of the trading day. This movement is a stark reminder of the volatility that continues to characterize GME.
The Technical Perspective 📊
For those following the charts, it's crucial to note that buying GameStop above $12.75 means paying a premium for a stock currently in a monthly supply zone. The $12.75 mark represents a discount price for potential buyers, suggesting a more favorable entry point based on technical analysis. Above this level, investors might be taking on additional risk by purchasing at higher prices within a supply zone where sellers dominate.

Next support $4.2 & the $3 ?Selling on UMVD, Angle 1 is as low as $3, that will be good R:R entry for long. I don t thing 4.2 will hold is we keep seeing more selling.

🔥 HONK: New Memecoin On The Block - You're still early!Memecoins like PEPE, Bonk, Floki etc. have been performing extremely well over the last few months. Their usecase is debatable, but does that really matter when a token rises 1,000%?
Where most memecoins have already seen a massive upwards move, HONK has seemingly just started after it rose over 150% over the last two days.
With a marketcap of around 5 million, this token can see some very decent upside if more investors start looking at it. Seeing that Bonk has a 3B marketcap, I don't see why Honk couldn't get to 1B at least.
A 20x is far-fetched, but we all know that everything is possible in bullish conditions. Seeing this signals' risk-reward is over 35, a small investment (with an even smaller loss) can result in a potentially massive gain.

GameStop Stock Evokes Dreams of Rocket Ships and Diamond HandsShares of the video game store tested retail traders’ survival skills. But the meme stock madness also bamboozled the pros.
In the span of just a few regular trading sessions, with some stomach-churning pre-market action in between, GameStop once again made headlines. Roughly three years ago, Keith Gill — known as “Roaring Kitty” on the internet (mostly Reddit) — triggered a huge rally in the shares of a little known video game retailer called GameStop NYSE:GME .
The Hidden Gem
Roaring Kitty took a big long position in GameStop for his belief that it was a company with a lot of potential. And at the same time, he blamed the big bad hedge funds for keeping a lid on share-price growth by shorting the living thing out of it.
Mr Kitty’s thesis caught the attention of fellow retail traders on Reddit’s r/WallStreetBets chat board, a place where self-described “degens” exchange fast-churning trading ideas. Soon after, shares were flying high, riding on gains of more than 2,000%. GameStop was set free and institutional investors got smoked.
These were the good old days of speculative pumps and the absolute power of like-minded individuals seeking the thrill of quick profit and adrenaline rush. And — it seems — we’re back at it again with the meme stock corner going fully bananas.
Roaring Comeback
Roaring Kitty’s X account switched the lights on after three years of silence. In a rather vague post, he published a drawing of a man leaning forward . Boy, did that get understood in all the possible ways. Shares took off by as much as 75% a day after that post went live. A breakneck rally went on for a few more days, evoking dreams of rocket ships and diamond hands.
A week later, none of that is there anymore. Shares are not only back where they were before the surge — they’re doing worse. The rollercoaster ride lifted the stock from $20 on Monday to $80 on Tuesday, a 300% pop per share.
By Friday, shares had briefly dipped below $20, pulling off a boomerang move and erasing 75% from the stock’s weekly peak.
And, this is how GameStop tricked retail investors into believing that this the GameStop rally 2.0. But, before that, it smacked professionals with huge losses on the way up.
Same Old, Same Old
Professional money managers had borrowed about 30% of all shares outstanding for — you guessed it — shorting purposes. The thing with shorting a stock, i.e. profiting from its decline, is that if you’re wrong, you can be wrong until your account is wiped out because shares could rise indefinitely.
GameStop short sellers were ironed out. They lost more than $2 billion in just two days, according to data analytics firm S3 Partners.
“After being down $862 million in mark-to-market losses yesterday, NYSE:GME shorts are down another $1.36 billion in mark-to-market losses today,” S3 Partners’ Managing Director Ihor Dusaniwsky commented on X .
If only there was some similar experience in recent history that would inform hedge funds:
Not to bet on a red-hot stock, popular among the retail crowds, because you’ll get burned if they come after you with a short squeeze.
Not to bet on a red-hot stock that’s thinly traded, because you won’t be able to easily get rid of your short position that’s draining your funds.
After all, they did make a movie ( “Dumb Money” ) about shorting GameStop. Yet, “smart money” did it again. Professional hedge funders weren’t the only ones to get knocked.
What Goes Up Must Come Down
The retail trading army on Reddit and X lost some serious cash, too. Just when shares were going in the other direction. Redditors on r/WallStreetBets initially cheered the first rays of the powerful upside swing. This sparked hopes of a revival before these same guys started flooding the board with screenshots of mounting losses as shares were nosediving.
What Happened and Why the Fast About-Face?
Other than the super frothy state of the highly inflated stock, what helped shares come back to earth was GameStop’s securities filing to sell some equity. Apparently, the C-suite of the video game store figured they could ride out the surge and issue up to 45 million shares that would dilute the number of existing shares by as much as 15%.
In another price-damaging filing , GameStop said that it expects net sales for the current quarter to land between $872 million and $892 million. The forecast is well below last year’s $1.237 billion and the consensus views for $1.045 billion.
With that said, GameStop shares are still in the green for the year, following the head-spinning trip to the moon and back. So, until next time?
We Want to Hear from You!
Let us know about your experience with that volatile beast! Do you own shares, when did you buy, and are you optimistic about the future of GameStop?

Is gold or silver the trade to make this week? This week's trade could be a decision between gold and silver.
The former might be swayed by the seven fed officials that are planned to speak this week, while the latter could be influenced by the #SilverSqueeze movement that is tangentially related to the meme stock frenzy that reignited last week.
Gold Technical
Gold (XAU/USD) prices rose at the end of the week but did not quite test the all-time high around $2,431.
Gold is trading well above the 20 Simple Moving Average (SMA), with the 100 and 200 SMAs maintaining bullish slopes much below it. Renewed buying pressure beyond $2,413 might push prices above the $2,420 mark.
Silver Technical
Silver (XAG/USD) is nearing the multi-year high at $31.40. A significant break at the end of the week saw Friday's sharp rise validate the break above the multi-year trendline. The challenge for the coming week is whether silver can maintain this bullish momentum despite entering overbought territory. The frenzy we saw in meme stocks might be dampening down too, with 2 days of declines following the surge. But it might be premature to count anything out yet.
The 14-period Relative Strength Index (RSI) is in the range of 70.00, possibly suggesting bullish momentum. The next resistance level is $31.50 from May 2011. In this fundamentally detached market, the next support could lie all the way back at where the metal was trading before the surge.

GME: Continues To Hold the Bullish 0.886 Position and 200-SMAThis is a little bit of an update and reminder that GME is still holding above the 0.886 retrace and the 200-month Simple Moving Average with Hidden Bullish Divergence within a Falling Wedge. We've held this level for months and it still appears that it can Bullishly Breakout of the wedge at any time, which should lead to some extreme upside between $60, all the way up to 134.77. But given how long it's been I'd say on a shorter term timeframe basis, just to be safe, $25 would be the first profit taking target.
It is also worth noting that on the monthly GME confirmed a Bullish Morning Star after the test of the 200-Month Moving Average.

priceaction analysiswait
wait
wait
📊Analysis by AhmadArz:
🔗"Uncover new opportunities in the world of cryptocurrencies with AhmadArz.
💡Join us on TradingView and expand your investment knowledge with our five years of experience in financial markets."
🚀Please boost and💬 comment to share your thoughts with us!

$7.44 & the $11 for AMC Quick levels & Angles show future possible targets.
Be careful its still a meme stock :)

Beyond Meat (NASDAQ:BYND) Stock Surged 20% on Memestocks Craze Beyond Meat (NASDAQ:BYND) stock is experiencing a rally on Tuesday, with investors hoping for a squeeze on the meat-alternative company's shares. With 25,356,827 shares shorted, that's roughly 40.97% of the company's float, NASDAQ:BYND has an outstanding short interest position of over 40% of the total float. This could be a sign that traders have added NASDAQ:BYND to their list of meme stocks to squeeze.
The recent interest in pumping up shorted stocks and the return of Roaring Kitty, who initiated the meme stock rally of 2021, are contributing to the rally. If 2024 can mimic 2021, it will be good news for meme traders as several meme stocks rise as they work to push shorts out of them. Today's movement could be a sign that these traders have added NASDAQ:BYND to their list of meme stocks to squeeze.
NASDAQ:BYND stock is experiencing heavy trading today, with more than 12 million shares being traded, above its daily average trading volume of about 3.7 million shares. NASDAQ:BYND stock is up 20.1% as of Tuesday morning and 17.5% since the start of the year.
Beyond Meat (BYND) has an outstanding short interest position on it of over 40% of the total float, which could be in harm's way if the meme rallies across the market continue. The company reported an 18% drop in sales and its 15th consecutive quarterly loss, both of which were worse than what Wall Street expected.

BB - Joining the #moon club? I like this with our without memesClean chart. Clear tapering and orange algo proven control - looking for green and yellow buying continuation to continue the breakout with controlled selling down yellow and magenta
Careful on this one especially because it's below $5, risky, and all meme stocks can pop at any time.
Happy Trading :)
- TraderDaddyOG

trend changeInteresting day. Roar Kitty's superpowers managed to break AMC's downward trend, creating a well-defined symmetrical triangle and taking us to levels of 6.44 USD during the session. However, the game is set, and this stock could return to levels of 38 USD
Just be careful
Squeezer $GMEwww.tradingview.com www.tradingview.com
NYSE:GME Squeezer aside It will take time, IF squeezer happens it can fast track this
Ill Update as we go
This could be a much larger Move.
If this is a 5 wave of one this means were in a 1 of 5 impulsive move up to Pre NASDAQ:TSLA split prices
I'm not saying anything
I just like the stock

Chinese Tesla Rival Zeekr Soars 35% On NYSE Debut, Hits $6.8B Shares of ZEEKR Intelligent Technology Holding Limited ( NYSE:ZK ), a global electric mobility technology brand of Chinese automaker Geely Automobile Holding, rose by nearly 35% on the New York Stock Exchange on Friday, following its initial public offering (IPO). The company offered 21 million American Depositary Shares (ADS) at $21 per share. ZEEKR's stock closed at $28.26, giving it a fully diluted valuation of $6.8 billion. This successful debut comes at a time when other US EV makers, such as Tesla and Rivian, have seen a decline in their stock prices.
Geely Holding's Chief Executive, Daniel Li, expressed optimism about ZEEKR's future prospects, stating that there are significant opportunities in the global new energy vehicle market and that ZEEKR is positioned as a premium electric mobility brand that supports Geely's electric transformation. Geely Holding also owns Volvo Cars and Lotus Cars.
ZEEKR ( NYSE:ZK ) began delivering vehicles in October 2021 and has delivered more than 240,000 vehicles to date. The company plans to expand its market to Europe, the Middle East, and other Asian markets. In 2023, the company reported a total revenue of 51.67 billion yuan ($7.15 billion), but also recorded a net loss of 8.26 billion yuan.
Overall, ZEEKR's successful debut on the New York Stock Exchange signals promising growth prospects for the company and highlights the growth potential of the global electric mobility market.

GMENYSE:GME
4 inside day candle/bull flag on the daily chart.
Current position: 20C 5/17/24 1.14
Small Position
.........................

DIS Testing Fundamental SupportWhen Americans feel depressed or unhappy about life, they tend to spend more money on fun things--something to consider during a presidential election year.
For now, NYSE:DIS is looking fine for its earnings report next week. It was over-speculated, so adjusting back down closer to fundamental support is normal. The gap up in February was on way better than expected earnings, so that level should hold up well.
However, HFTs and MEME groups have been going gaga over earnings and other news. If HFTs or MEMEs drive it down, it will move right back up due to Dark Pool activity first, and then pro trader activity.

AMC 's CEO says no to bankruptcy and so it pumps LONGAMC on the 60 minute chart shows an early reversal out of a three week downtrend after
two months of a wide ranging price action that was sideways. The more or less takes
bankruptcy considerations off the table. In the meanwhile, the streaming services continue
to beat down movie theaters. No matter, AMC has new bullish momentum and the trading
volumes to support it. The PVT indicator shows the new trend. The TTM Squeeze indicator
triggering has relevance. The trend is your friend especially if you befriend it early. You never
know, the short squeeze Ape Nation has been hoping maybe just maybe could happen. I will
take a long position of shares here and insure them partially with a put option to cover a wide
stop loss of 15% given the expected volatility. For the shares, targeting 3.85 with 35%, 5.50
with 25% and the remaining 50% to run with a trailing stop loss.

Ape's Guide to AMC: Charting the Rise of the Silverback StockJoin me as I break down the wild ride of AMC stock, "Ape’s Guide to AMC: Navigating the Stock Jungle". I’ll walk you through the massive swings from a high of $380 to the current low at $2, and discuss what could be coming next. From the big drop to the dramatic rise, and the steep fall we’re seeing now, I cover it all.
I'm also talking about the potential for a stock split in the future and why AMC might be setting up for a massive gain by 2030. Whether you're deep in the stock game or just thinking about jumping in, this video gives you the essentials on AMC’s potential.

🔥 FLOKI Insane Cup & Handle Pattern: Fibonacci Entry!FLOKI has seen incredible gains over the last few weeks, gaining over 800% in the last 2 months. However, I think that FLOKI is due to a minor correction. The correction is caused by both FLOKI being incredibly overbought, as well as the fact that it hit it's previous all-time high resistance area.
I'm aiming for a retest of the Fibonacci Golden Pocket area between the 0.382 and the 0.5 retracements, a 30-40 percent correction from here. It might sound like a lot, but if you look at the chart FLOKI has seen multiple weeks where it corrected over 30% in a single week.
Consequentially, this might pose a very good entry point for investors which have been waiting for a good entry.

🔥 WIF: Newest Memecoin Reversal SignalWIF is one of the newer memecoins on the market and is placed in an illustrous list together with the likes of PEPE, DOGE, SHIB, FLOKI etc.
As of earlier today, WIF has successfully confirmed the reversal from the bottom support of the parallel channel. This, together with an oversold RSI (for the first time since it hit Binance!) has convinced investors of a pending reversal.
Stop under the most recent swing low, target at the top resistance. You can potentially turn this trade into a long-term one if the price breaks through the top resistance.

For the AMC loversFor all AMC lovers; here is what you all have been waiting for, a reversal in the downward trend, first target $6.75, and from there a ladder of ups and downs, but always aiming to go higher, say goodbye to this price because you won't see it again for a while.

