Starbucks (SBUX) bullish scenario:The technical figure Triangle can be found in the US company Starbucks Corporation (SBUX) at daily chart. Starbucks Corporation is an American multinational chain of coffeehouses and roastery reserves headquartered in Seattle, Washington. It is the world's largest coffeehouse chain. As of November 2021, the company had 33,833 stores in 80 countries, 15,444 of which were located in the United States. Out of Starbucks' U.S.-based stores, over 8,900 are company-operated, while the remainder are licensed. The Triangle has broken through the resistance line on 21/05/2022, if the price holds above this level you can have a possible bullish price movement with a forecast for the next 4 days towards 79.10 USD. Your stop loss order according to experts should be placed at 70.36 USD if you decide to enter this position.
After 15 years in the country, Starbucks announced it was exiting Russia. Starbucks to close 130 stores in Russia, unionization push expands to over 260 U.S. stores. n addition, as a result of its exit from Russia, the fast food giant said it expected to record a charge of approximately $1.2 to 1.4 billion to write off its net investment in the market and recognize significant foreign currency translation losses.
Risk Disclosure: Trading Foreign Exchange (Forex) and Contracts of Difference (CFD's) carries a high level of risk. By registering and signing up, any client affirms their understanding of their own personal accountability for all transactions performed within their account and recognizes the risks associated with trading on such markets and on such sites. Furthermore, one understands that the company carries zero influence over transactions, markets, and trading signals, therefore, cannot be held liable nor guarantee any profits or losses.
Memestocks

$SHIB or $LUNA? Best gamble trade to be taking today. 🚨⚠️🚀💩A month ago this idea wouldn't have even been a thought in anyone's mind. However the recent super-crash of $LUNA has put it in the same risk-category as any sh** coin. IMO $SHIB will have some opportunities coming for anyone who would like to trade the retail hype. At the same time I personally believe that $LUNA has become somewhat of a "meme-coin" itself at this point, however more like a "meme-stock" with massive pump-potential. (Should things play out in the right way) Because of this, I have charted the performance of $SHIB vs. the performance of $LUNA. It seems that $SHIB will be somewhat battling against $LUNA for the immediate future, but will then be overtaken, with a possible massive rise in performance by $LUNA against $SHIB. This could also turn out to be a nice "double-play", as a trader COULD POSSIBLY use this ratio to make more $SHIB (if $SHIB stays lower while $LUNA rises) then sit in that $SHIB position until a take-profit level is hit by $SHIB.
**This is all my own personal opinion, based on chart data. Not Financial Advice**

Carrefour (CA.pa) bearish scenario:The technical figure Rising Wedge can be found in the French company Carrefour (CA.pa) at daily chart. Carrefour is a French multinational retail corporation headquartered in Massy, France. The eighth-largest retailer in the world by revenue, it operates a chain of hypermarkets, groceries stores, and convenience stores, which as of January 2021, comprises its 12,225 stores in over 30 countries. The Rising Wedge has broken through the support line on 21/05/2022, if the price holds below this level you can have a possible bearish price movement with a forecast for the next 17 days towards 17.880 EUR. Your stop loss order according to experts should be placed at 21.370 EUR if you decide to enter this position.
Europe's largest food retailer reported first-quarter sales that showed a lacklustre performance in its core French market, overshadowing more robust growth in Brazil.
The French retailer said it was confident about its 2022 outlook, confirming a key cash flow target for the year, but this was not enough to support the shares following a 26% rise so far this year. Cash is key to Carrefour's plans to step up digital commerce expansion without the extra financial resources that would have been on hand if two planned tie-ups last year had not failed - one with Canada's Couche-Tard and the other with France's Auchan.
Risk Disclosure: Trading Foreign Exchange (Forex) and Contracts of Difference (CFD's) carries a high level of risk. By registering and signing up, any client affirms their understanding of their own personal accountability for all transactions performed within their account and recognizes the risks associated with trading on such markets and on such sites. Furthermore, one understands that the company carries zero influence over transactions, markets, and trading signals, therefore, cannot be held liable nor guarantee any profits or losses.

Gamestop...Gone,stop.Just take your profits and come back another time...you hodlers aren't holding price where its at. If its going to move, it will with or without your positions.
Liquidity can always be engineered to create a short term short to your long...or create a short term long on a long term short. Know what I mean?
For some reason, common sense isn't a selectable category for the chart idea of, "take profit."

Bbig squeeze!!! Get readyBbig after pumping in demand zone which it does so well after creating a double bottom is now at our first resistance really impressed by how we held our gains today so if we break 3.46 it only makes sense that it’ll do what it usually does and to 4.08 then 5.30 and if we break those I’d be surprised if we don’t hit 7.50 #bullish #shortsqueeze

Airbus SE (AIR.pa) bullish scenario:The technical figure Triangle can be found in the French company Airbus SE (AIR.pa) at daily chart. Airbus SE is a European multinational aerospace corporation. Airbus designs, manufactures and sells civil and military aerospace products worldwide and manufactures aircraft in Europe and various countries outside Europe. The company has three divisions: Commercial Aircraft (Airbus S.A.S.), Defence and Space, and Helicopters, the third being the largest in its industry in terms of revenues and turbine helicopter deliveries. As of 2019, Airbus is the world's largest airliner manufacturer. The Triangle has broken through the resistance line on 06/05/2022, if the price holds above this level you can have a possible bullish price movement with a forecast for the next 17 days towards 117.08 EUR. Your stop loss order according to experts should be placed at 100.56 EUR if you decide to enter this position.
Shares in Airbus SA, +6.28% rose Thursday after the company posted first-quarter earnings above market expectations and said it would boost future production rates for its A320.
The European plane maker reported adjusted earnings before interest and taxes–a key profitability metric–of 1.26 billion euros ($1.34 billion) for the quarter, up from EUR694 million a year earlier. The figure beat analysts’ forecasts of EUR719 million. Net profit jumped to EUR1.22 billion, beating analysts’ views of EUR460 million.
Risk Disclosure: Trading Foreign Exchange (Forex) and Contracts of Difference (CFD's) carries a high level of risk. By registering and signing up, any client affirms their understanding of their own personal accountability for all transactions performed within their account and recognizes the risks associated with trading on such markets and on such sites. Furthermore, one understands that the company carries zero influence over transactions, markets, and trading signals, therefore, cannot be held liable nor guarantee any profits or losses.

Citigroup Inc. (C) bullish scenario:The technical figure Falling Wedge can be found in the US company Citigroup Inc. (C) at daily chart. Citigroup Inc. or Citi (stylized as citi) is a US-American multinational investment bank and financial services corporation. Citigroup is the third largest banking institution in the United States; alongside JPMorgan Chase, Bank of America, and Wells Fargo, it is one of the Big Four banking institutions of the United States. It is considered a systemically important bank by the Financial Stability Board and is commonly cited as being too big to fail. It is one of the nine global investment banks in the Bulge Bracket. The Falling Wedge has broken through the resistance line on 05/05/2022, if the price holds above this level you can have a possible bullish price movement with a forecast for the next 8 days towards 54.85 USD. Your stop loss order according to experts should be placed at 47.78 USD if you decide to enter this position.
Citibank, N.A. said today it has raised its base lending rate to 4.00% from 3.50%, effective tomorrow, Thursday, May 5, 2022.
Citi has announced the launch of Single Euro Payments Area (SEPA) Instant Payments in Europe, further increasing the bank’s global Instant Payments offering.
The launch will provide clients with the ability to pay to and receive from 36 SEPA countries instantly. The offering allows SEPA Credit Transfers to be made within seconds, 24/7 and funds available to recipients immediately. Payments can be made to and received from SEPA Instant participating banks located anywhere within the 36 country SEPA zone.
Risk Disclosure: Trading Foreign Exchange (Forex) and Contracts of Difference (CFD's) carries a high level of risk. By registering and signing up, any client affirms their understanding of their own personal accountability for all transactions performed within their account and recognizes the risks associated with trading on such markets and on such sites. Furthermore, one understands that the company carries zero influence over transactions, markets, and trading signals, therefore, cannot be held liable nor guarantee any profits or losses.

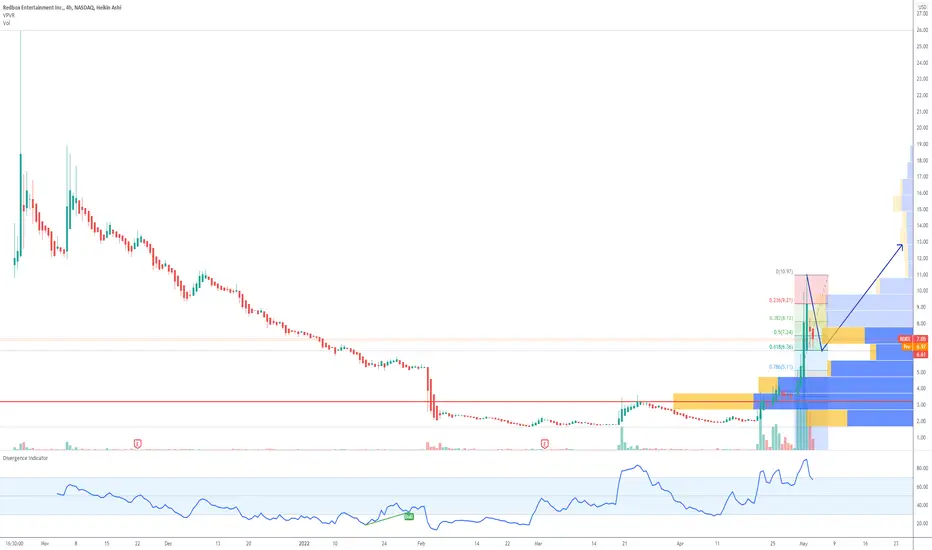
RDBX Redbox Entertainment the next GME GameStop ??I see the recent rally of RDBX, which is a self-service rent or purchase new-release DVDs and Blu-ray Discs, as a return to the meme stocks.
RDBX went from $2 to $11 in just 10 days.
If we consider only the technicals, then the stock should reverse from the Fibonacci 0.618 level, which is $6.36 to $12.70.
I`m not in this trade though, the valuation is too high for me, 300Mil. GME was way cheaper when the short squeeze started.
Looking forward to read your opinion about RDBX.
BMW (BMW.de) bullish scenario:The technical figure Triangle can be found in the German company Bayerische Motoren Werke AG (BMW.de) at daily chart. Bayerische Motoren Werke AG, commonly referred to as BMW, is a German multinational corporate manufacturer of luxury vehicles and motorcycles headquartered in Munich, Bavaria, Germany. Automobiles are marketed under the brands BMW, Mini and Rolls-Royce, and motorcycles are marketed under the brand BMW Motorrad. In 2017, BMW was the world's fourteenth-largest producer of motor vehicles, with 2,279,503 vehicles produced. The company has significant motorsport history, especially in touring cars, sports cars, and the Isle of Man TT. The Triangle has broken through the resistance line on 04/05/2022, if the price holds above this level you can have a possible bullish price movement with a forecast for the next 17 days towards 86.73 EUR. Your stop loss order according to experts should be placed at 74.36 EUR if you decide to enter this position.
BMW Group and Audi have suspended shipments of cars by rail from Germany to China, the biggest market for both carmakers, due to the Ukraine war. Most of the 846,237 vehicles BMW delivered to Chinese customers last year were produced at its joint venture factory in Shenyang, but between 150,000 and 200,000 were imported from Europe. Beginning in September, BMW began dispatching cars bound for western provinces by train, at a pace then set to reach 16,000 a year.
Risk Disclosure: Trading Foreign Exchange (Forex) and Contracts of Difference (CFD's) carries a high level of risk. By registering and signing up, any client affirms their understanding of their own personal accountability for all transactions performed within their account and recognizes the risks associated with trading on such markets and on such sites. Furthermore, one understands that the company carries zero influence over transactions, markets, and trading signals, therefore, cannot be held liable nor guarantee any profits or losses.

Novartis AG (NOVN.vx) bearish scenario:The technical figure Triangle can be found in the Swiss company Novartis International AG (NOVN.vx) at daily chart. Novartis International AG is a Swiss multinational pharmaceutical corporation based in Basel, Switzerland. It is one of the largest pharmaceutical companies in the world. Novartis manufactures the drugs clozapine (Clozaril), diclofenac (Voltaren; sold to GlaxoSmithKline in 2015 deal), carbamazepine (Tegretol), valsartan (Diovan), imatinib mesylate (Gleevec/Glivec), cyclosporine (Neoral/Sandimmune), letrozole (Femara), methylphenidate (Ritalin; production ceased 2020), terbinafine (Lamisil), deferasirox (Exjade), and others. The Triangle has broken through the support line on 03/05/2022, if the price holds below this level you can have a possible bearish price movement with a forecast for the next 12 days towards 80.160 CHF. Your stop loss order according to experts should be placed at 87.480 CHF if you decide to enter this position.
Novartis said earnings and sales rose in the first quarter of the year, boosted by its key drugs, including heart failure treatment Entresto. Net income was $2.2 billion, up from $1.8 billion in the same quarter the previous year, on sales that grew to $12.53 billion from $12.41 billion. Analysts expected sales of $12.62 billion.
Risk Disclosure: Trading Foreign Exchange (Forex) and Contracts of Difference (CFD's) carries a high level of risk. By registering and signing up, any client affirms their understanding of their own personal accountability for all transactions performed within their account and recognizes the risks associated with trading on such markets and on such sites. Furthermore, one understands that the company carries zero influence over transactions, markets, and trading signals, therefore, cannot be held liable nor guarantee any profits or losses.

AvH (ACKB.br) bullish scenario:The technical figure Triangle can be found in the Belgium company Ackermans & van Haaren (ACKB.br) at daily chart. Ackermans & van Haaren (often abbreviated as AvH) is a diversified group operating in four core sectors: Marine Engineering & Contracting (DEME, one of the largest dredging companies in the world - CFE, a construction group with headquarters in Belgium), Private Banking (Delen Private Bank, one of the largest independent private asset managers in Belgium, and asset manager JM Finn in the UK - Bank J. Van Breda & C°, niche bank for entrepreneurs and the liberal professions in Belgium), real estate and senior care (Leasinvest Real Estate, a listed real estate company - Extensa, a major land and real estate developer with a focus on Belgium and Luxembourg) and energy and resources (SIPEF, an agroindustrial group in tropical agriculture). The Triangle has broken through the resistance line on 30/04/2022, if the price holds above this level you can have a possible bullish price movement with a forecast for the next 23 days towards 174.70 EUR. Your stop loss order according to experts should be placed at 163.40 EUR if you decide to enter this position.
Ackermans & van Haaren realised a record result of 407 million euros over the full year 2021.
Excellent results of the companies across the whole AvH group support this impressive result, which also surpasses that of pre-COVID year 2019 (despite the substantial capital gains realised in that year).
A substantial increase (+17%) of the dividend to 2.75 euros per share is proposed to the general meeting of shareholders.
Risk Disclosure: Trading Foreign Exchange (Forex) and Contracts of Difference (CFD's) carries a high level of risk. By registering and signing up, any client affirms their understanding of their own personal accountability for all transactions performed within their account and recognizes the risks associated with trading on such markets and on such sites. Furthermore, one understands that the company carries zero influence over transactions, markets, and trading signals, therefore, cannot be held liable nor guarantee any profits or losses.

$SPX: 2000 top overlaid on price...I really think we likely saw a long term top in equities and a major turning point in the various trends that we had since 2009 until recently. I copied the pattern from the high in the year 2000, to give us an idea of what to expect, since that was the last time a yearly timeframe Time@Mode pattern concluded, I think it can serve as a guide from here onwards. Publishing this one for posterity, it's interesting that we already have a Dot Com bubble like chart in $ARKK monthly, definitely very critical to figure out if we already topped, as per the yearly, or if we get a different bear market pattern next. In my opinion, the massive excess we saw since 2020 post COVID, with increased retail participation is akin to the frenzy that started in the year 1998, and topped by 2000, which would fit today being equivalent to that period.
I will try to navigate this period profitably, my strategy is to have a long/short portfolio, buying interesting bullish setups in stocks with lower valuations, commodities related positions, and defensive names, all that have historically fared well during yearly trend expirations when bear markets and long term sideways consolidations started, like between 2000 and 2013, or before, during the 70s. I also short overvalued names where I perceive that the story driving them is exhausted, and are rolling over, with insane valuations and market participants complacent and buying option premium on the way down...while shorting options against my short positions. I manage risk carefully, and have split my portfolio in two: one trading account with 25% of my firepower, and 75% in a long term account where I have only long term long positions, no leverage, and try to sell calls to generate income while holding my long term bets.
Best of luck, let's hope we get further clarity over time. Fitting this scenario would result in a tricky period unfolding for months, but eventually we will get a really steady decline to trade more aggressively on the short side. Patience will reward us here, can't take big risks and expect to make money as a bear simply holding random bearish entries.
Cheers,
Ivan.

$AMC had a short lived Bullish run. What is next?NYSE:AMC
Chart - Daily
EMA (Exponential Moving Average): 20 EMA crossed the 50 EMA but couldn't hold for the next cross over 100 EMA. It is currently trending downwards towards the 50 EMA.
TTM squeeze: All momentum is puff, gone. Squeezing downwards :(
Fib levels: We now have a reversed fib and at .382 it's the beginning baaaaad news. It must fight off .618 or we headed down for the 1 fib ($13.77).
Candle stick: Three Black Crows followed by a Bearish Engulfing. This is baaaaaaaaaaaaaad!
Pattern: Falling Wedge or should I say Bearish Price Channel Continuation.
News: I really think it's just the volatile markets and the continued fed data about CPI, SPI, and War.
History: Well last start first by looking at the previous moves and analysis; We suggested the moves to $27.71 and $31.04 which were right on point. We even got a little extra. The current trends are the exact opposite of the previous analysis. We say this to say that the probability for $AMC to go back to $13.87 (1 fib reversal) is super high given the current market conditions. Especially with today's CPI data of 8.6% for the month of March. Maybe $HYMC could come to the rescue but they seem to be facing the same fate.

MEMUSDT Bullish OutlookKucoin Competition for MEM/USDT
Start a Gridbot for MEM/USDT
Special Offer for MEM Traders: Trade To Share 40,000 USDC! #MEM
💥3 Trading Activities
Ranking Rewards
🥇Top 1 1,500 USDC
🥈Top 2 1,300 USDC
🥉Top 3 1,200 USDC
Top 4-10 1,000 USDC each
Top 11-20 800 USDC each
Top 21-30 600 USDC each
👇Use the Website Link below to Sign Up to KUCOIN👇

Danone S.A (BN.pa) bullish scenario:The technical figure Triangle can be found in the French company Danone S.A (BN.pa) at daily chart. Danone S.A. is a multinational food-products corporation based in Paris and founded in Barcelona, Spain. It is listed on Euronext Paris where it is a component of the CAC 40 stock market index. Some of the company's products are branded Dannon in the United States. As of 2018, Danone sold products in 120 markets, and had sales in 2018 of €24.65 billion. In the first half of 2018, 29% of sales came from specialized nutritional preparations, 19% came from branded bottled water, and 52% came from dairy and plant-based products. The Triangle has broken through the resistance line on 08/04/2022, if the price holds above this level you can have a possible bullish price movement with a forecast for the next 10 days towards 53.75 EUR. Your stop-loss order according to experts should be placed at 49.47 EUR if you decide to enter this position.
French food group Danone said on Tuesday that "all options are on the table" regarding its business in Russia and that there was no decision at this stage to exit the country. This was after a source close to the matter said Danone was looking at possible ways of withdrawing from Russia, as the West prepared new sanctions on Moscow after dead civilians were found lining the streets of a Ukrainian town seized from Russian invaders.The company earned about 5% of its revenues in Russia in 2021 and less than 1% in Ukraine.
Risk Disclosure: Trading Foreign Exchange (Forex) and Contracts of Difference (CFD's) carries a high level of risk. By registering and signing up, any client affirms their understanding of their own personal accountability for all transactions performed within their account and recognizes the risks associated with trading on such markets and on such sites. Furthermore, one understands that the company carries zero influence over transactions, markets, and trading signals, therefore, cannot be held liable nor guarantee any profits or losses.

Novartis (NOVN.vx) bullish scenario:The technical figure Double Bottom can be found in the Swiss company Novartis International AG (NOVN.vx) at daily chart. Novartis International AG is a Swiss multinational pharmaceutical corporation. It is one of the largest pharmaceutical companies in the world. Novartis manufactures the drugs clozapine (Clozaril), diclofenac (Voltaren), carbamazepine (Tegretol), valsartan (Diovan), imatinib mesylate (Gleevec/Glivec), cyclosporine (Neoral/Sandimmune), letrozole (Femara), methylphenidate (Ritalin), terbinafine (Lamisil), deferasirox (Exjade), and others. The Double Bottom has broken through the resistance line on 07/04/2022, if the price holds above this level you can have a possible bullish price movement with a forecast for the next 29 days towards 86.88 CHF. Your stop-loss order according to experts should be placed at 72.50 CHF if you decide to enter this position.
Novartis CEO Vas Narasimhan is continuing his shake-up of the giant Swiss drugmaker, announcing a corporate restructuring on Monday that the company says will simplify its organizational chart and bring more than $1 billion in annual savings.
Novartis AG NVS announced that the FDA has approved its kinase inhibitor, Vijoice (alpelisib), for the treatment of patients aged two years and above with severe manifestations of PIK3CA-Related Overgrowth Spectrum (“PROS”), requiring systemic therapy. Per the company, following the nod, Vijoice became the first FDA-approved therapy to treat PROS, which includes rare conditions where overgrowths and blood vessel anomalies occur.
Risk Disclosure: Trading Foreign Exchange (Forex) and Contracts of Difference (CFD's) carries a high level of risk. By registering and signing up, any client affirms their understanding of their own personal accountability for all transactions performed within their account and recognizes the risks associated with trading on such markets and on such sites. Furthermore, one understands that the company carries zero influence over transactions, markets, and trading signals, therefore, cannot be held liable nor guarantee any profits or losses.

Triple bottom on BLNKTake a look at BLNK.
What a resistance we have at $26, yes this is a "meme stock" but we do like BLNK here technically.
We are looking for a break and hold of that $26 level and in the short term will be taking profits at $27, $28, $29, and $30.
From there we will see. Economic conditions will still not be great for tickers like this to perform well on a longer time frame, but we will play the short moves with the cards we are dealt

$AMC UPDATEMemestocks have once again been showing growth and signs of strength - taking a look at $AMC we can identify since price formed a double bottom at the daily demand zone there is now a potential breakout and bullish continuation coming on the 1D TF - are we going to see another short squeeze

Takeaway (TKWY) bullish scenario:The technical figure Triangle can be found in the Dutch company Just Eat Takeaway.com N.V. (TKWY.as) at daily chart. Just Eat Takeaway.com N.V. is a Dutch multinational online food ordering and delivery company based in Amsterdam, Netherlands. It is the parent company of brands including Takeaway.com, Just Eat, SkipTheDishes, Grubhub, and Menulog. Just Eat Takeaway operate various food ordering and delivery platforms, where customers can order food online from restaurants’ menus, and have it delivered by restaurant or company couriers directly to their home or workplace using an app or website. The Triangle has broken through the resistance line on 02/04/2022, if the price holds above this level you can have a possible bullish price movement with a forecast for the next 7 days towards 40.000 EUR. Your stop-loss order according to experts should be placed at 30.705 EUR if you decide to enter this position.
Just Eat Takeaway.com N.V. and McDonald's Corp have entered into a global strategic partnership to support the McDelivery business. The financial terms of the arrangement were not disclosed. Just Eat Takeaway.com's geographic coverage, food-delivery marketplace, and 500,000 couriers worldwide support its delivery partners, such as McDonald's. The partnership will elevate local partnerships between the parties, reducing complexity to innovate at scale and improve operational efficiency.
Risk Disclosure: Trading Foreign Exchange (Forex) and Contracts of Difference (CFD's) carries a high level of risk. By registering and signing up, any client affirms their understanding of their own personal accountability for all transactions performed within their account and recognizes the risks associated with trading on such markets and on such sites. Furthermore, one understands that the company carries zero influence over transactions, markets, and trading signals, therefore, cannot be held liable nor guarantee any profits or losses.

Shiba Inu: Double Bottom at PCZ of Bullish GartleyWe have tow bottoms at the .786 retrace PCZ of this Bullish Gartley with the addition of Bullish Divergence and if it plays out Shiba Inu could go absolutely insane as it has historically except this time there would be a tremendous technical argument as to why it does rather than it just being for the memes.

Moncler (MONC.mi) bearish scenario:The technical figure Pennant can be found in the Italian company Moncler (MONC.mi) at daily chart. Moncler is an Italian luxury fashion brand with French origin mostly known for its skiwear. The Pennant has broken through the support line on 02/04/2022, if the price holds below this level you can have a possible bearish price movement with a forecast for the next 6 days towards 46.860 EUR. Your stop loss order according to experts should be placed at 52.86 EUR if you decide to enter this position.
Moncler reported revenues that surpassed the 2-billion-euro mark, rising 44 percent compared with 1.4 billion euros in 2020, eight years after its initial public offering and through a global pandemic. Net profit climbed 37 percent to 411.4 million euros, compared with 300.4 million euros in 2020. Compared with 2019, it grew 14.7 percent from 358.7 million euros. The group also touted a free cash flow of 550.3 million euros, above pre-COVID-19 levels and compared to 195.5 million euros in 2020.
Risk Disclosure: Trading Foreign Exchange (Forex) and Contracts of Difference (CFD's) carries a high level of risk. By registering and signing up, any client affirms their understanding of their own personal accountability for all transactions performed within their account and recognizes the risks associated with trading on such markets and on such sites. Furthermore, one understands that the company carries zero influence over transactions, markets, and trading signals, therefore, cannot be held liable nor guarantee any profits or losses.

Gamestop weekly chart bullish or bearishLooking at Gamestop (GME) on the weekly charts I wanted to see where it is going in the long and short-term.
On the left side we see the massive rally in early 2021 hitting the all time high of $483 and pulling back to around $320.
Then in March and June we see to breakouts but failed attempts to take out new all time highs. You see the long upper wicks pulling back and holding support at $150
To the last couple weeks we also see the long upper wick and resistance at $200. The volume has also increased the last 2 weeks.
Price currently is overextended from the moving average so combined with the resistance and the bearish upper wick it does lean more to the bear side but $150 support needs to hold.
Although GME has gone on a bit of a breakout of late this weekly chart is leaning to more downside.
Three things I will be watching for are, one if the volume keeps increasing that is a great sign, two if $150 support holds and lastly I would need to see GME back above the strong $200 resistance for me to be confident in this for long term holds. For now I will play it short-term long and short.

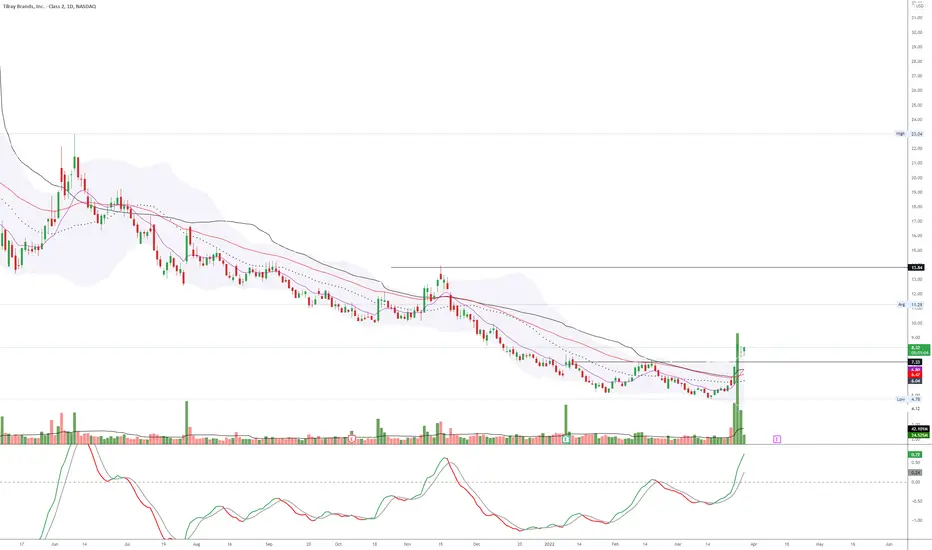
TLRY - LOL do you even read charts?Volume says it all. Only an idiot will consider shorting it here.