META: Bullish DivergenceMETA has sold off nearly 70% from its ALL TIME HIGH of $380. I'm looking at Bullish Divergence in the weekly RSI. If a base is starting to form around the $116-$126 range, we could see a higher low establish around this range. Likely a good price zone to Dollar Cost Average into a position. If a base establishes, this could be a range where you get some shares at VALUE LEVELS before momentum returns into the markets.
Warning: Stop-loss mandatory.
Meta

META Bubble StockMETA is also Toast along with TSLA and many other
Bubble stocks.
Next stop is $96.
Goodluck.

FB Meta Platforms earnings todayIf you haven`t shorted FB at $341:
Look at the comments as well.
Then you should know that even Google`s YouTube was threatened by TikTok rise!
On the other hand a recent leaked documents claim lost control of user data from Facebook.
FB is closer to our buy area of $140-155.
Looking forward to read your opinion about it.

META Potential for Bearish Momentum | 10th October 2022On H4, with the price moving below the ichimoku cloud and descending trendline, we have a bearish bias that the price may drop form the sell entry at 141.42, which is in line with the previous swing high to the take profit at 116. 40 , where the 78.6% fibonacci projection is. Alternatively, the price may rise to the stop loss at 153.6, where the 38.2% fibonacci retracement and pullback resistance are.
Any opinions, news, research, analyses, prices, other information, or links to third-party sites contained on this website are provided on an "as-is" basis, as general market commentary, and do not constitute investment advice. The market commentary has not been prepared in accordance with legal requirements designed to promote the independence of investment research, and it is therefore not subject to any prohibition on dealing ahead of dissemination. Although this commentary is not produced by an independent source, FXCM takes all sufficient steps to eliminate or prevent any conflicts of interest arising out of the production and dissemination of this communication. The employees of FXCM commit to acting in the clients' best interests and represent their views without misleading, deceiving, or otherwise impairing the clients' ability to make informed investment decisions. For more information about the FXCM's internal organizational and administrative arrangements for the prevention of conflicts, please refer to the Firms' Managing Conflicts Policy. Please ensure that you read and understand our Full Disclaimer and Liability provision concerning the foregoing Information, which can be accessed on the website.

META Potential for Bearish Momentum | 10th October 2022On H4, with the price moving below the ichimoku cloud and descending trendline, we have a bearish bias that the price may drop form the sell entry at 141.42, which is in line with the previous swing high to the take profit at 116.40, where the 78.6% fibonacci projection is. Alternatively, the price may rise to the stop loss at 153.6, where the 38.2% fibonacci retracement and pullback resistance are.
Any opinions, news, research, analyses, prices, other information, or links to third-party sites contained on this website are provided on an "as-is" basis, as general market commentary, and do not constitute investment advice. The market commentary has not been prepared in accordance with legal requirements designed to promote the independence of investment research, and it is therefore not subject to any prohibition on dealing ahead of dissemination. Although this commentary is not produced by an independent source, FXCM takes all sufficient steps to eliminate or prevent any conflicts of interest arising out of the production and dissemination of this communication. The employees of FXCM commit to acting in the clients' best interests and represent their views without misleading, deceiving, or otherwise impairing the clients' ability to make informed investment decisions. For more information about the FXCM's internal organizational and administrative arrangements for the prevention of conflicts, please refer to the Firms' Managing Conflicts Policy. Please ensure that you read and understand our Full Disclaimer and Liability provision concerning the foregoing Information, which can be accessed on the website.


MetaI still do not see any signs of technical changes, there is no increase in volumes on the BO and it has not corrected up to the major trend, but perhaps the impulse of the H&S is not yet finished and points to 122 before correcting completely
if I add a short it is with little and to close immediately at 122

$FB Zuckerberg Gut PunchFaceplace is really getting it in this bear market. After looking like it might finally rebound, we are seeing a clear indication of a bearish consolidation pattern which can be used to initiate short positions and limit risk. Even though this looks golden, I do not pretend to know what is going to happen, so I always cut losses when positions move against me.

META BEAR FLAG OTW. Bearish on $META below 137 until 123 unless break AND hold above 143. $VIX is also showing bullish context to comfirm this $META bear flag (failure to go lower) @ Weekly level 137. Would take majority of profit off the table at $128.71 because their may be a pullback to retest around 135.

Meta Will Fly not far from NOWMeta has been off everybody's radar, because FACEBOOK is Old School.
But once their new AI get's Launched it becomes a High Valuad Stock, for sure.

$META - FACEBOOK - FALLING WEDGE - CAPITULATION where to next?Still on track.
This chart has been the most requested in DMs for updates.
I believe META will continue its growth in the future as the METAVERSE expands and come out as a front runner in 2023.
For now we can see the declining selling volume.
Clear as day capitulation marked on the charts.
We will have it rough on the markets until the end of the year, I view this as huge OPPERTUNITY. NO FEAR!
$Meta will reduce its workforce for the first time since 2004 and it slashed the budget for its team salary.
Expanding their data center in UTAH.
Switched up their marketplace (more profits from ads from car dealers).
You can share NFTs on Facebook & Insta.
New android Chromium-web view.
New tools for creators.
I did SLIGHTLY (like barley) pivot the lower trend on the falling wedge - with more data printing daily it was necessary and now the line has been tapped multiple times for confidence.
Meta will be one of the top stocks ill be accumulating in my portfolio on the dips. This will be a long term hold for me, I will use options for day and swing trades.
If you do choose options please keep in mind to buy extended time (although more pricey) this chop is algorithmically created to burn Theta out of contracts.
(Full disclosure) If we do get a OCTOBER pump, not going to lie, I will probably sell out and buy the dip continuously afterwards.
NOBODY can predict every top and bottom, this is why the DCA (Dollar Cross Averaging) Method is widely used to ride the waves.
GOODLUCK traders!

META Meta Platforms at Covid Lockdown levelI don`t know if you remember our Buy area here:
Now META Platforms reached our buy area and it`s ready for a technical rebound from the oversold level!
My price target is $154.
Looking forward to read your opinion about it.

Several market reviews9. 30. 22 META Is a great example of how the strategy of buying and holding can be very expensive. If I were trading support, I would be long is this stock because it's oversold. On the other hand, it's a market that is giving back 70% of its games from 2013.And the devaluation the dollar is far more then 20% since 2013. This is a simplistic evaluation ignoring splits and dividends e t c. Tesla it's a much stronger stock, even though it's held up it's price very well considering the recent markets, it has made lower lows and lower highs and it is still close to the high. This kind of a pattern we concern me, and I would be very cautious about buying and holding in this market, and I would look for the market to trade lower if we are indeed entering into a depression. Natural Gas futures have corrected 38% to a support area which is a good bubble to go long if you find buyers. But the price is coiling...Which suggests to me that it is not clear for both the buyers and the sellers until the market starts to expand a little bit. In this case it's much better the sit tight market to give you a clue... this means that it has to expand, and this means that the market might make a couple of counter directional news before there is clarity. We will look for it as it happens....will talk about it when something happens. Meta Tstla Natural Gas

Meta Platforms' Facebook Due for Likely 200% RiseBased on the my all time perception of Facebook's price pattern, I believe the Social Media giant will see a timely 200% swing over the next 16-24 months. This observation/idea is based solely on Elliott Wave Theory. For more profitable ideas and trade discussions, let's discuss it in the Digital Surf Trading Community.

META (1W) - Short term Correction UPwards. Wave B coming ? Heloo Traders and all kinds of Speculators :),
Today i got interested into META ( Facebook) which lost around 65% from its ATH. You can see that chart forms something similar to Falling wedge or Ending diagonal within wave (v) of A.
If so, we could reach a support ideally at 125usd. (or range between 130-110usd).
From where corrective wave UP could begin. With possibility to gain +50 to +75%. Sell zone is between 190-230 USD.
For such move the entire market should enter another bear market rally and a lot of Positive news (Temporarily).
At price around 125USD ... the P/E Ratio will be 10,5 which is very tempting for company like Facebook.
Consider your Risk : Reward ratio. Hopefully no Long-term investor will take this chart too serious for some significant position. (It could be but i think another wave C will come)...
Take care and trade safe. ;)

META Buy signal within the Falling Wedge.The Meta Platforms (META) have been trading within a Falling Wedge pattern since the April 05 High. After that we've had two Lower Lows and two Lower Highs. On Tuesday the stock came to its closest to the Lower Lows trend-line since June 23. As the 1D RSI breached the 30.000 oversold barrier, we have a strong short-term buy signal in our hands, targeting the 1D MA50 (blue trend-line) and the top of the Falling Wedge.
* A break above the 1D MA100 (green trend-line), which has been untouched since December 30 2021, can extend the uptrend on the medium-term towards the 1D MA200 (orange trend-line).
* A break above the 1D MA200, which has been untouched since January 06 2022, can be enough to restore the bullish trend on the long-term.
* A break below the Falling Wedge, can accelerate the selling targeting the 1.5 Fibonacci extension.
-------------------------------------------------------------------------------
** Please LIKE 👍, SUBSCRIBE ✅, SHARE 🙌 and COMMENT ✍ if you enjoy this idea! Also share your ideas and charts in the comments section below! This is best way to keep it relevant, support me, keep the content here free and allow the idea to reach as many people as possible. **
-------------------------------------------------------------------------------
You may also TELL ME 🙋♀️🙋♂️ in the comments section which symbol you want me to analyze next and on which time-frame. The one with the most posts will be published tomorrow! 👏🎁
-------------------------------------------------------------------------------
👇 👇 👇 👇 👇 👇
💸💸💸💸💸💸
👇 👇 👇 👇 👇 👇

META EASY SCALPING IDEA $$$META has been in a constant downward wedge for the past 5 days, as you can see. It has been following the wedge precisely and is near maturity. I've included take profit signals for quick and easy profits, However, a stop loss of 1-2 $ below the wedge should be added in case it breaks apart.

META Growth is Building Global Expansion and Adoption.META is down 64.50% from it's All Time Highs and reaching an area where we like the potential for some basing price action. We could get a spike well into our Target areas of 142.32 with some profit taking and another chance of potentially retracing to our 139.11 for developing into the counter trend Day 1 reversal and confirmation.
At our Firm, we've adopted the metaverse and virtual world with complements into our AI framework. Another to watch with META is RBLX.
I've been watching SPX and SPY (charts below) and have been nibbling on Semiconductor stocks. There is going to be upward 'back-filling' in that direction.

EUR/USD 26th of SeptemberThere is one rule in trading: follow the trend. On this trade, the bearish trend was followed and the T.P. was smashed

META FACEBOOKHELLO GUYS THIS MY IDEA 💡ABOUT META is nice to see strong volume area....
Where is lot of contract accumulated..
I thing that the buyers from this area will be defend this long position..
and when the price come back to this area, strong buyers will be push up the market again..
UPTREND + Support from the past + Strong volume area is my mainly reason for this long trade..
IF you like my work please like share and follow thanks
TURTLE TRADER 🐢

metameta: at the bullish harmonic retracement area, the levels expected to rise are indicated on the chart... with the importance of not breaking the retracement area by closing

Strong buy meta 4hr, weekly macdh divMeta looking to trim costs by 10% hugely oversold. 4hr macdh divergence. Weekly Macdh divergence. I'm in at 144.3. More to follow. Huge buying opportunity

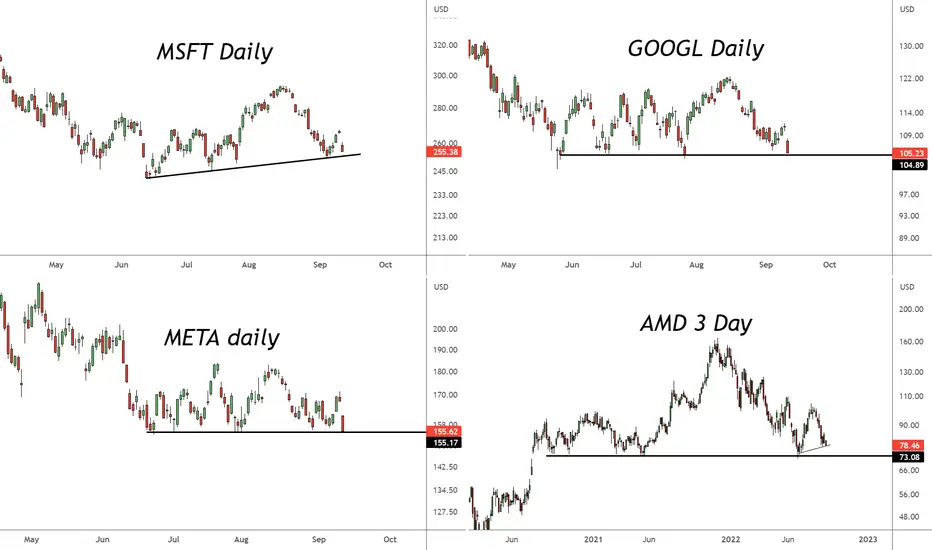
Big Tech - Head & Shoulder Pattern Galore These four big tech stocks are on thin ice.
A break of these necklines suggests more downside. These levels likely indicate around 11,900 on the Nasdaq as the line in the sand.
Question is, does this lead to capitulation or a longer duration downtrend. TBD...
Nasdaq 11,900 level = red line