META short if market is weakMarket is extended in the short term, if market is indeed weak this coming week, META can breakdown below 154.
AUG 5 152.5P can work
Meta

Swing Idea: METAWatching bounce off support here, looks like there’s also a unfilled gap from $175-$179
TP1: $170
TP2: $175
TP3: $179 (Free runners beyond this point)

Meta Platforms (Road Map)!!!🗺️Today, I want to analyze the Meta Platforms.
What are Meta Platforms ❓
Meta Platforms, Inc., doing business as Meta and formerly named Facebook, Inc., and TheFacebook, Inc., is an American multinational technology conglomerate based in Menlo Park, California. The company owns Facebook, Instagram, and WhatsApp, among other products and services.
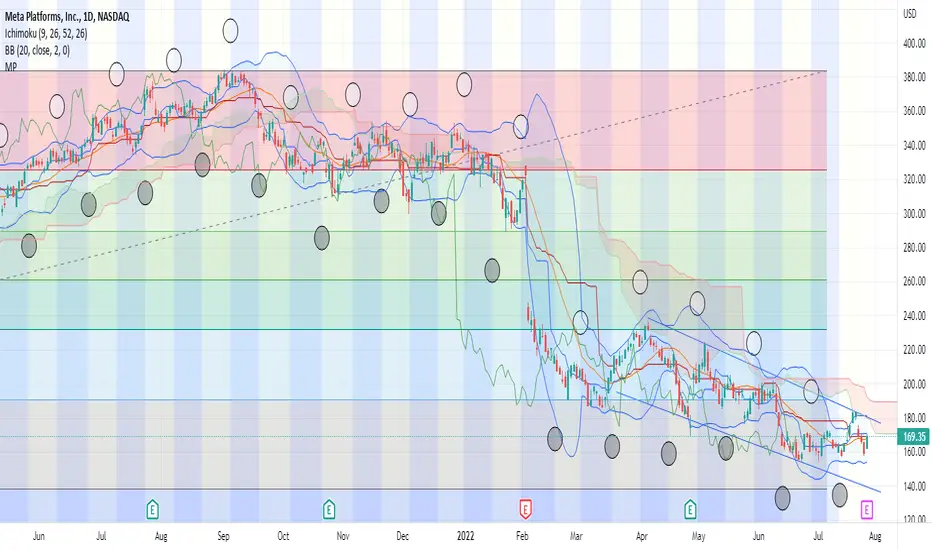
Meta Platforms are close to the end of main wave A.
I expect Meta Platforms to grow up around the support zone (for the short term).
Meta Platforms Analyze Daily Timeframe (Log Scale /Heikin Ashi)⏰
🟢Support zone🟢: 149$ until 137$
Do not forget to put Stop loss for your positions (For every position you want to open).
Please follow your strategy, this is just my idea, and I will be glad to see your ideas in this post.
Please do not forget the ✅' like '✅ button 🙏😊 & Share it with your friends; thanks, and Trade safe.


META SELL++Lets see if they come out with BS numbers again where META claims half the worlds population is a daily active user lol. META/ FB could see under $130's soon it's in a strong downtrend, fading business, advertisers pulling back, competition etc. Bought 1/3 position August 26th $160 puts.
$SNAPCan be opened on the current with a stop of 10 cents, under the $FB report
After midnight it turns into a pumpkin.
Target - 22-25
SL 9.3

Meta at this price or belowIMO is cheap but consciousness as a collective has had enough with social media and the constant bombardment of videos and advertising along with the cov and money being stolen from regular people because they are being taken advantage of because they aren't awake, I see now why Mr. Buffet wants real assets and not technology. Namaste, IMO at this point in time I wouldnt even bother with technology stocks. real businesses with real assets/realestate is where i am going and Silver.

META Short towards $120Not a pretty picture for FB/META, unless a much better than expected Financial report? I'm looking at downtrend towards $120, then looking at $165 resistance level . META has a long way to go to uptrend?

META: Bounce IntradayLooking for push down on opening to the 170 zone. Then looking for rejection from that zone on 5min or 15min. . . same as Carnival trade day trade that can turn swing.

Nice 3 day move in QQQsQQQs have had a nice 3 day move clearing its downtrend line. If it consolidates here for a few sessions and holds $300 area, will then look for it to then move towards next target area of $315. Next week will be crucial with big tech earnings (AAPL, GOOGL, META, AMZN etc.) along with the Fed

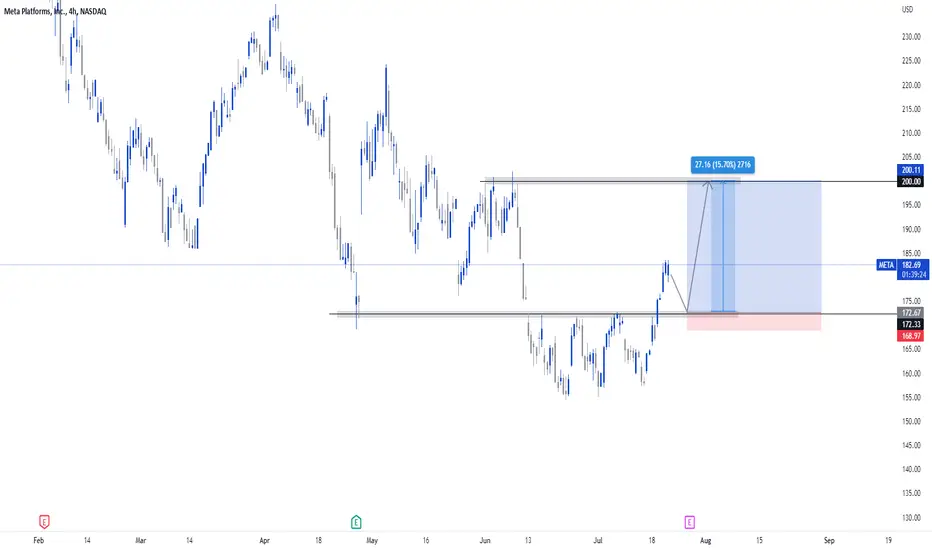
How to buy meta (Facebook) Hi Traders,
Meta also known as Facebook presents us with a Buy opportunity on the four hour timeframe. Looking at this price action we can see that price has created a channel ranging between 172 and 155, Price as strongly broken out of this channel and I now wait for a pullback.
I am waiting for price to pull back into 172.5 before sparking my interest in a buy position. Once we get the pullback I will be waiting for price to provide a rejection and show signs of buying pressure before entering.
My Target is at $200 per share as this is a point of previous resistance and a psychological price point.
I will be looing out for price to reject $189 as this could be a point where we get some sort of Rejection.
Be safe and be patient.
Renaldo Philander
META (Facebook) FORECASTPrice failed to break Resistance at 382$
Hence, price formed a Lower Low and Lower High
Expected to bottom out to the next SUPPORT
My POV's still on bearish trend for a long period of time

SPY GO DOWN, SPY GO DOWNYeah, I think SPY will go as low as 314.67. No need for BTD until end of year or 2023.
In the current range I see far more downside than upside, it go down!

META: Higher low is a good signal!Meta
Short Term - We look to Buy at 164.56 (stop at 150.26)
Although the bears are in control, the stalling negative momentum indicates a turnaround is possible. There is scope for mild selling at the open but losses should be limited. Prices expected to stall near trend line support. Further upside is expected although we prefer to set longs at our bespoke support levels at 160.00, resulting in improved risk/reward.
Our profit targets will be 200.00 and 210.00
Resistance: 200.00 / 220.00 / 250.00
Support: 160.00 / 140.00 / 120.00
Please be advised that the information presented on TradingView is provided to Vantage (‘Vantage Global Limited’, ‘we’) by a third-party provider (‘Signal Centre’). Please be reminded that you are solely responsible for the trading decisions on your account. There is a very high degree of risk involved in trading. Any information and/or content is intended entirely for research, educational and informational purposes only and does not constitute investment or consultation advice or investment strategy. The information is not tailored to the investment needs of any specific person and therefore does not involve a consideration of any of the investment objectives, financial situation or needs of any viewer that may receive it. Kindly also note that past performance is not a reliable indicator of future results. Actual results may differ materially from those anticipated in forward-looking or past performance statements. We assume no liability as to the accuracy or completeness of any of the information and/or content provided herein and the Company cannot be held responsible for any omission, mistake nor for any loss or damage including without limitation to any loss of profit which may arise from reliance on any information supplied by Signal Centre.

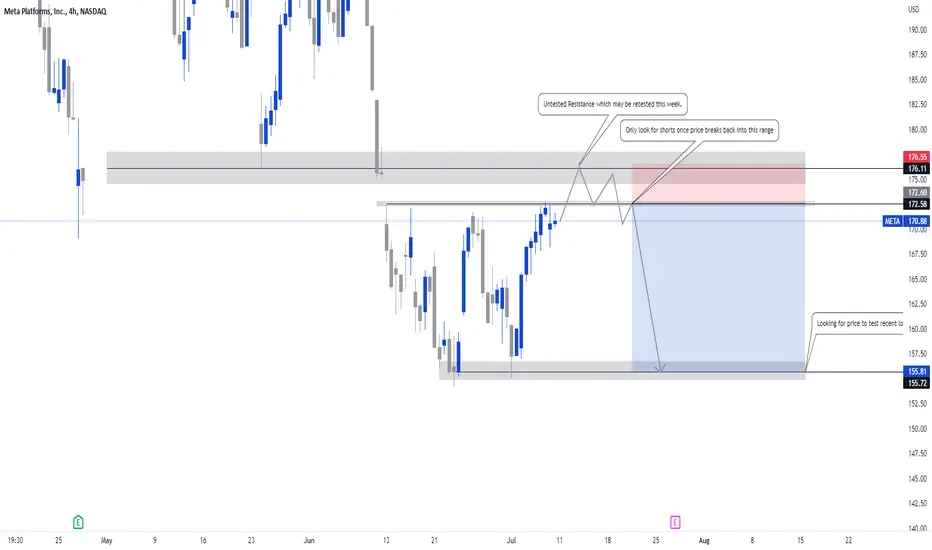
Facebook (Meta) False Breakout SetupHi Traders,
New week new opportunities. I am currently looking at Facebook (Meta) for a False Breakout Setup. The most recent price action shows that price has created a resistance at 172.58 which has multiple attempts to break, I do believe that price will break the current resistance and meet with the real untested resistance at 176.0.
If this does happen I will then start looking at trading opportunities. Now I don’t really care what happens when price breaks the resistance or how the price may move, All I care about is price break back into the range below 172.58. If this does happen I will be more than happy to start looking at shorts.
Looking at higher time frames, This is a simple lower high we need formed for the continuation. I am long term bearish on most Nas100 stocks and I will be looking at the longer term picture or potential shorts to come.
Let smash this week.
Renaldo Philander
$META CALLS Looking to load up on some calls here as soon as we approach the gap fil then we will be ready to go for a scalp and after that I am expecting a big move back down to make new lows

META Bearish Bias! Sell!
Hello,Traders!
META is trading below a horizontal resistance
And the stock is also in the downtrend
Which makes me bearish biased
And I think that after the retest of the resistance
We will see a move down
Sell!
Like, comment and subscribe to boost your trading!
See other ideas below too!

Tech Reversal In Play: Allow Price Action To PlayoutThe market complexion has changed greatly from "there is no chance of a recession" to "well, maybe there could be a recession" as the economic data continues to deteriorate. Continuing Jobless Claims in the United States increased to 1.375M in the week ending June 25 of 2022 from 1.324M in the previous week. The number of Americans filing new claims for unemployment benefits rose by 4K to 235K in the week that ended July 2nd, compared to market expectations of 230K, suggesting labor market conditions could be moderating.
But, I think it is just getting started as many companies are laying off and cancelling employment offers. These activities take time to get into the system and "The Counting Rule" is... they must be actively looking in-order to be counted. So, don't hold your breadth. And keep in mind the Fed will remain hiking rates, while the ECB will eventually need to jump on this wagon.
Speaking of the ECB.
The United States is acting as-if The Federal Reserve Raising Interest Rates solves everything. Government Debt in the United States increased to 30,499,619 Trillion in May from 30,374,155 Trillion in April of 2022.
The US Debt to GDP increased to 137% from 128%. They act as-if there is nothing for the public to worry about; however, many issues have not begun to trickle into the US, as far as we're concerned.
🥶Winter is going to be a huge test for the US and so will the household debt crisis -- not yet discussed in media as companies are trying to figure out how to keep consumers spending (e.g. buy now; pay later).
But, raising rates does not stop the government from spending, nor does it stop the government from issuing more debt. We also have other factors in play such as the Federal Reserve Balance Sheet, M2 Money Supply, and WH Executive Orders at play here.
HOWEVER.... The point of this post is the "very tight" interconnection between the US and UK.
Remember it is a global market and just like the global market crash of 1929 we are more connected today than ever before.
👉 The US and UK are at EXTREME levels of government debt and both facing economic collapse scenarios.
😳 If the UK goes down - don't think for a minute that the US cannot go along with it. You have seen my recent post about the US Liquidity Swaps, right? If not, scroll down the news feed and you'll see it.
Nevertheless, through my external analysis of the markets (with annotated charts) there remains a very-strong conviction that the recent lows of the financial markets will be tested and broken. This also takes into account the Federal Reserve Balance Sheet and the fact the Government Debt continues to expand against the GDP.
Downside targets for the SPX and NDX
NDX = T1 9,538; T2 8,200 (current price is at 12,109.05)
SPX T1 3,040; T2 = 2,750 (current price is at 3,902)
I GET IT... Many will not be supportive of the above, nor have many been on my Public Posts within TradingView; however, the same people bashing never seem to return when the outcomes play out. I am not here to say, "see, I told you so" or anything of that nature - as I'm providing my thesis into all the posts I provide with thorough assessments into the global markets and not based on raw emotions.
I really hope this post (and others) have been informative, helpful, or at least worthy enough for your review. I "value your time" and am humbled that you took the time to read, comment, etc. on any of my posts.
Thank you again.
Bill Davis - Technical Trader

META resistance another tryThe $172 resistance on META is strong and tough to break. Stock tried 5 times and got rejected today again. Keeping an eye on this one. Trend is still bearish, and we need more volume and accumulation to go up but the run in last last couple of days was wonderful. Waiting for retest and will add more to my LT.

$META Build or Break? 7/4Keep it simple, I will be back with more updates from now on. Meta is currently sitting at its channel support looking for either another touch of support. My bet is we head up to fill this gap. I will keep yall updated on the moves throughout the week.

✅META NEXT MOVE|SHORT🔥
✅META is going down currently
As the pair broke the key structure level
Which is now a resistance, and after the pullback
And retest, I think the price will go further down
SHORT🔥
✅Like and subscribe to never miss a new idea!✅

$META FACEBOOK Meta Technology Falling Wedge Descending Channel$META FACEBOOK Meta Technology Company
Falling Wedge Pattern - Descending Channel - Double Bottom at support with a bullish harami on the 4 hour candle.
$META is looking bullish from here on a technical view for a bounce off the bottom trendline. If it breaks out and holds above the channel it has a measured move of $234 target.
GAPS are marked in RED.
Word on the streets says Mark Zucker is not hiring much and has been bringing the heat in on his current employees hoping to weed out the weakest links. Meta has had some failed crypto related launches and has thick competition in the social media world. Better management and highly talented individuals is exactly what the company will need in order to be first class in the metaverse and live up to the name.

METAIdeal set of trendline support here. If it were to break we'd be visiting another 50% haircut where a bottom may be found around 88-90$ on the stock. Brutal to think about but it is possible.
If it bounces here we could likely see 190-220 as major resistance on the upside.
Overall bearish but remember this and NFLX got destroyed before any other tech tickers so may be ahead.
