XAUUSD Structural Analysis & Confluence - 16 July 2025 4-Hour Bias & Structural Context
Gold has recently broken above a key structure level at $3,320, confirming a bullish market environment on the 4‑hour timeframe. This follows a Change of Character (CHOCH) around $3,300, signifying a shift from consolidation to an upward trend. The swing from the late-June low ($3,244) to mid-July’s high ($3,374) sets our Fibonacci context:
38.2% retrace ≈ $3,318
50% retrace ≈ $3,309
61.8% retrace ≈ $3,300
These fib levels also align with prior structure and key ICT/SMC zones, signaling strong areas of interest.
🧭 Key 4-Hour Confluence Zones
Demand / Order Block → $3,300 – 3,305
Multi-method support: BOS, CHOCH, 50–61.8% fib convergence.
Fair Value Gap (FVG) → $3,320 – 3,325
Volume deficient zone post-BOS, primed for a retest.
Supply / Resistance Area → $3,360 – 3,370
High-timeframe supply, likely to cap further upside.
🧠 Smart Money Concepts
BOS above $3,320 confirms bullish structure.
CHOCH at ~$3,300 marks structure flip.
Liquidity grab zones found between $3,335–3,340, validating the presence of institutional activity.
Order Block at $3,300–3,305 supports buy-side interest.
📊 1-Hour Intraday Trade Setups
🔸 Setup #1 – FVG Re-Test
Entry: At ~$3,325 on pullback into $3,320–3,325 zone
SL: Below $3,320
TP1: $3,345, TP2: $3,360
🔸 Setup #2 – Demand OB Bounce (“Golden Setup”)
Entry: In the $3,300–3,305 range
SL: Below $3,298
TP1: $3,325, TP2: $3,345, TP3: $3,360
Edge: Tight risk, high confluence (SMC + fib + structure)
🌟 The Golden Setup
Zone to Watch: $3,300–3,305
Why It Rates Highest:
BOS, CHOCH, fib, and OB all align
Offers tight stop placement and strong upside
Risk-to-reward ~1:3
📌 Daily Watchlist Summary
Directional Bias: Bullish (BOS above $3,320 intact)
Primary Entry Zones:
$3,300–3,305 (Demand OB + structure)
$3,320–3,325 (FVG retest for continuation)
Key Target Zones:
$3,345–3,350 – realistic intraday exit
$3,360–3,370 – major supply cap
Invalidation Level: 4‑hour candle close below $3,298 negates bullish outlook
Final Commentary
Stay disciplined—only trade reactive signals at these levels: clean bounces, pinbars, or bullish engulfing patterns. The $3,300–3,305 zone stands out as the prime ‘Golden Setup’ entry.
Metals
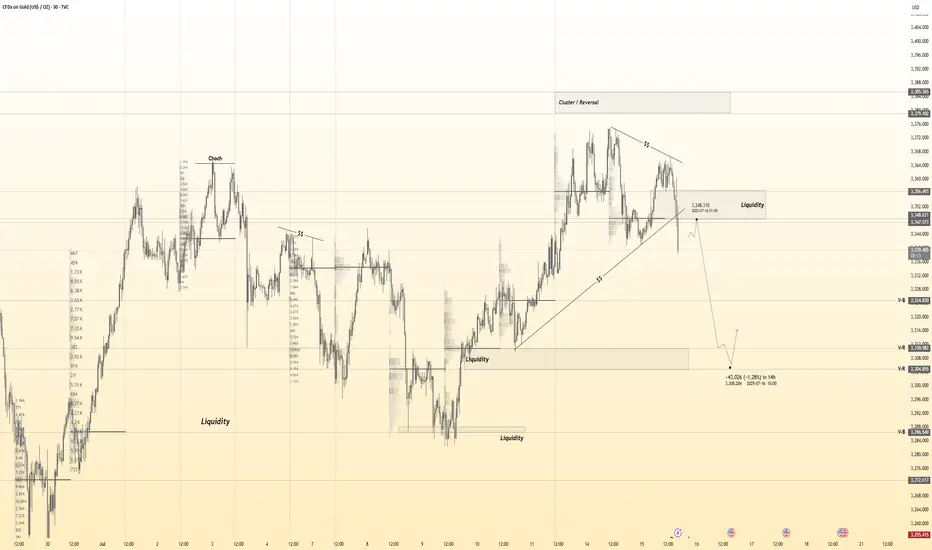
SPY/QQQ Plan Your Trade Special Update : BUCKLE UPThis video is a special update for all TradingView members. I felt I needed to share this information and present the case that I believe poses the most significant risk to your financial future - and it's happening right now.
Several weeks ago, I identified a very unique mirror setup in the SPY and kept an eye on how it was playing out. I needed to see confirmation of this setup before I could say it had any real likelihood of playing out as I expected.
As of today, I'm suggesting that we now have excellent confirmation that the US/Global markets are about to enter a deep consolidation phase, lasting through the rest of 2025 and possibly into 2026 and early 2027.
The interesting thing about this price pattern/structure is that it is almost exactly the same as the 2003-2007 structure, which I believe is the origin of this mirror setup. Almost down to the exact type of price bars/patterns I'm seeing.
Many of you are already aware that I've been calling for a critical low cycle in the SPY on July 18 for many months. What you may not realize is that the pattern is based on Weekly price data. The July 18 cycle low can have a span of +/- 1-3 weeks related to when and how the cycle low pattern plays out.
Watch this video. If you have any questions, message me or comment.
I'm still here, doing my best to identify and unlock the secrets of price action and to help as many traders as I can.
Price is the Ultimate Indicator.
Get some.
#trading #research #investing #tradingalgos #tradingsignals #cycles #fibonacci #elliotwave #modelingsystems #stocks #bitcoin #btcusd #cryptos #spy #gold #nq #investing #trading #spytrading #spymarket #tradingmarket #stockmarket #silver

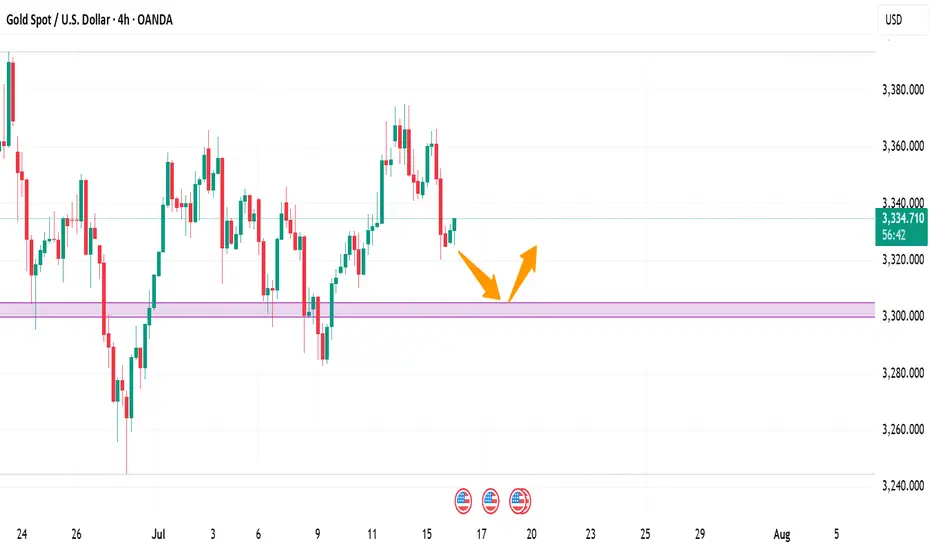
CPI triggers sell-off, 3330 can be short-term long📰 News information:
1. Focus on tomorrow's CPI data
2. Bowman's speech at the Federal Reserve
3. Tariff information outflows and countries' responses to tariff issues
📈 Technical Analysis:
The short-term trend flag pattern has been formed, and our short-selling strategy perfectly hits the TP. According to current news, Trump has once again urged the Federal Reserve to cut interest rates. While there is almost no possibility of a rate cut this month, there is a high probability that a 25 basis point rate cut will be completed in September, which is also in line with our previous prediction of market trends.
The big negative line in 4H pierced the middle Bollinger band. Although the CPI data is bullish, it has little impact based on the announced value. Market expectations have been digested in advance, so there is no room for a big drop. The upper points still focus on the short-term resistance of 3355-3365. If it rebounds to this area first in the short term, you can consider shorting again. Focus on the strong support of 3330 below. As long as the retracement entity does not fall below 3330, gold will rise again and touch the resistance line of 3375-3385.
🎯 Trading Points:
BUY 3335-3325
TP 3355-3365
In addition to investment, life also includes poetry, distant places, and Allen. Facing the market is actually facing yourself, correcting your shortcomings, facing your mistakes, and exercising strict self-discipline. I share free trading strategies and analysis ideas every day for reference by brothers. I hope my analysis can help you.
OANDA:XAUUSD PEPPERSTONE:XAUUSD FOREXCOM:XAUUSD FX:XAUUSD TVC:GOLD FXOPEN:XAUUSD
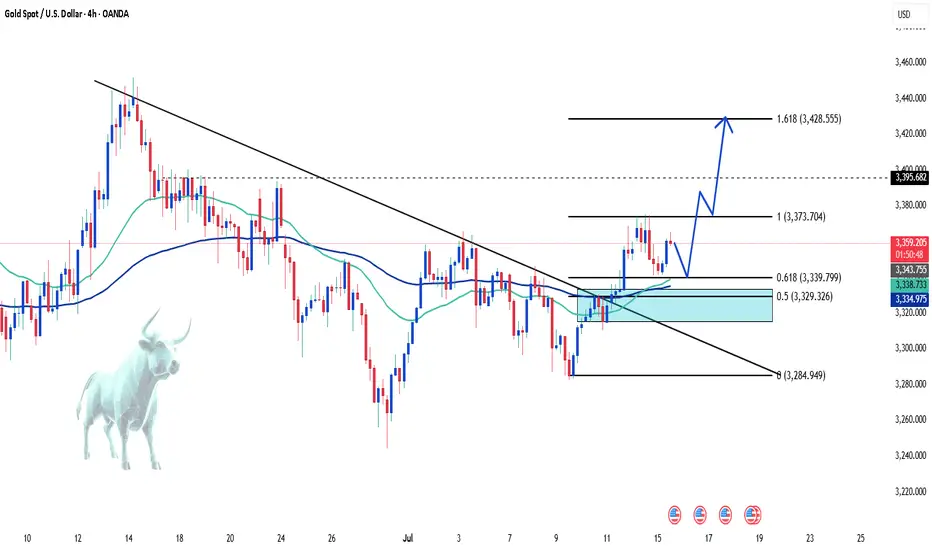
XAU/USD: Technical and News Signals Align for a Bullish Move💬 "When technicals and news align, traders can't ignore it."
Gold (XAU/USD) is at a critical juncture where both technical analysis and macroeconomic news are showing clear bullish signals. If you're waiting for a breakout, this might be the moment!
📊 Key Technical Analysis:
Gold bounced from a strong support zone at 3,339 – 3,329 (Fibo 0.618 & 0.5), confirming buying pressure.
EMA 34 crosses above EMA 89, signaling a potential trend reversal.
Breakout from the downtrend line opens up a target of 3,428 (Fibo extension 1.618).
Nearest resistance: 3,395 – if broken, a strong rally is likely.
🌐 Macroeconomic News Supporting the Bullish Trend:
The Fed may cut rates earlier than expected – USD weakens, benefiting gold.
Geopolitical tensions and financial instability in Europe increase demand for safe-haven assets.
US inflation cooling – market anticipates looser monetary policy.
Personal View:
If price breaks 3,395 with strong volume → long position, targeting 3,4xx.
Be cautious around resistance zones – short-term profit-taking could occur.
What do you think?
👉 Leave a comment, share your perspective or strategy – let’s ride the market wave together!
Gold is Setting up for another moveLooking for price to make some impulsive moves before we get active. Looking like they are trying to establish a low for the week before they go full on bullish. waiting for them to find that bottom.

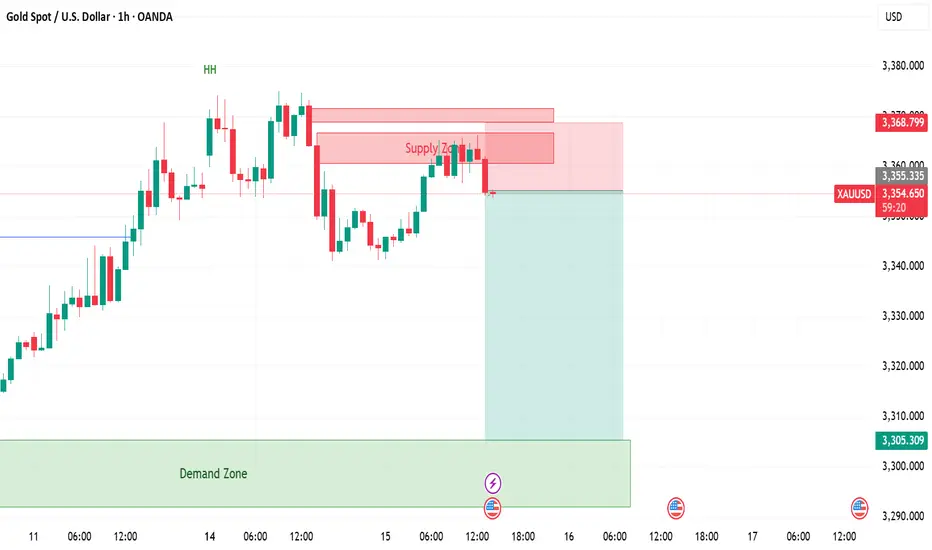
GOLD LONG FROM RISING SUPPORT|
✅GOLD is trading in an uptrend
Which makes me bullish biased
And the price is retesting the rising support
Thus, a rebound and a move up is expected
With the target of retesting the level above at 3,350$
LONG🚀
✅Like and subscribe to never miss a new idea!✅
Disclosure: I am part of Trade Nation's Influencer program and receive a monthly fee for using their TradingView charts in my analysis.

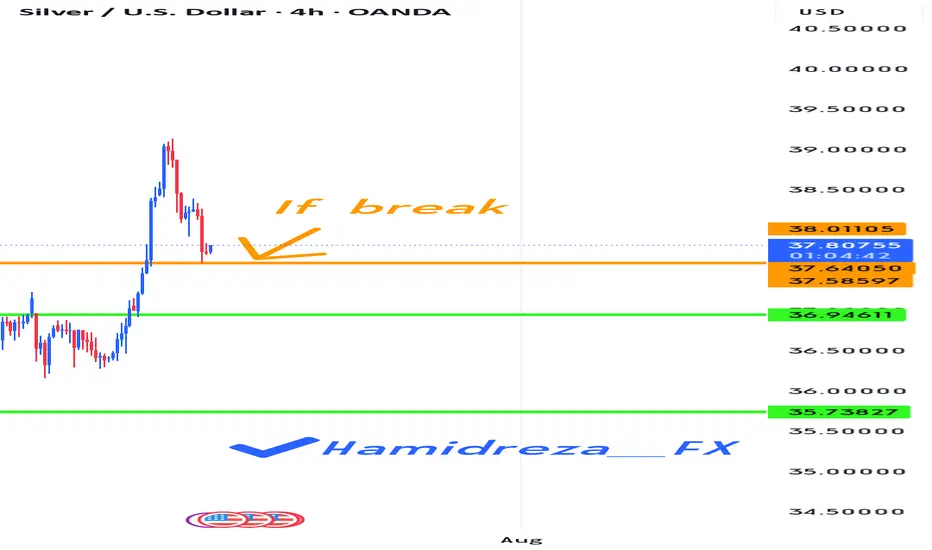
Is it time for a correction for silver?
Hi my dears
It seems that silver, like gold, should spend a few months in a resting phase. Of course, this is a guess. There is a condition on the chart that, if it happens, we should probably see the conditions shown on the chart happen.
I would be happy to hear your opinion.
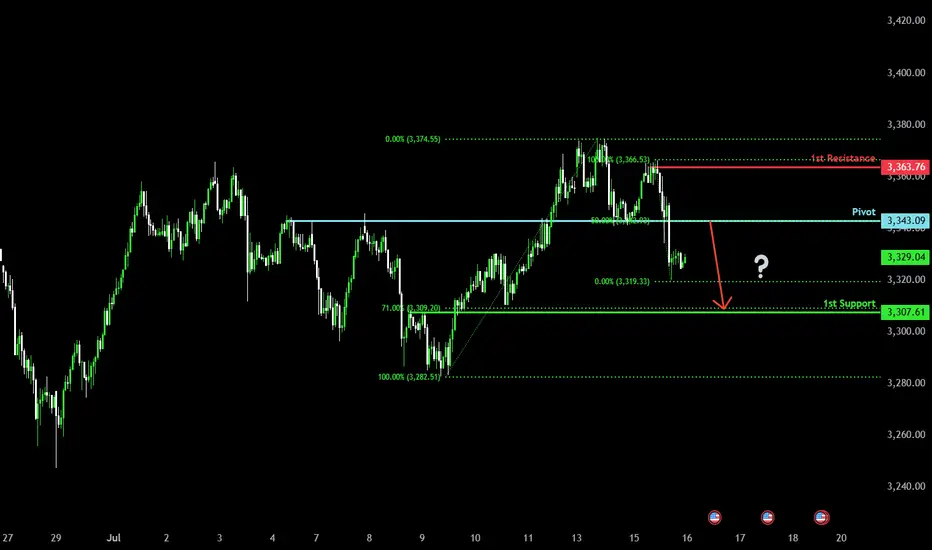
Major resistance ahead?The Gold (XAU/USD) is rising towards the pivot and could reverse to the overlap support.
Pivot: 3,343.09
1st Support: 3,307.61
1st Resistance: 3,363.76
Risk Warning:
Trading Forex and CFDs carries a high level of risk to your capital and you should only trade with money you can afford to lose. Trading Forex and CFDs may not be suitable for all investors, so please ensure that you fully understand the risks involved and seek independent advice if necessary.
Disclaimer:
The above opinions given constitute general market commentary, and do not constitute the opinion or advice of IC Markets or any form of personal or investment advice.
Any opinions, news, research, analyses, prices, other information, or links to third-party sites contained on this website are provided on an "as-is" basis, are intended only to be informative, is not an advice nor a recommendation, nor research, or a record of our trading prices, or an offer of, or solicitation for a transaction in any financial instrument and thus should not be treated as such. The information provided does not involve any specific investment objectives, financial situation and needs of any specific person who may receive it. Please be aware, that past performance is not a reliable indicator of future performance and/or results. Past Performance or Forward-looking scenarios based upon the reasonable beliefs of the third-party provider are not a guarantee of future performance. Actual results may differ materially from those anticipated in forward-looking or past performance statements. IC Markets makes no representation or warranty and assumes no liability as to the accuracy or completeness of the information provided, nor any loss arising from any investment based on a recommendation, forecast or any information supplied by any third-party.
XAUUSD – M15 Buy Setup⚡️XAUUSD – M15 Buy Setup
We’re back to business at a key decision point! Here’s what makes this a compelling opportunity:
📍Buy Setup on M15:
1️⃣ Price tapped into a strong support zone around 3333 – a level with proven reaction history
2️⃣ Third touch of the descending channel – possible breakout setup / bullish flag on HTF
3️⃣ A strong bullish engulfing candle closed above the previous daily close, showing buyer strength
4️⃣ Supported by the H4 MA zone acting as dynamic demand
🔥 Everything aligns technically for a high-probability bounce – but remember:
Strong setup ≠ guaranteed outcome.
We trade probabilities, not certainties.
🚀 Go for it guys... but manage your risk like a pro!
#XAUUSD #Gold #BuySetup #PriceAction #ChannelBreakout #SmartMoney #ChartDesigner #MJTrading #Forex #TradeIdea


Gold 30Min Engaged ( 3355 Bearish Entry Detected )Time Frame: 30-Minute Warfare
Entry Protocol: Only after volume-verified breakout
🩸Bearish Reversal 3355 Zone
➗ Hanzo Protocol: Volume-Tiered Entry Authority
➕ Zone Activated: Dynamic market pressure detected.
The level isn’t just price — it’s a memory of where they moved size.
Volume is rising beneath the surface — not noise, but preparation.
🔥 Tactical Note:
We wait for the energy signature — when volume betrays intention.
The trap gets set. The weak follow. We execute.

Daily Market Outlook. 16.07.2025, CPI dayGold Short and NQ order flow explained. Along with the Dollar Index

SILVER Support Ahead! Buy!
Hello,Traders!
SILVER is going down now
But the price is trading in a
Long-term uptrend so we are
Bullish biased and after the
Price retests of the horizontal
Support support below
Around 37.20$ we will be
Expecting a bullish rebound
Buy!
Comment and subscribe to help us grow!
Check out other forecasts below too!
Disclosure: I am part of Trade Nation's Influencer program and receive a monthly fee for using their TradingView charts in my analysis.

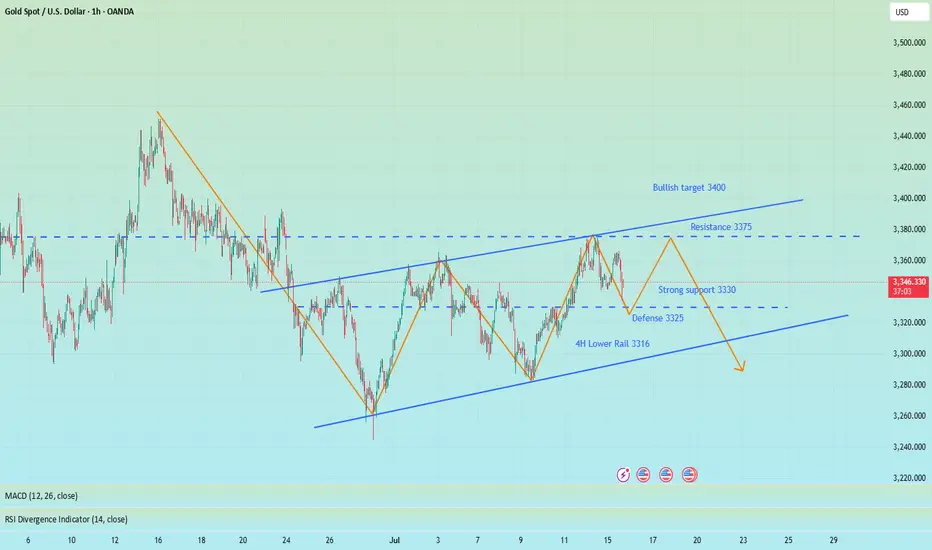
GOLD 1H CHART ROUTE MAP UPDATEHey Everyone,
Quick follow up on our 1H chart idea
We had a nice push up on the chart at the start of the week, coming close but just short of the 3381 gap. Still, it was a solid catch that respected our levels beautifully.
Following that, we cleared our 3353 Bearish Target, which also triggered the EMA5 cross and lock, confirming the move toward our 3328 retracement range, a level we hit perfectly.
As expected, we're now seeing a reaction in this 3328 zone, which remains key. We are watching this closely for a potential bounce. However, if price crosses and locks below 3328, the swing range will open, setting up the potential for a larger swing bounce from deeper levels.
We’ll continue using dips and key support zones for scalps and intraday bounces, aiming for 20–40 pips per level. The structure remains valid, and as mentioned before, our back-tested levels have consistently shown strong reaction zones over the past 24 months.
Updated Reminder of Key Levels:
BULLISH TARGET
3381
EMA5 CROSS & LOCK ABOVE 3381 opens
3416
EMA5 CROSS & LOCK ABOVE 3416 opens
3439
BEARISH TARGETS
3353 ✅ HIT
EMA5 CROSS & LOCK BELOW 3353 opens
3328 ✅ HIT
EMA5 CROSS & LOCK BELOW 3328 opens
3305
EMA5 CROSS & LOCK BELOW 3305 opens Swing Range:
3288
3259
As always, we’ll continue monitoring and sharing updates, as price reacts around these zones. Thank you all for the continued support, your likes, comments, and follows are genuinely appreciated!
Mr Gold
GoldViewFX

GOLD - SHORT TO $2,800 (1H UPDATE)Yesterday's entry hit SL, as price pushed up a little higher for liquidity, ahead of today's CPI data.
I have entered another sell entry today at $3,353. Couldn't send analysis straight away as I was out & didn't have my laptop on me. But re-trying this analysis one last time. If SL is hit, we will wait for $3,400 entry.

GOLD - SHORT TO $2,800 (1H UPDATE)Gold sells are running in amazing profits! Price is now down 320 PIPS in profit from our entry at $3,353, within the Gold Fund for my investors.
Let me know how many of you are currently in this trade🤝

LITCOIN : So what is an ETF ?Hello friends
Be careful with the recent fluctuations of this coin because the movements of this coin have become unpredictable and we suggest that if you want to buy, buy in the specified support areas and in steps, of course with capital and risk management...
We have also specified targets for you.
*Trade safely with us*

Gold 30Min Engaged ( Bearish Reversal Entry Detected )Time Frame: 30-Minute Warfare
Entry Protocol: Only after volume-verified breakout
🩸Bearish Retest - 3347.5
➗ Hanzo Protocol: Volume-Tiered Entry Authority
➕ Zone Activated: Dynamic market pressure detected.
The level isn’t just price — it’s a memory of where they moved size.
Volume is rising beneath the surface — not noise, but preparation.
🔥 Tactical Note:
We wait for the energy signature — when volume betrays intention.
The trap gets set. The weak follow. We execute.
Gold 30Min Engaged ( Bearish Reversal Entry Detected )
XAUUSD | GOLD | SellGot the confirmation from 15 minute timeframe.
Sell Gold till demand zone.
R:R 1:3,8

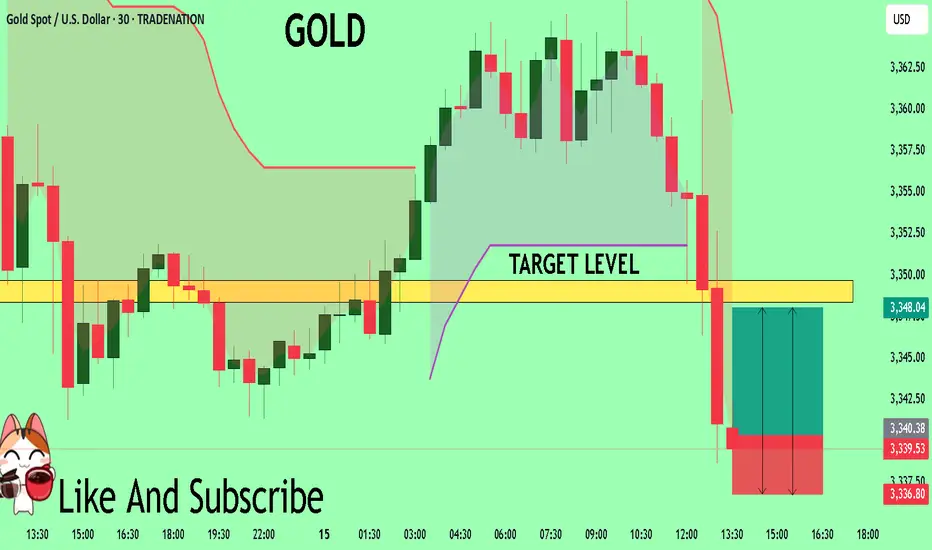
GOLD The Target Is UP! BUY!
My dear subscribers,
GOLD looks like it will make a good move, and here are the details:
The market is trading on 3340.39 pivot level.
Bias - Bullish
My Stop Loss - 3336.8
Technical Indicators: Both Super Trend & Pivot HL indicate a highly probable Bullish continuation.
Target - 3348.3
About Used Indicators:
The average true range (ATR) plays an important role in 'Supertrend' as the indicator uses ATR to calculate its value. The ATR indicator signals the degree of price volatility.
Disclosure: I am part of Trade Nation's Influencer program and receive a monthly fee for using their TradingView charts in my analysis.
———————————
WISH YOU ALL LUCK
GOLD (XAUUSD): Mid-Term Outlook
Analysing a price action on Gold since March,
I see a couple of reliable bullish signals to consider.
As you can see, for the last 4 month, the market is respecting
a rising trend line as a support.
The last 4 Higher Lows are based on that vertical support.
The last test of a trend line triggered a strong bullish reaction.
The price successfully violated a resistance line of a bullish flag pattern,
where the market was correcting for almost a month.
A strong reaction to a trend line and a breakout of a resistance of the flag
provide 2 strong bullish signals.
I think that the market may grow more soon and reach at least 3430 resistance.
An underlined blue area will be a demand zone where buying orders will most likely accumulate.
❤️Please, support my work with like, thank you!❤️

US CPIs came out. Gold is at an interesting spot.TVC:GOLD is currently struggling with one of its key resistance barriers, at around 3365. We need a clear break above that area in order to aim for higher areas. However, we are not getting bearish yet. Let's dig in!
MARKETSCOM:GOLD
Let us know what you think in the comments below.
Thank you.
75.2% of retail investor accounts lose money when trading CFDs with this provider. You should consider whether you understand how CFDs work and whether you can afford to take the high risk of losing your money. Past performance is not necessarily indicative of future results. The value of investments may fall as well as rise and the investor may not get back the amount initially invested. This content is not intended for nor applicable to residents of the UK. Cryptocurrency CFDs and spread bets are restricted in the UK for all retail clients.
