Looking for catalysts - Gold Outlook July 7 - July 11, 2025All about last week you can find here:
FX_IDC:XAUUSD Gold is currently seeking fresh catalysts this week. 🧐
While the economic calendar appears light for this time of year, a lack of economic data doesn't mean nothing is happening. Geopolitical events, especially tariff wars or other flashpoints, remain significant. Are there increasing signs for peace in the Middle East between Israel and Hamas? 🕊️
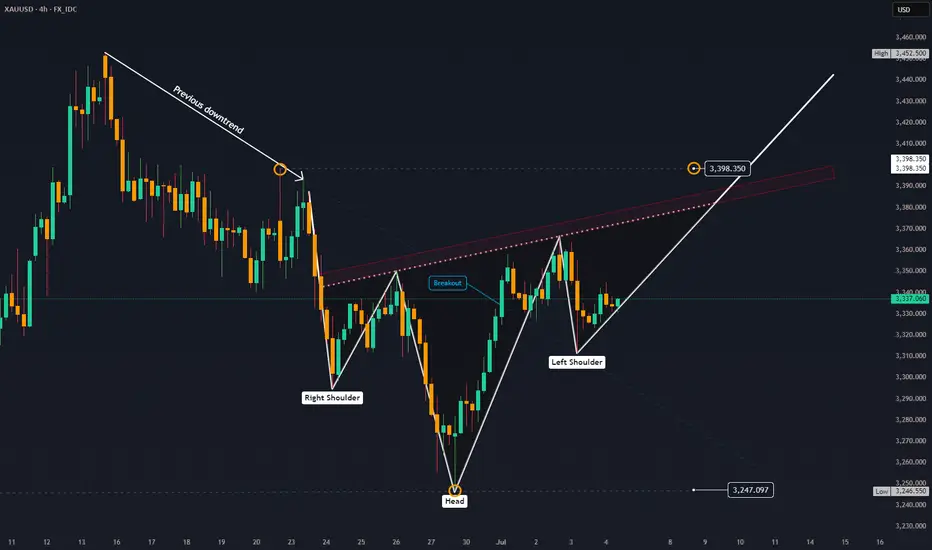
This week Gold could take advantage from an exisiting reversal head and shoulders pattern and painting pitchfork in the chart shows possibillities for Upside targeting $3400.
## Geopolitical News Landscape 🌍📰
Israel / Iran ⚔️🛑☢️
After fierce clashes in June, a **ceasefire** began June 24. 🇮🇷 Iran's Supreme Leader reappeared July 6, claiming victory 🎤. Tehran has now **banned IAEA inspectors** ❌🔍. Over 900 Iranians reportedly killed ⚰️.
🔮 Outlook: ⚠️ Nuclear tensions growing, diplomacy frozen 🧊. Regional powers remain on high alert 🚨.
India / Pakistan 🗻🔫🕌
Tense calm in Kashmir 😐. India launched its sacred **Amarnath Yatra** 🕉️ under heavy security 🛡️. Pakistan killed 30 militants near the Afghan border ⚔️, while China 🐉 admitted sharing intel 📡.
🔮 Outlook: Diplomatic track stays open 🕊️, but **border flare-ups** and water disputes 💧 remain volatile 🔥.
Gaza Conflict 💣🏘️🕊️
Israel launched deadly airstrikes ✈️, including one on a beach café ☕🏖️ killing 22. Dozens more died 💔. IDF admitted accidental strikes on aid sites 🚚❌. U.S.-led talks seek a **60-day truce** 🤝.
🔮 Outlook: Ceasefire possible 🛑, but **humanitarian crisis** worsening 🚨🩺. Trust remains fragile 💔.
Russia / Ukraine ⚔️
Zelenskyy 🇺🇦 and Trump 📞 discussed new air defense aid 🎯. Russia answered with **massive drone strikes** on Kyiv 🚁🔥. NATO boosts arms shipments 🔫 and backs Ukraine’s domestic weapons production 🏭.
🔮 Outlook: War grinds on ⚙️. No peace in sight, with **global stakes** rising 📈.
U.S. / China Trade War 💼📦🔥
With new tariffs looming 📆💣, Treasury said “multiple deals” are near 🤝. Trump claimed a **partial deal with China** 🐉, though tariffs remain high 📊.
🔮 Outlook: More piecemeal deals 🍰, but a **full-scale trade reset** looks unlikely before elections 🗳️.
🌍 Global Trade War 📉🚢💸
Trump’s shifting tariffs 🎯 hurt global growth 🌐. Markets hit record highs 📈 but investment chills ❄️. The 💵 dollar had its sharpest 6-month drop 📉 in decades.
🔮 Outlook: Businesses remain cautious ⚠️. **Supply chains** reroute 🔄. No global rebound without clarity 🔍.
Trump vs. Powell 💥🏛️📉
Trump demanded Powell’s resignation ❌📉, accusing him of weak rate policy 📊. Powell held firm 🧊, citing inflation risks 📈. Trump eyes replacements 👀🪑.
🔮 Outlook: Fed independence 🏛️ under fire 🔥. **Rate policy** may get politicized ahead of 2025 elections 🗳️.
📈 U.S. Inflation 🛒💰🧾
Inflation slowed to 0.1% 🐢, but tariffs raised prices on appliances 🔌 (+4.3%) and toys 🧸. Fed projects 3% inflation by year-end 📊.
🔮 Outlook: As **tariffs bite** 🦷, inflation likely to climb 📈. Fed stays cautious 🧐 on cuts.
Technical View 📐📈
Analysis Period: May 25 - June 6, 2025 | Forecast: June 7-11, 2025
1. ICT (Inner Circle Trader) Methodology Analysis 🧠
Market Structure
Higher Timeframe Bias: The chart shows a clear bullish market structure with higher highs and higher lows from the major low around 3,250. 🐂
Current Structure: Price is in a consolidation phase after reaching highs near 3,370, showing potential distribution. ⚖️
Key ICT Concepts Identified:
Fair Value Gap (FVG): Multiple gaps visible during the strong rally from 3,250 to 3,370. 💨
Order Blocks: Significant demand zone around 3,250-3,260 level (major accumulation area). 📦
Liquidity Zones:
Buy-side liquidity above 3,370 (recent highs). 💸
Sell-side liquidity below 3,320 (recent consolidation lows). 📉
Market Maker Models: Classic accumulation-manipulation-distribution pattern visible. 🔄
Session Analysis:
London Session: Shows strong directional moves. 🇬🇧
New York Session: Continuation of trends with increased volatility. 🗽
Asian Session: Consolidation and range-bound behavior. 🌏
2. Gann Analysis 🧙♂️
Gann Angles & Time Cycles:
Primary Trend: 1x1 angle supporting the bullish move from 3,250. ↗️
Resistance Angles: 2x1 and 3x1 angles providing resistance around current levels. 🚧
Time Cycles:
7-day cycle showing completion around June 2-3. 🗓️
14-day cycle suggesting potential reversal window June 7-9. ⏳
Gann Price Levels:
Major Support: 3,250 (1/8 level). 🛡️
Current Resistance: 3,370 (7/8 level). 🛑
Next Target: 3,400 (full octave completion). 🎯
Geometric Relationships:
Price squared relationship suggests 3,380-3,400 as natural resistance. 📐
Time-price balance indicates consolidation period before next major move. 🕰️⚖️
3. Fibonacci Analysis ✨
Retracement Levels (from 3,250 low to 3,370 high):
23.6%: 3,341.6
38.2%: 3,324.2
50.0%: 3,310.0
61.8%: 3,295.8
78.6%: 3,265.6
Extension Levels:
127.2%: 3,402.6
161.8%: 3,444.2
200.0%: 3,490.0
Current Analysis:
Price has respected the 23.6% retracement level multiple times. ✅
Strong support confluence at 38.2% level (3,324). 💪
Extension targets suggest potential move to 3,402-3,444 range. 🚀
4. Institutional Levels Analysis 🏦
Psychological Levels:
3,300: Major round number providing support. 💯
3,350: Mid-level resistance. 📊
3,400: Next major psychological target. 🎯
Institutional Order Flow:
Accumulation Zone: 3,250-3,280 (heavy institutional buying). 💰
Distribution Zone: 3,350-3,370 (profit-taking area). 💸
Breakout Target: 3,400+ (next institutional objective). ⬆️
Volume Analysis:
High volume on the initial move up from 3,250. 📈
Decreasing volume during consolidation (typical distribution pattern). 📉
Volume expansion needed for breakout confirmation. 💥
5. Cycle Timing Analysis ⏰
Short-Term Cycles:
3-day cycle: Currently in compression phase. 🤏
7-day cycle: Completed around June 2-3. ✅
14-day cycle: Due for completion June 7-9. ⏳
Medium-Term Cycles:
Monthly cycle: Bullish momentum phase. ⬆️
Quarterly cycle: In expansion phase. 🌟
Cycle Projection:
Next major cycle turn expected June 7-9. 🔄
Potential for either breakout or correction during this window. 🤞
6. FORECAST: June 7-11, 2025 🔮
Primary Scenario (60% probability): Bullish Breakout 🚀
Target 1: 3,400-3,410
Target 2: 3,440-3,450
Catalyst: Break above 3,370 with volume. 💥
Timeline: June 7-9 initial move, June 10-11 extension.
Secondary Scenario (35% probability): Corrective Pullback ⬇️
Target 1: 3,320-3,325 (38.2% Fibonacci)
Target 2: 3,300-3,310 (psychological support)
Catalyst: Failure to break 3,370 resistance. 🚫
Timeline: June 7-8 decline, June 9-11 consolidation.
Low Probability Scenario (5% probability): Deep Correction 📉
Target: 3,280-3,290 (61.8% Fibonacci)
Catalyst: Major risk-off sentiment. 😱
Timeline: Extended throughout the week.
7. Key Assumptions & Risk Factors 🤔
Bullish Assumptions:
Continued institutional accumulation at current levels. 🏦
Breakout above 3,370 with confirming volume. ⬆️
Favorable macroeconomic backdrop for gold. 🌍
Weakness in USD supporting gold prices. 💵
Geopolitical tensions maintaining safe-haven demand. 🕊️
Bearish Risk Factors:
Profit-taking at psychological 3,400 level. 🤝
Stronger USD due to economic data. 💹
Reduced safe-haven demand. 📉
Technical failure at key resistance levels. 🚧
Central bank policy shifts. 🏛️
8. Trading Recommendations 💡
Entry Strategies:
Bullish Setup: Buy on pullback to 3,340-3,345 with stop below 3,320. 🎯
Breakout Play: Buy break above 3,372 with stop below 3,350. 🚀
Conservative: Wait for retest of 3,324 support area. patiently 🧘
Risk Management:
Position Size: Limit to 2-3% of portfolio per trade. 📏
Stop Loss: Always use stops below key support levels. ⛔
Take Profit: Scale out at Fibonacci extension levels. 💰
Key Levels to Watch:
Immediate Resistance: 3,365-3,370 🛑
Support: 3,340-3,345 🛡️
Breakout Level: 3,372 🚀
Major Support: 3,320-3,325 💪
9. Conclusion ✅
The XAUUSD chart presents a constructive bullish setup with multiple confluences supporting higher prices. The completion of various cycles around June 7-9 suggests a potential catalyst for the next major move. While the primary bias remains bullish targeting 3,400+, traders should remain alert to the possibility of a corrective pullback to test lower support levels. 🧐
The institutional accumulation pattern, combined with favorable Gann angles and Fibonacci projections, supports the bullish thesis. However, proper risk management is essential given the potential for volatility around key psychological levels. ⚠️
Please take the time to let me know what you think about this. 💬
-------------------------------------------------------------------------
This is just my personal market idea and not financial advice! 📢 Trading gold and other financial instruments carries risks – only invest what you can afford to lose. Always do your own analysis, use solid risk management, and trade responsibly.
Good luck and safe trading! 🚀📊
Metals
Gold Looks Bullish: technical and fundamentalHi Guys!
Gold is starting to flash major bullish signals, and this time, it’s not just about the chart. The technical setup is clean, but we’re also seeing fundamental tailwinds that could fuel a bigger move.
Let’s break it down
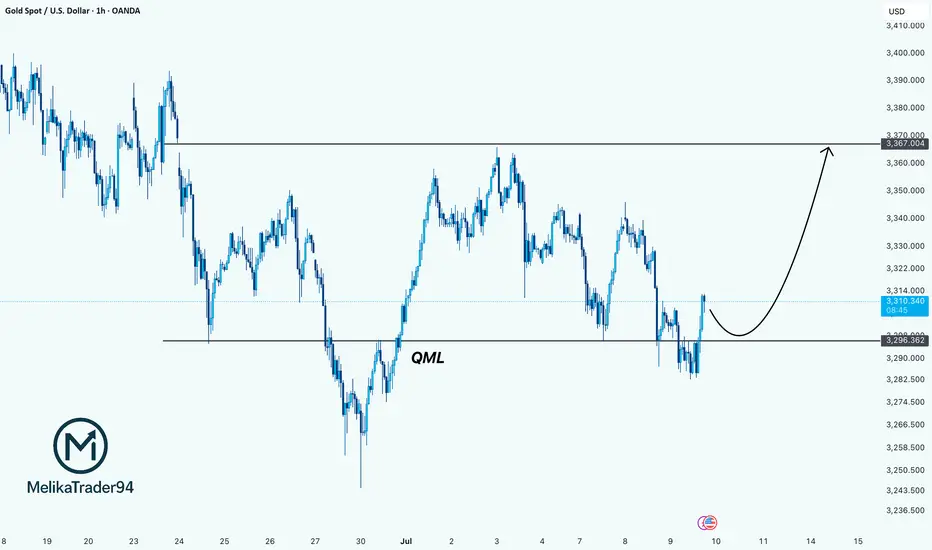
1. Technical Setup: The QML Reversal Is In Play
On the 1H chart, Gold is showing a textbook Quasimodo (QML) reversal pattern. Price made a lower low, then reversed up to break structure, and now it’s pulling back and respecting the key QML zone around $3,296.
This zone has turned into strong support. As long as we stay above it, the structure suggests a continuation toward $3,367 — a clean upside liquidity target and the previous high.
Strategy: Look for pullbacks into $3,296 for potential long entries with targets around $3,367 or higher.
2. Fundamental Tailwinds: Why Gold Is Gaining Strength
The fundamentals are stacking up in Gold’s favor right now. Here’s what’s fueling the move:
- Weakening USD & Rate Cut Expectations
With the Fed increasingly signaling rate cuts by late 2025, the US dollar is losing steam. Lower interest rates reduce the opportunity cost of holding non-yielding assets like Gold, making it more attractive to investors. Traders are already pricing this in.
- Softening Economic Data
Recent U.S. data, including weaker-than-expected job growth and declining manufacturing numbers, points to a slowing economy. That puts more pressure on the Fed to pivot dovish, which historically sends Gold higher.
- Central Bank Demand
Global central banks (especially in Asia) continue to accumulate physical Gold as part of their long-term reserve strategy. That institutional demand provides strong support at lower levels.
Technical + Fundamental = Strong Bullish Bias
We’re seeing a solid confluence here:
Chart says long (QML + bullish structure)
Macro says long (dovish Fed + weaker dollar + safe haven demand)
Drop your thought here!
“Can This XAG/USD Setup Make You the Next Market Thief?”🏴☠️ Operation Silver Swipe — Thief Trading Heist Plan for XAG/USD
🚨 Target Locked: The Silver Vault 🧳🎯
🌟Hi! Hola! Ola! Bonjour! Hallo! Marhaba!🌟
Dear Market Hustlers & Chart Whisperers, 🕵️♂️💼📉💰
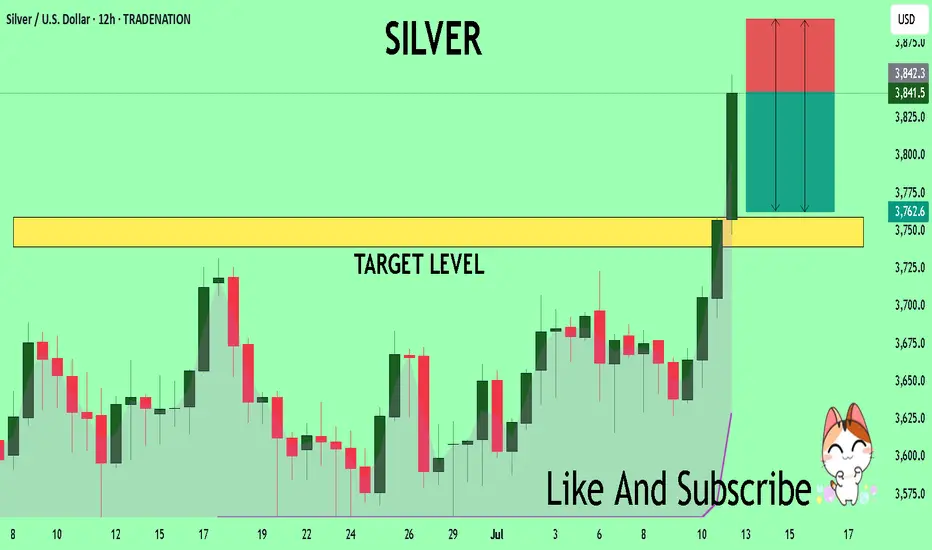
Step into the shadows with our stealth plan based on our signature Thief Trading Style—a mix of smart technicals and crafty fundamentals. Today, we’re eyeing XAG/USD (Silver) for a clean sweep. Here's how to gear up for the breakout job:
🎯 Entry Zone — “The Heist Is On!” 💥
📍Key Level: Break & Retest above 37.000 – that's your cue to act.
🔑Strategy:
Buy Stop Orders: Set above the breakout level
Buy Limit Orders: Use recent 15/30M swings for a sneaky pullback entry 🎯
🛑 Stop Loss — “Every Thief Has a Backup Plan” 🎭
Place your SL like a pro, not a panic button!
📌Recommended: Around 35.660 using the 4H nearest candle wick swing low place after the breakout entry.
⚠️Tip: Adjust based on your risk appetite, lot size, and number of entries. You’re the mastermind, not a minion.
🎯 Target — “Escape Route” 🏃♂️💸
📌 First checkpoint: 38.800
📌 Or take your loot early if the heat rises! (Overbought zones, trend traps, or reversal zones)
💡 Scalper's Shortcut 💡
Go only long for safety. If you’ve got the cash stack, jump in fast. If you’re more of a sneaky swing trader, follow the roadmap and trail your SL to secure that bag 🧳📈
🔍 Market Status
Silver’s in a Neutral Phase – but signs point to an upward getaway 🚀
Fueling this momentum:
Macro & Fundamental trends
COT Positioning
Intermarket Clues
Sentimental Signals
🔗 Read the full breakdown check there 👉🔗🔗🌏🌎!
📢 Trading Alert — News Release Caution ⚠️
Don’t get caught mid-escape during news bombs! 💣
✅ Avoid fresh entries during high-impact events
✅ Use trailing SL to lock in your gains and cover your tracks
💖 Smash the Boost Button if you vibe with this plan 💥
Support the crew and help keep the charts hot and the loot flowing. Your boost powers up our next big heist 🚁🔥
📡 Stay tuned for more street-smart setups... we rob the charts, not the rules! 🐱👤💸📊💎

GOLD - GC | Weekly Recap & Plan 13.07.2025🟡 GOLD (GC) Weekly Recap & Outlook
Symbol: GC1!
Date: Week of July 8–12, 2025
Timeframes Used: 4H, Daily, Weekly, HTF structure
🔍 What Happened Last Week?
Gold saw a strong rejection from a confluence of two HTF trendlines, signaling resistance.
But that move was absorbed by:
🟦 Daily Demand (blue zone)
🔵 Daily Swing Liquidity (blue line)
This builds a bullish structure on the daily chart.
🧭 Scenarios I'm Watching
Scenario 1 — Minor Pullback:
🔹 Price may revisit the Daily Gap (pink line) and find support for continuation.
Scenario 2 — Deeper Pullback:
🟣 Price could retrace into the HTF bullish trendline (purple) before resuming upside.
🗞️ Bonus Macro Scenario: Powell Resignation?
There are growing rumors that Fed Chair Powell might resign this week.
📈 If that happens, I expect strong bullish momentum in Gold —
→ very limited retracement, and
→ potential straight breakout into new highs.
🎯 Targets for the Week:
✅ 1st Target:
W C DOL (purple line) → acts as a primary take profit area.
✅ 2nd Target (Expansion):
EQHs / DOL (extended purple levels)
Game Plan:
Watch for LTF confirmation on both retracement zones.
Maintain bullish bias unless Daily Demand fails.
If Powell resigns, be ready for breakout setups.

XCU/USD: Low-Risk Loot Opportunity!🔥 THE COPPER HEIST: XCU/USD Robbery Plan (Swing/Day Trade) 🔥
🌟 Attention, Market Robbers & Money Makers! 🌟
(Hola! Oi! Bonjour! Hallo! Marhaba!) 🤑💰💸✈️
Based on the 🔥Thief Trading Style🔥, here’s our master heist plan for the XCU/USD "The Copper" Metals Market! This is a high-probability long setup, but we must escape before the police (bears) set their trap near the red zone! 🚨📉
📌 THE HEIST BLUEPRINT
✔ Entry Strategy (Breakout or Pullback)
✔ Stop Loss (Protect Your Loot!)
✔ Target (Escape Before the Cops Arrive!)
🚀 ENTRY: TIME TO STRIKE!
"The heist is ON! Wait for the ATR breakout (5.00000) before moving!"
Option 1: Place Buy Stop orders above the Moving Average.
Option 2: Use Buy Limit orders on pullbacks (15m/30m recent swing lows).
📢 ALERT! Set a breakout alarm—don’t miss the move!
🛑 STOP LOSS: PROTECT YOUR LOOT!
"Yo, listen up! 🗣️ If you're entering on a Buy Stop, DON’T set your SL until AFTER the breakout!
📍 Thief SL Placement: Recent swing low + Moving Average (5H TF) → 4.80000
⚠️ WARNING: If you ignore this, you’re playing with fire! 🔥 (Your risk, not mine!)
🎯 TARGET: CASH OUT & ESCAPE!
🏴☠️ First Take-Profit: 5.25000 (or exit early if the market turns!)
💰 Scalpers: Only trade LONG—use trailing SL to lock in profits!
📊 MARKET STATUS: NEUTRAL (But Bullish Potential! 🐂)
Fundamentals? Check COT Reports, Macro Data, Geopolitics, News Sentiment!
🔗 Links in bio0 for full analysis! 👉🌎📰
🚨 TRADING ALERT: NEWS = VOLATILITY!
⚠️ Avoid new trades during major news!
🔒 Use Trailing SL to protect open positions!
💥 BOOST THIS HEIST PLAN!
Hit 👍 LIKE & 🔄 SHARE to strengthen our robbery squad!
🚀 More heists coming soon—stay tuned! 🤑💎
🎯 FINAL WORD:
"Take profits, treat yourself—you deserve it! 💸🏆"

SILVER Trading Opportunity! SELL!
My dear subscribers,
My technical analysis for SILVER is below:
The price is coiling around a solid key level - 38.415
Bias - Bearish
Technical Indicators: Pivot Points High anticipates a potential price reversal.
Super trend shows a clear sell, giving a perfect indicators' convergence.
Goal - 37.591
My Stop Loss - 38.905
About Used Indicators:
By the very nature of the supertrend indicator, it offers firm support and resistance levels for traders to enter and exit trades. Additionally, it also provides signals for setting stop losses
Disclosure: I am part of Trade Nation's Influencer program and receive a monthly fee for using their TradingView charts in my analysis.
———————————
WISH YOU ALL LUCK
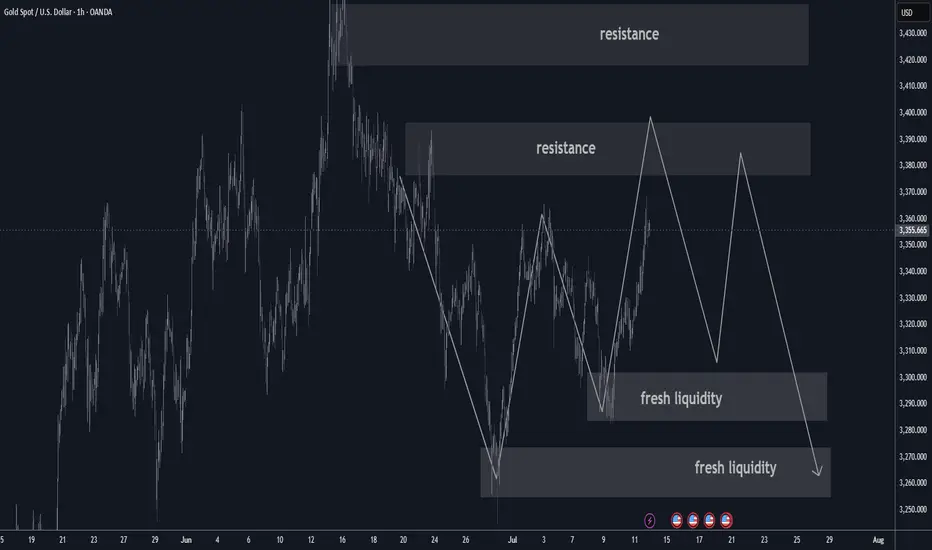
GOLD MARKET ANALYSIS AND COMMENTARY - [Jul 14 - Jul 18]This week, OANDA:XAUUSD opened at $3,342/oz, dropped to $3,282/oz, but then rebounded sharply to close at $3,355/oz. The recovery was mainly driven by former President Trump's announcement of new tariffs ranging from 20% to 50% on imports from 22 countries, effective August 1st. Particularly, a 35% tariff on Canadian goods — a key U.S. trading partner — raised concerns about global trade stability and supply chains.
Trump also proposed 15–20% tariffs on most other trading partners, reigniting fears of global trade disruptions. At the same time, ongoing conflict between Israel and Hamas continued to weigh on sentiment, despite U.S. diplomatic efforts showing little progress.
However, analysts note that gold still lacks strong momentum for a breakout. Trump's tariff threats may be more about negotiation leverage than triggering a full-blown trade war. Meanwhile, with the labor market recovering and inflation rising, the Fed is expected to maintain its neutral monetary policy, limiting short-term gold price movements.
Although geopolitical tensions remain (e.g., Russia-Ukraine, Israel-Hamas), the ceasefire between Israel and Iran has reduced gold’s geopolitical risk premium.
Looking ahead, key U.S. economic data next week — including CPI, PPI, and retail sales — will be closely watched. A strong June core CPI (0.4% or higher) could reduce the likelihood of a Fed rate cut in September, strengthening the USD and pushing gold lower. Conversely, weaker inflation data could boost expectations of a rate cut, supporting gold prices.
📌In terms of technical analysis, gold prices next week may continue to adjust and accumulate. Accordingly, if they surpass the 3,370 USD/oz mark, gold prices next week will challenge the 3,400-3,450 USD/oz range. On the contrary, gold prices next week will adjust down to 3,285 USD/oz, or even 3,245 USD/oz.
Notable technical levels are listed below.
Support: 3,350 – 3,310 – 3,300USD
Resistance: 3,371 – 3,400 – 3,430USD
SELL XAUUSD PRICE 3435 - 3433⚡️
↠↠ Stop Loss 3439
BUY XAUUSD PRICE 3329 - 3331⚡️
↠↠ Stop Loss 3326

XAUUSD Daily Sniper Plan – July 14, 2025Hey team 👋 and welcome to a fresh new week on the charts!
We’re starting this Monday without any major news — just pure price action, clean zones, and structure doing all the talking. No distractions. No excuses. Let’s lock in our focus and let the market show us where the edge is.
🔸 Bias: Bearish while below 3390
Last week’s rejection from the H1 premium zone (around 3375) created clear signs of exhaustion. Price is now forming lower highs and lower lows, with clean CHoCHs on both H1 and M15. Until we reclaim 3390, we remain bearish — waiting for the next lower high to form.
🔽 Sniper Sell Zones (above current price)
3360–3370 → H1 premium FVG + CHoCH OB + EMA5 cap
3380–3390 → Inducement zone + internal imbalance + RSI divergence
🔼 Sniper Buy Zones (below current price)
3310–3320 → Discount FVG + BOS base + HL support
3280–3290 → Final HL structure zone + fib 61.8% + OB + RSI oversold
🟡 Decision Zone:
3330–3340 → Neutral zone
→ Wait for break and retest or rejection confirmation.
→ No setup = no trade.
🧠 Battle Plan – Execution Scenarios:
🔴 Scenario A – Bearish Setup Active:
If price returns to 3360–3370 or 3380–3390 and shows M15/M30 rejection → enter short.
Target: 3330 → 3310.
If 3390 is broken and held → cancel short bias.
🟢 Scenario B – Bullish Setup Activated:
If price sweeps 3320 or 3290 and reacts with strong bullish PA (engulfing or CHoCH) → enter long.
Target: 3340 → 3360.
No confirmation = stay flat, do not anticipate.
🟡 Scenario C – No Reaction / Choppy Flow:
If price consolidates between 3330–3340 without clean rejection or break → wait.
Let price show its hand. Today is Monday — we need clarity, not emotion.
Every level in this plan was drawn with purpose — no shortcuts, no borrowed zones.
If you value structure, discipline, and originality in your trading, you’re in the right place.
Your support means everything — I see every 🚀 and every comment, and I appreciate this community deeply.
Let’s keep growing, with real work and real structure.
Follow GoldFxMinds — we stay sharp, we stay true. 💛
📎 Trade Nation Disclaimer
Chart and structure based on Trade Nation broker feed on TradingView. For educational purposes only — not financial advice.

Ethereum (ETH/USD) on the 2-hour timeframe.Ethereum (ETH/USD) on the 2-hour timeframe, here's the analysis and target level:
---
🟦 Chart Observations:
ETH is in a rising channel.
Price is respecting Ichimoku Cloud support.
A bullish breakout pattern is forming (consolidation above the cloud).
My clearly marked "TARGET 3300" at the top.
---
🎯 Target Level:
Primary Target: $3,300
This is the next major resistance and aligns with the top of the projected ascending channel.
Confirmed by your chart annotation.
---
📍 Current Price:
$2,964.3 (Sell) / $2,964.5 (Buy) — as shown in the screenshot.
---
📈 Strategy Suggestion:
Entry: On break above local consolidation / wedge (~$2,980–3,000).
Target: $3,300
Stop-Loss: Below Ichimoku cloud or lower channel (~$2,850 or tighter).
Support Levels to watch:
$2,815 (highlighted on the chart)
$2,700 (lower channel zone)
---
Would you like me to prepare a full trade plan or backtest this setup?

XAUUSD H4 Outlook – July 15, 2025After a sharp early-week move, gold is now pressing into H4 supply with clean CHoCHs and clear inducement in play. With CPI data and multiple FOMC speakers on deck, volatility is rising — and so are the opportunities. Let’s break down the current structure.
🔸 H4 Market Bias
Bias: Bearish unless we close firmly above 3420
Structure: Internal bearish flow remains → HL formed at 3210 → CHoCH → current move likely inducement
Context: Price has filled key FVGs and is testing unmitigated OBs in premium, with RSI approaching exhaustion
🔼 Zones Above Current Price:
3445–3465:
This is the weak high and final layer of buy-side liquidity. It includes an unfilled FVG and marks the upper limit of the premium range. If price reaches this zone, it’s likely to act as a trap before a deeper rejection.
3405–3420:
A clean imbalance zone left after the initial CHoCH push. It has already shown rejection once and is now positioned as the key area where a lower high could form. If price reacts here, it confirms continuation to the downside.
3360–3385:
This is the core supply OB, created from the CHoCH. It also aligns with the premium boundary and EMA21 resistance. Current price is already reacting here. Rejection confirms the bearish bias.
🔽 Zones Below Current Price:
3340–3355:
A minor wick-fill zone from past reactions. It may provide a small pause, but it’s structurally weak and more likely to break on momentum. Not a major support.
3300–3280:
This is the key intraday demand zone. It’s built from a previous BOS and sits at the 50% retracement of the last bullish leg. If this zone breaks, we open up deeper downside potential.
3240–3210:
The strongest demand OB on the chart. This is the HL origin and the 61.8% fib zone. If gold reaches here, expect a major decision: bounce or break.
3185–3160:
The final liquidity base under the higher low. If price sweeps this zone, it signals a major shift — potentially invalidating the June rally structure.
📊 Indicators & Flow Notes:
EMAs (5/21): Crossed bullishly, but testing overextension at 3360
RSI: Leaning overbought → potential for rejection at current zone
Volume: Bearish pressure expected if price fails to close above 3385
Fibonacci (last bullish leg): 50% sits at 3285; 61.8% near 3250
🧠 Trade Scenarios:
🔸 Bearish Setup (preferred):
→ Reject inside 3405–3420 → form LH under 3420 → clean drop toward 3300
→ Ideal confirmation = rejection wick or bearish engulfing on M30–H1
🔸 Bullish Breakout (less likely):
→ Break and hold above 3420 = potential squeeze into 3445–3465
→ Must be supported by CPI upside miss or dovish FOMC tone
→ But 3445–3465 remains weak liquidity — not a safe continuation zone
I appreciate every 🚀, comment, and follow I see on my plans.
If this breakdown helped sharpen your outlook, let me know below.
I post real levels with precision — no hype, just clean structure.
Keep following for daily sniper plans built from logic, not noise. 💼⚔️
--GoldFxMinds--
Chart and structure based on Trade Nation broker feed on TradingView. For educational purposes only — not financial advice.

XAUUSD Daily Outlook – July 14, 2025Happy Sunday, traders. Gold opens the week inside a compressed range under key premium resistance, with CPI and FOMC speakers loading the macro agenda. Let’s break down today’s structure and expectations.
🔸 D1 Structure Overview:
Bias: Neutral with bearish pressure building
Trend: Still technically bullish, but compressing between LH OB and mid-range FVG
Current Position:
Price is trapped below 3395, inside a lower high structure
No clear BOS yet — but bearish CHoCH already formed
EMAs are tightening and RSI is neutral → signs of indecision
🧭 Key Daily Zones:
Zone Type Price Range Confluences
🔼 Supply Zone 3448–3465 Daily OB + FVG + Weak High trap + EMA divergence
🔼 LH OB 3385–3395 Structure cap + internal supply + EMA21 rejection
🔽 Mid FVG Demand 3328–3310 Daily FVG + fib midpoint + prior reaction
🔽 Strong OB Support 3260–3245 Unmitigated OB + fib 61.8% + sweep low base zone
Fibonacci: Pullback toward 3310 = mid-retracement of last bullish impulse
EMA 5/21/50: Bearish crossover confirmed, but no strong divergence yet
RSI: Flat, suggesting reactive play — confirmation must come from PA
📊 Macro Outlook:
Core CPI data drops today → key for market expectations on inflation
Multiple FOMC members will speak — high potential for whipsaw moves
Gold may remain volatile and range-bound until post-CPI structure resolution
📌 Trade Scenarios:
Bearish case: Reject from 3385 → continuation toward 3310 or deeper into 3245
Bullish case: Clean break & retest above 3395 → short-term pump into 3460 liquidity
Confirmation matters — follow the reaction at each zone, don’t rush reversals.
✅ I appreciate every 🚀, comment, and follow I see on my plans.
If this breakdown brought you clarity, show some love below.
I post pure structure, no noise — every day.
Keep following GoldFxMinds for sniper insights, real levels, and full transparency on XAUUSD.
Let’s grow sharp, consistent, and fearless — together. 💛
📎 Disclaimer:
Chart and analysis based on Trade Nation broker feed on TradingView.
This is a technical outlook for educational purposes and not financial advice.

Weekly XAUUSD Outlook (July 14–19, 2025)Hey team — we're entering a decisive week on gold as macro tensions heat up and price dances inside a key premium range. Let’s dive into what the chart is telling us.
🔸 HTF Bias: Weekly Structure Breakdown
Bias: Bullish with exhaustion signs
Current candle: Bearish rejection forming after last week's lower high inside the premium range
Trend: Still bullish overall, but stalling inside a distribution-like pattern
Weekly structure:
Confirmed CHoCH in early 2023 launched the bullish leg
Break of structure toward Higher High (HH) continues but weak high was created near 3500
We’re currently inside a weekly premium range, rejecting the upper quadrant
🔸 Key Weekly Confluences:
Zone Type Price Level Confluences
🔼 Resistance 3490–3500 Weak High + Premium zone + FVG + RSI divergence
🔼 Upper Range 3450–3470 Historical imbalance fill + EMA5 overextension
🔽 Support 3355–3320 Weekly OB + Discount side of premium leg + FVG
🔽 Deep Support 3200–3170 Last strong demand + BOS origin + RSI oversold risk zone
Fibonacci Range: 3500 = top of the bullish extension; 50% retracement sits around 3250
RSI (Weekly): Starting to curve down from overbought territory — watch for structure cracks
EMAs (5/21/50): Strong upside lock remains but a flattening 5EMA hints short-term slow-down
🗓 Macro + News Context:
This week is loaded with high-impact U.S. data and a parade of FOMC speakers:
Core CPI (Monday) and Retail Sales (Thursday) = critical for short-term inflation outlook
FOMC members speaking throughout the week = high chance of volatility spikes
Pre-G20 positioning (Friday–Saturday) could lead to risk-off flows or safety bids on gold
Watch Crude Oil Inventories and Building Permits for risk sentiment impact
The combination of CPI, retail sales, and continuous Fed commentary could cause abrupt sentiment swings — especially if inflation surprises to the upside again.
⚠️ What to Watch This Week:
Any weekly close above 3470 = potential sweep into weak high (3500)
Failure to hold 3355 zone = opens the door to revisit the deeper OB around 3200
Look for a lower high inside premium to confirm bearish weekly intent — otherwise we remain bullish
Any bounce from 3320 must show strong volume + FVG reaction to confirm continuation
✅ Final Notes:
This week is all about patience. We’re in a premium exhaustion phase, and with heavy macro catalysts on the table, gold is primed for a decisive breakout — up or down.
Stay flexible. Let price show its hand around the major zones. We’ll refine sniper entries on H4 and H1 once the weekly opens fully.
—
📌 If this breakdown helped, hit 🚀🚀🚀 follow @GoldFxMinds🔔 for daily updates as this structure develops and drop a comment:
Will gold sweep 3500 or collapse toward 3200? 👇
📢 Disclosure:
This analysis is based on the Trade Nation TradingView feed. I’m part of their Influencer Program and receive a monthly fee.
⚠️ Educational content only — not financial advice.

GOLD 1H CHART ROUTE MAP UPDATE & TRADING PLAN FOR THE WEEKHey Everyone,
Please see our updated 1h chart levels and targets for the coming week.
We are seeing price play between two weighted levels with a gap above at 3381 and a gap below at 3353. We will need to see ema5 cross and lock on either weighted level to determine the next range.
We will see levels tested side by side until one of the weighted levels break and lock to confirm direction for the next range.
We will keep the above in mind when taking buys from dips. Our updated levels and weighted levels will allow us to track the movement down and then catch bounces up.
We will continue to buy dips using our support levels taking 20 to 40 pips. As stated before each of our level structures give 20 to 40 pip bounces, which is enough for a nice entry and exit. If you back test the levels we shared every week for the past 24 months, you can see how effectively they were used to trade with or against short/mid term swings and trends.
The swing range give bigger bounces then our weighted levels that's the difference between weighted levels and swing ranges.
BULLISH TARGET
3381
EMA5 CROSS AND LOCK ABOVE 3381 WILL OPEN THE FOLLOWING BULLISH TARGETS
3416
EMA5 CROSS AND LOCK ABOVE 3416 WILL OPEN THE FOLLOWING BULLISH TARGET
3439
BEARISH TARGETS
3353
EMA5 CROSS AND LOCK BELOW 3353 WILL OPEN THE FOLLOWING BEARISH TARGET
3328
EMA5 CROSS AND LOCK BELOW 3328 WILL OPEN THE FOLLOWING BEARISH TARGET
3305
EMA5 CROSS AND LOCK BELOW 3305 WILL OPEN THE SWING RANGE
3288
3259
As always, we will keep you all updated with regular updates throughout the week and how we manage the active ideas and setups. Thank you all for your likes, comments and follows, we really appreciate it!
Mr Gold
GoldViewFX

GOLD 4H CHART ROUTE MAP UPDATE & TRADING PLAN FOR THE WEEKHey Everyone,
Please see our updated 4h chart levels and targets for the coming week.
We are seeing price play between two weighted levels with a gap above at 3364 and a gap below at 3297. We will need to see ema5 cross and lock on either weighted level to determine the next range.
We will see levels tested side by side until one of the weighted levels break and lock to confirm direction for the next range.
We will keep the above in mind when taking buys from dips. Our updated levels and weighted levels will allow us to track the movement down and then catch bounces up.
We will continue to buy dips using our support levels taking 20 to 40 pips. As stated before each of our level structures give 20 to 40 pip bounces, which is enough for a nice entry and exit. If you back test the levels we shared every week for the past 24 months, you can see how effectively they were used to trade with or against short/mid term swings and trends.
The swing range give bigger bounces then our weighted levels that's the difference between weighted levels and swing ranges.
BULLISH TARGET
3364
EMA5 CROSS AND LOCK ABOVE 3364 WILL OPEN THE FOLLOWING BULLISH TARGETS
3429
EMA5 CROSS AND LOCK ABOVE 3429 WILL OPEN THE FOLLOWING BULLISH TARGET
3499
EMA5 CROSS AND LOCK ABOVE 3499 WILL OPEN THE FOLLOWING BULLISH TARGET
3561
BEARISH TARGETS
3297
EMA5 CROSS AND LOCK BELOW 3297 WILL OPEN THE SWING RANGE
3242
3171
EMA5 CROSS AND LOCK BELOW 3171 WILL OPEN THE SECONDARY SWING RANGE
3089
3001
As always, we will keep you all updated with regular updates throughout the week and how we manage the active ideas and setups. Thank you all for your likes, comments and follows, we really appreciate it!
Mr Gold
GoldViewFX

Bitcoin pushes higher, but its not the only game in townBitcoin is up around 26% this year. A strong gain. But it’s not alone. The higher Bitcoin rises, the less the gains become in percentage terms. It's now in a different league, so a $1,000 or $10,000 move its necessarily what it used to be.
Meanwhile, Gold, silver and copper have also pushed higher in 2025. The Nasdaq 100 is up too. All signs point to a weakening US dollar.
When risk assets and commodities rally together, it's a signal. Investors are shifting. Not out of fear, but to diversify away from the dollar. This is a theme that’s building strength.
Gold is up nearly over 25% YTD. Silver even more. Copper, the industrial bellwether, has joined the rally. These aren’t just trades. They’re strategic moves. A hedge against dollar debasement, inflation, and long-term fiscal risks in the US.
The Nasdaq’s rise tells a similar story. Tech stocks benefit when yields fall and the dollar softens. Big tech also has global revenue exposure. A weaker dollar inflates their earnings in foreign currencies.
What ties all this together? Loss of confidence in the dollar as the sole reserve hedge. Too much debt, too much printing. Central banks know it. They’ve been buying gold for years. Now, retail and institutional investors are catching on.
Bitcoin, the digital alternative to gold, gets the headlines. But it’s part of a broader move. The USD remains the world’s most important currency. That’s not changing tomorrow. But its dominance is being questioned in ways we haven’t seen in decades.
This isn’t just a crypto rally. It’s a dollar diversification play. And it’s gaining momentum.
The forecasts provided herein are intended for informational purposes only and should not be construed as guarantees of future performance. This is an example only to enhance a consumer's understanding of the strategy being described above and is not to be taken as Blueberry Markets providing personal advice.

GOLD DAILY CHART ROUTE MAPHey Everyone,
Daily Chart Follow Up – Structure Still in Full Control
Just a quick update on our daily structure roadmap. Price continues to respect our Goldturn levels with surgical precision.
After the previous bounce off 3272, we’ve now seen over 800 pips of upside follow through. That level once again proved its weight, holding beautifully as support and launching price firmly back toward the upper boundary.
We now have a clear gap overhead at 3433, which sits right near the channel top a familiar rejection zone. With that in play, we’re expecting a range bound dynamic to develop between 3272 and 3433 in the short term.
Here’s what we’re focusing on next:
Range scenario active:
Until price breaks out cleanly, we anticipate swings between 3433 resistance and 3272 support to play out. This is the working range for now.
EMA5 cross and lock:
Watch for a clean EMA5 break and lock, this will be our technical confirmation for whether we’re breaking out of this range or just ping ponging inside it.
Structure remains intact:
No EMA5 breakdown off 3272 during the recent test means buyers remain in control. Until that changes, dips into 3272 continue to offer structured long setups.
Key Levels This Week
Support 3272 Proven bounce zone. As long as this holds, the structure favours upside.
Resistance 3433 Open gap + channel top confluence; expect reaction and potential fade unless we break cleanly with EMA5 confirmation.
As always, we continue to let structure guide the way, measured, deliberate, and data-driven.
Thanks again for all the continued support, every like, comment, and follow is truly appreciated.
Wishing you all a focused and profitable week ahead!
Mr Gold
GoldViewFX

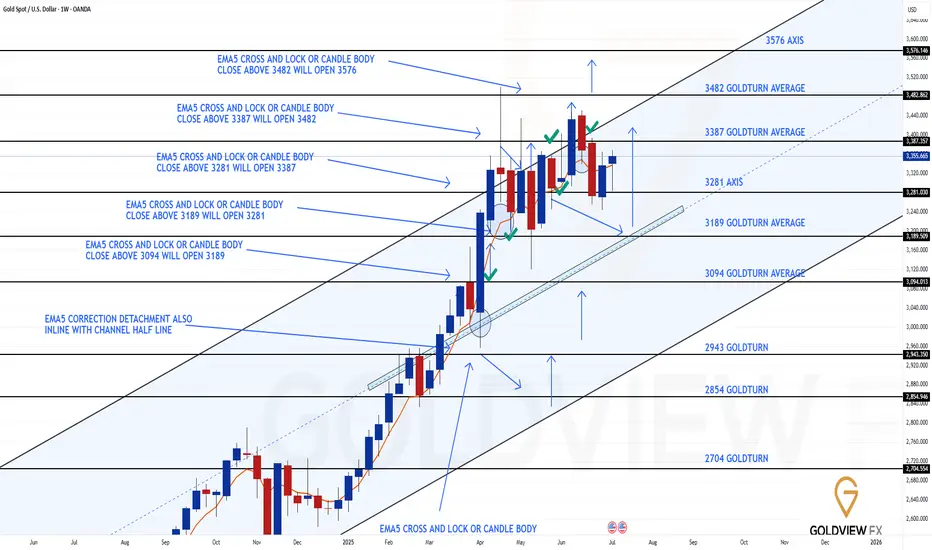
GOLD WEEKLY CHART MID/LONG TERM ROUTE MAPHey Everyone,
Please see update on our weekly chart idea.
Price delivered the rejection at the channel top, so our longer range gap at 3482 remains open overhead. The pullback rejection from channel top extended to 3281 axis precisely where buying interest stepped in, just before the rising channel mid-line, which is edging higher in tandem with price and keeping the broader structure intact.
Key take aways from the latest swing:
Support confirmed:
3281 held on a weekly closing basis, giving us the springboard we needed.
Bounce in motion:
We’ve already reclaimed the prior pivot zone and are now working on the 3387 gap fill; this is the near-term magnet before any attempt at the larger 3482 imbalance.
Structure unchanged:
The channel is still orderly, the EMA5 has curled but hasn’t locked bearishly, and the mid-line continues to ascend beneath price, favouring a measured, step wise climb.
Updated Levels to Watch:
Immediate Support 3281 Proven axis support
Resistance 1 3387 Gap fill target in progress; expect reaction.
Resistance 2 3482 Long standing weekly gap remains the bigger picture objective.
Plan: While 3281 holds, bias remains for a grind higher toward 3387 and ultimately 3482. Should 3281 fail, we reassess at the mid-line for the next structured long setup.
We remain patient and continue reacting to clean structure backed opportunities.
Mr Gold
GoldViewFX
GOLD (XAUUSD): Another Bullish Pattern
Gold perfectly respected a rising trend line on a daily and
bounce from that, as I predicted earlier.
I see a strong bullish pattern on that now.
The price formed a cup & handle pattern and closed
on Friday, testing its neckline.
The next bullish confirmation that you should look for is its breakout.
Daily candle close above 3367 level will provide a breakout validation.
A bullish continuation will be expected then.
❤️Please, support my work with like, thank you!❤️
I am part of Trade Nation's Influencer program and receive a monthly fee for using their TradingView charts in my analysis.

Gold Market Update and Recommended Strategy bulls/bears📉 Gold Holds Steady ~$3,354/oz
Moderate USD strength and tariff-driven safe‑haven buying have kept gold anchored in the $3,330–$3,360 zone.
🤝 Trade & Tariff Influence
Tariff headlines—from Canada’s 35% rate to broader threats—have supported gold by boosting safe‑haven demand heading into U.S. CPI.
📊 Technical Watch
Testing resistance at $3,360; full breakout above $3,342–$3,360 opens path to $3,400–$3,500.
Support sits at $3,330–$3,322 (20‑day EMA); breach risks pickup in short‑term bearish momentum.
💼 U.S. Macro & Fed Cues
Inflation data (June CPI due July 15) and Fedspeak ahead of the July blackout window are set to define next directional moves.
🌍 Central Bank Insight
World central banks are stockpiling gold at record rates, creating a bullish backdrop.
⚖ Range‑Bound Outlook
Expect gold to drift between $3,330–$3,360 near‑term, with upside if tariff/CPI triggers materialize.
📉 Short‑Term Bias
Neutral‑to‑bullish; momentum indicators are calm but could shift quickly on macro surprises.
📈 Med‑Term Outlook Bullish
Ongoing central bank demand, trade dynamics, and macro fundamentals still favor a gradual move toward $3,500+.
⭐ Updated Strategy Recommendations
Accumulate on dips near $3,330–$3,320.
Watch resistance at $3,360–$3,400 for profit‑taking or breakout buying opportunities.
Bears may focus on selling rallies near the upper range.
SILVER: Short Signal with Entry/SL/TP
SILVER
- Classic bearish formation
- Our team expects fall
SUGGESTED TRADE:
Swing Trade
Sell SILVER
Entry Level - 38.415
Sl - 38.910
Tp - 37.378
Our Risk - 1%
Start protection of your profits from lower levels
Disclosure: I am part of Trade Nation's Influencer program and receive a monthly fee for using their TradingView charts in my analysis.
❤️ Please, support our work with like & comment! ❤️

Overtrading – The Silent Threat to Consistent PerformanceTrader Psychology | Part 1: Overtrading – The Silent Threat to Consistent Performance
In trading, more does not mean better. One of the most common and damaging psychological pitfalls traders fall into is overtrading — executing too many trades, often without clear setups, simply to stay active in the market.
It’s subtle, it feels productive… but it quietly erodes both your capital and your discipline.
💡 What Is Overtrading?
Overtrading occurs when a trader opens excessive positions, often outside of their strategy or plan. It’s driven by emotions rather than logic, and usually shows up in one of the following forms:
Taking trades without confirmation
Trying to "make back" previous losses (revenge trading)
Forcing trades during low-volume market conditions
Trading simply out of boredom or anxiety about missing out
It’s not just about the number of trades — it’s about why you’re taking them.
⚠️ How to Know You're Overtrading
You're entering trades that don’t meet your criteria
You feel uncomfortable not having an active position
You trade aggressively after a loss
You switch strategies frequently
Your trading feels more like activity than decision-making
You’re losing more in fees/spread than on price movement
🧠 Why Overtrading Happens
🔹 The Need to Be "Active"
Traders often equate activity with productivity. But the truth is, patience is a trading skill — doing nothing is sometimes the most profitable move.
🔹 Pressure to Perform Daily
Some traders feel they must generate daily profits. This mindset leads to forcing trades during uncertain or low-probability conditions.
🔹 Overconfidence After Wins
A short winning streak can create the illusion of control, pushing traders to increase frequency and risk — usually without real setups to back it up.
🔻 The Cost of Overtrading
Rapid Drawdowns: Frequent small losses and transaction costs add up quickly
Emotional Fatigue: Decision-making becomes reactive instead of rational
Loss of Trust in Your System: Not because the system failed — but because it wasn’t followed
Increased Costs: Spreads, commissions, and swaps eat into your margin
Overtrading doesn’t just hurt your balance. It damages your confidence, focus, and mental capital.
✅ How to Stop Overtrading – Practical Fixes
1. Set a Daily Trade Limit
Commit to a maximum number of trades per session (e.g., 2–3 trades). This forces you to wait for the best opportunities.
2. Track Your Trades in a Journal
Log each trade: the setup, your reasoning, emotions, and outcome. Over time, this reveals emotional patterns and helps you regain discipline.
3. Trade Only During Key Market Hours
Avoid trading during illiquid sessions. Focus on London and New York overlaps, where structure and volatility are present.
4. Accept That Flat Is a Position
Not being in a trade is often a smart decision. Staying out preserves capital and prepares you for higher-probability setups.
🎯 Final Thoughts
Overtrading is not a technical flaw — it’s a psychological leak.
If you want longevity in this game, you must master more than charts — you must master yourself.
“The market doesn’t reward activity. It rewards patience, precision, and emotional control.”
Next time you feel the urge to trade "just because" — pause, breathe, and ask yourself: Is this trade part of my edge?
📌 Coming Up Next:
Trader Psychology | Part 2: FOMO – Why Fear of Missing Out Can Destroy Good Traders
🔔 Follow this profile to be notified when the next chapter is live.

Canadian Venture index --- Inverse head & shouldersGold has reached unprecedented heights, approaching the $3000 mark—a prediction we made with precision. Now is the moment to turn our attention to silver and the mining sector.
To start, let's examine the Canadian venture index, which is displaying a promising inverse head and shoulders pattern. I am confident that the logarithmic projection will be achieved without much difficulty.

Silver to $38The move from March 2020 to August 2020
Was a measured move that played out to the Tee.
We have a similar structure building that projects to the High 30's
Suggesting #Gold move beyond ATH's and #Silver the beta play to move faster in an attempt to catch up, and move towards it's high's again.
