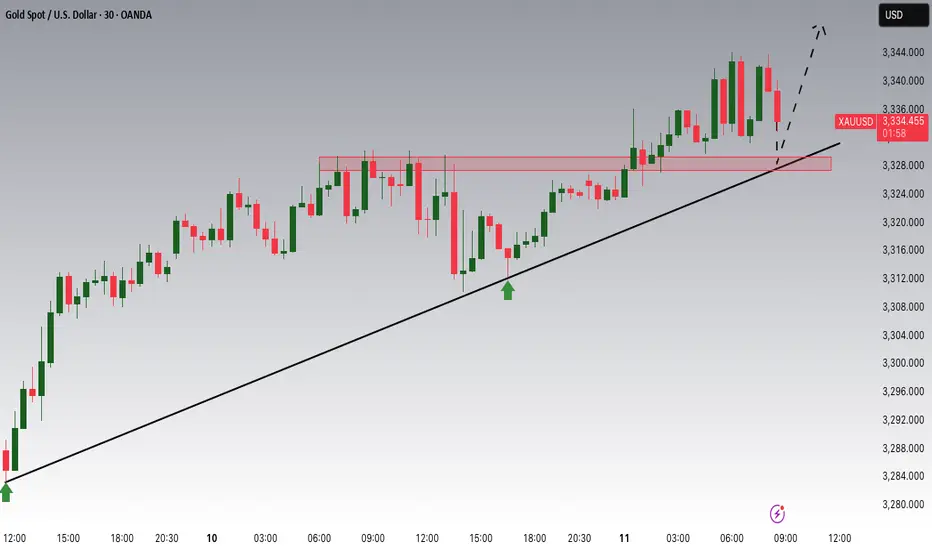
Gold Potential UpsidesHey Traders, in today's trading session we are monitoring XAUUSD for a buying opportunity around 3,330 zone, Gold is trading in an uptrend and currently is in a correction phase in which it is approaching the trend at 3,330 support and resistance area.
Trade safe, Joe.
Metals
Gold 30Min Engaged ( Bullish Entry Detected )Time Frame: 30-Minute Warfare
Entry Protocol: Only after volume-verified breakout
🩸Bullish Break : 3305
➗ Hanzo Protocol: Volume-Tiered Entry Authority
➕ Zone Activated: Dynamic market pressure detected.
The level isn’t just price — it’s a memory of where they moved size.
Volume is rising beneath the surface — not noise, but preparation.
🔥 Tactical Note:
We wait for the energy signature — when volume betrays intention.
The trap gets set. The weak follow. We execute.

Gold - This is the official top!Gold - TVC:GOLD - might top out soon:
(click chart above to see the in depth analysis👆🏻)
Since Gold confirmed its rounding bottom in 2019 it rallied more than +200%. Especially the recent push higher has been quite aggressive, squeezing all bears. But now Gold is somehow unable to create new all time highs, which could constitute the a top formation.
Levels to watch: $3.500, $3.000
Keep your long term vision🙏🙏
Philip (BasicTrading)

Update on: "XAU USD a little & nice BUY set up" 11-07-2025Quick update : I did "collect" a bit earlier (Unlucky I haven't got possibility to monitor trade all the way down today ), TP @ 3365.405.... Like I said earlier, a little & nice trade!
Also, did hit TP around - 3367.188 as promised ! AAA+ trade !
All analysis is based on technical analysis only...
Short & clear without any "BS"...
I do not believe in fundamental analysis (& if you are desperate for it, then... gold is never going to get cheaper in a very long term & it is a good investment for the next 50-100+ years, if you are happy with "preserving" your wealth, but if you are looking get paid this or next week, then...trading is a way. )
All of you have a lovely weekend ( with a nice profit in the pocket ! )

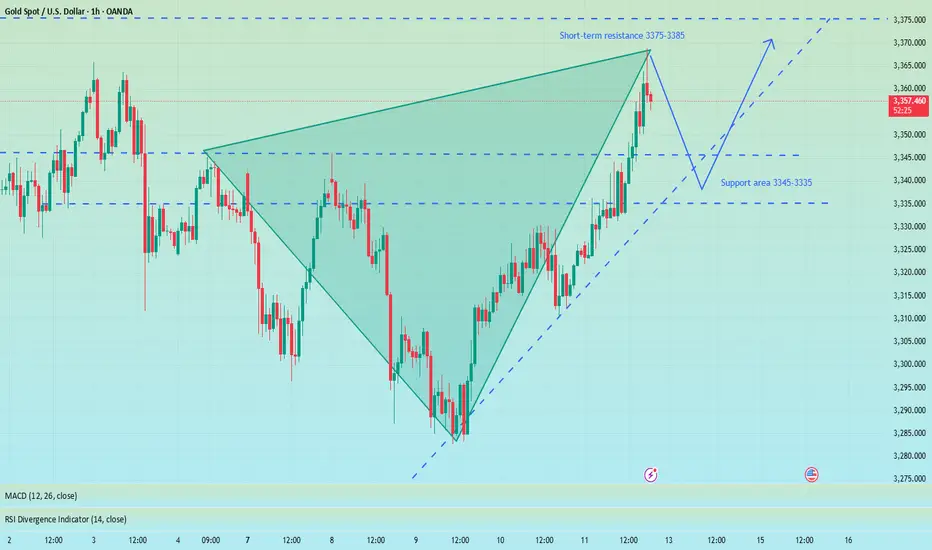
Precisely look at 3365 and pay attention to the pullback chanceAt present, gold has risen as expected and reached the highest level near 3368. The upper 3375-3385 constitutes a short-term resistance level. At present, the bullish momentum is still relatively strong, and the short-term support structure below has been formed. I still maintain the views of the previous transaction and wait for a second trading opportunity when it pulls back below. Although the 1H chart shows that the current trend remains strong and the retracement is small, it is necessary to remain cautious - even if the market is strong, it is not recommended to chase long easily, and the risk of a deep correction in the gold price must be guarded against. First, pay attention to the support area of 3345-3335 below. If it falls back to this level, you can consider going long with a light position.
OANDA:XAUUSD
XAUUSDSELL Plan XAUUSD
GOLD rejecting from 4h resistance zone book partial profits risk free once yuo got 1:1
Best of luck

Gold. The plan for the next few days.The nearest resistance zones are where it's interesting to look for purchases. We are waiting for a reaction and looking for an entry point.
The post will be adjusted if there are any changes.
Don't forget to click on the Rocket! =)

GOLD Rising Support Ahead!
HI,Traders !
#GOLD made a sharp
And sudden move down
And the pair is oversold
So after it retest the rising
Support line we will be
Expecting a local bullish
Correction and a move up !
Comment and subscribe to help us grow !

GOLD ROUTE MAP UPDATEHey Everyone,
Great finish to the week!!!
After completing our Bearish targets throughout the week, we got the swing perfectly, like we analysed and was waiting for our Bullish target to be complete.
- We got the Bullish target at 3358 HIT perfectly completing this range!!
BULLISH TARGET
3358 - DONE
BEARISH TARGETS
3330 - DONE
EMA5 CROSS AND LOCK BELOW 3330 WILL OPEN THE FOLLOWING BEARISH TARGET
3306 - DONE
EMA5 CROSS AND LOCK BELOW 3306 WILL OPEN THE SWING RANGE
3283 - DONE
We will now come back Sunday with a full multi timeframe analysis to prepare for next week’s setups, including updated views on the higher timeframes, EMA alignments, and structure expectations going forward.
Thanks again for all your likes, comments, and follows.
Wishing you all a fantastic weekend!!
Mr Gold
GoldViewFX

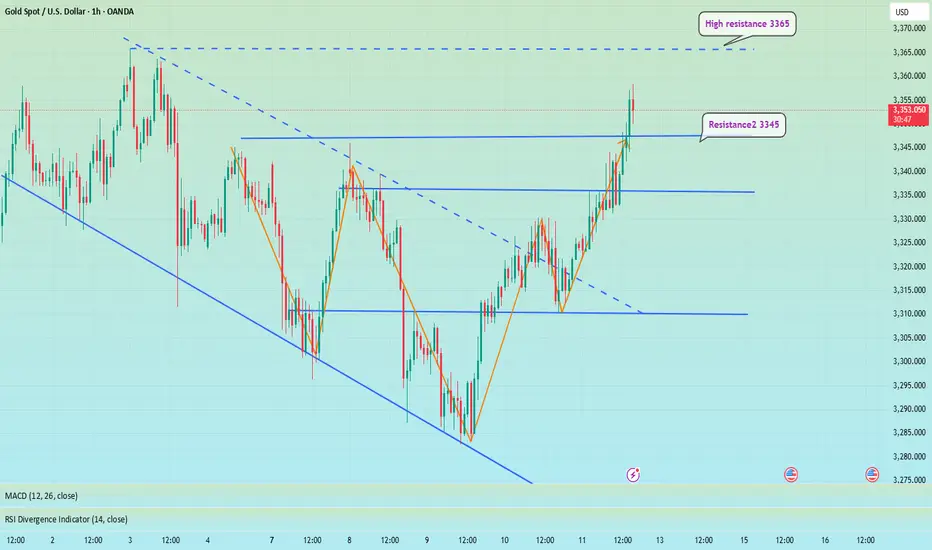
The idea remains unchanged, NY3360-3365 is emptyThe idea remains unchanged during the NY period. Although gold has currently reached a high of around 3348, it has not stabilized above it. If gold successfully breaks through 3350 in the short term, it may reach 3360 or 3365. In the 4H cycle, it presents a step-by-step upward pattern. The K-line is temporarily fluctuating sideways near the upper track. At the same time, 3345 has formed a double top pattern. Combined with Thursday's low of 3310, an inverted triangle oscillation range of 3345-3310 is formed in the short term. This week's trend needs to pay close attention to the breakthrough direction of this range. Short-term long positions can be taken after the trend is confirmed.
XAUUSD@3330-3320 long TP 3345-3365
OANDA:XAUUSD

SILVER: Strong Bullish Sentiment! Long!
My dear friends,
Today we will analyse SILVER together☺️
The market is at an inflection zone and price has now reached an area around 38.207 where previous reversals or breakouts have occurred.And a price reaction that we are seeing on multiple timeframes here could signal the next move up so we can enter on confirmation, and target the next key level of 38.594.Stop-loss is recommended beyond the inflection zone.
❤️Sending you lots of Love and Hugs❤️

Breaking through 3350, the bullish trend remains unchanged📰 News information:
1. Pay attention to the impact of Trump administration tariffs
📈 Technical Analysis:
Possible interest rate cuts and tariffs in the fall continue to stimulate risk aversion. Currently, the 3300-3285-3310 points form a head and shoulders bottom pattern. The bullish momentum is relatively strong in the short term. Our short trade near 41 has hit the stop loss. As I wrote before, gold may continue to rise to 3360 or 3365 after breaking through 3350. The current RSI indicator is seriously oversold, so be cautious when operating in a unilateral trend in the short term. The safe way is to wait for a pullback to 3345-3340 to go long
🎯 Trading Points:
BUY 3345-3340
TP 3360-3370-3400
In addition to investment, life also includes poetry, distant places, and Allen. Facing the market is actually facing yourself, correcting your shortcomings, facing your mistakes, and exercising strict self-discipline. I share free trading strategies and analysis ideas every day for reference by brothers. I hope my analysis can help you.
TVC:GOLD FXOPEN:XAUUSD
Bulls rise, beware of Friday's black swan📰 News information:
1. Pay attention to the impact of Trump administration tariffs
📈 Technical Analysis:
Gold rose as expected and touched around 3344, which was in line with our judgment last night. However, from the market point of view, the K-line entity did not stand firmly above 3335. There are only two possible scenarios for the subsequent trend of gold. One is to stand directly above and test the 3345 resistance again, and the other is to fall in the European and American markets due to timeliness and retest the key support of 3310. At present, the upper positions are 3345 and 3365 respectively. If 3345 is repeatedly not broken and the European market falls with acceleration, then the 3310 area will still need to take back the long positions, which can be defined as a long wide-range wash. 3330-3320 is a very critical support position, and 3310 is a strong support. Therefore, the best position for shorting during the day is around 3335-3345, with the target at 3330-3320. Consider long positions after falling back and getting support here.
🎯 Trading Points:
SELL 3335-3345
TP 3330-3320
BUY 3330-3320
TP 3345-3365
In addition to investment, life also includes poetry, distant places, and Allen. Facing the market is actually facing yourself, correcting your shortcomings, facing your mistakes, and exercising strict self-discipline. I share free trading strategies and analysis ideas every day for reference by brothers. I hope my analysis can help you.
OANDA:XAUUSD PEPPERSTONE:XAUUSD FOREXCOM:XAUUSD FX:XAUUSD FXOPEN:XAUUSD TVC:GOLD

SILVER - at cut n reverse area? what's next??#SILVER... market just reached at his resistance of the week and month.
that is around 38.20-25
keep close it and if market hold it then drop expected.
otherwise not
NOTE: we will go for cut n reverse above 38.20-25 on confirmation.
GOOD LUCK
TRADE WISELY

Gold can reach resistance level, break it and continue to riseHello traders, I want share with you my opinion about Gold. Recently, price formed a clean upward wedge pattern and is showing strong bullish behaviour. After bouncing off the support level at 3275, the price entered the buyer zone (3255 - 3275) and reversed with a confident impulse up, signalling renewed interest from buyers. From there, price has consistently respected the support line, printing higher lows and slowly climbing back toward the resistance level at 3410. This level has acted as a significant rejection area before, but this time, the structure looks stronger. Each pull-back has been shallow, and buyers are stepping in faster. The momentum is slowly building. Now the price is trading just below resistance and moving with a bullish trajectory. I expect Gold to continue its climb, first reaching the Resistance Level, and then targeting the seller zone (3410 - 3430). That’s why I’ve set my TP at 3430 points - right inside this upper area where I anticipate profit-taking and potential reversal. Given the bullish pattern structure, the wedge formation, and the strength of recent impulses, I stay bullish and expect further growth in the coming sessions. Please share this idea with your friends and click Boost 🚀
Disclaimer: As part of ThinkMarkets’ Influencer Program, I am sponsored to share and publish their charts in my analysis.

GOLD: Next Move Is Down! Short!
My dear friends,
Today we will analyse GOLD together☺️
The recent price action suggests a shift in mid-term momentum. A break below the current local range around 3,358.00 will confirm the new direction downwards with the target being the next key level of 3,349.30.and a reconvened placement of a stop-loss beyond the range.
❤️Sending you lots of Love and Hugs❤️

Silver: Daily Reversal Possible at Supply ZoneI'm anticipating a potential daily reversal in silver prices. Retail traders are maintaining a bullish stance, while commercial traders remain heavily short. The current price action suggests a possible reaction to a key supply area. What are your thoughts on the likelihood of a reversal, and what technical indicators might support or refute this potential shift?
✅ Please share your thoughts about SI1! in the comments section below and HIT LIKE if you appreciate my analysis. Don't forget to FOLLOW ME; you will help us a lot with this small contribution.

GOLD - SHORT TO $2,800 (UPDATE)I would like to see the 4H candle close strongly ABOVE this current resistance zone & turn it into support, before I can confidently say it'll shoot up to $3,400 next. For all we know, price might reject this resistance again & shoot back down, but that is looking unlikely right now.
Let's see how the weekly candle closes tonight.

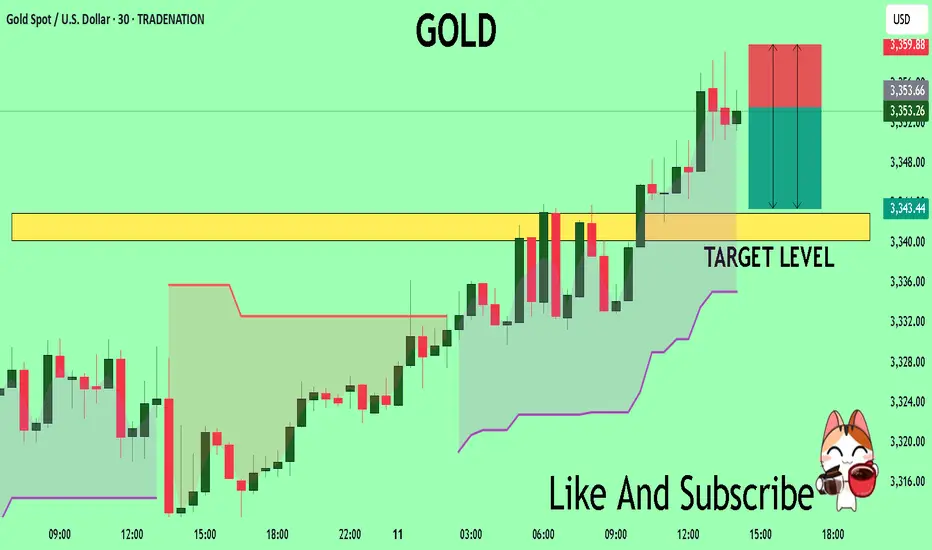
GOLD Massive Short! SELL!
My dear friends,
My technical analysis for GOLD is below:
The market is trading on 3353.5 pivot level.
Bias - Bearish
Technical Indicators: Both Super Trend & Pivot HL indicate a highly probable Bearish continuation.
Target - 3343.00
Recommended Stop Loss - 3359.88
About Used Indicators:
A pivot point is a technical analysis indicator, or calculations, used to determine the overall trend of the market over different time frames.
Disclosure: I am part of Trade Nation's Influencer program and receive a monthly fee for using their TradingView charts in my analysis.
———————————
WISH YOU ALL LUCK
Copper Holds Above 14-Year ResistanceFrom a monthly time frame perspective, copper has broken above a major resistance zone defined by consecutive highs dating back to 2011.
The breakout above $5.40 marks a significant technical milestone. A clean move above the $5.87 high could open the door for further upside, potentially targeting $7.00 and beyond as bullish momentum continues to build.
On the downside, if copper fails to hold this breakout and closes back below the 14-year trendline, support may be retested near the $4.60 and $4.20 levels.
- Razan Hilal, CMT

Silver Traces New Highs Last Seen in 2011As silver traces new 2025 records, surpassing 2012 highs above 37.50/ounce, it aligns further with the target of the inverted head and shoulders pattern that has extended on the chart between 2020 and 2024, within the 38–39 price zone.
This aligns with overbought momentum from the perspective of the monthly RSI, at levels last seen in 2020, strengthening the case for a potential pullback to recharge momentum—possibly back toward levels 35, or 32 and 29 in a steeper scenario.
Should the price trend hold above the 39-price zone, further gains can be forecasted toward 42, 46, and eventually the 50 high, in line with tech advancement.
- Razan Hilal, CMT

THE LONG SHOT 〉POTENTIAL OUTLOOKAs illustrated, I'm trying to visualize how a potential continuation impulse could look like during " Bullish July " and toward the end of the year (depending on how aggressive buyers step in; specially central banks and institutions).
As you can see on this Daily chart, price respected a long term trend line + is forming higher lows, funneling into a shorter and shorter range of accumulation.
This is a very strong bullish behavior; when price gets tighter and tighter respecting a resistance level, but making higher lows. It tends to indicate that price is accumulating and "loading" (sort of speak).
Now, analyzing gold from the fundamental aspect, one MUST align those factors with price. In other words: DOES IT MAKE SENSE TO BE BULLISH OR "THINK" PRICE COULD RISE?
Well, ask yourself and do the research on the following (but not limited to) questions:
1. How is the US dollar doing? (Since it is the world's "reserve" currency)
2. Are the interest rates in the USA favoring the economy?
3. How is the world economy as a whole doing?
- inflation in the top world powers and important economies?
4. How is international trade policy looking like for the world?
- Positive or negative? Are countries happy with each other currently, trading without any issues? (Or maybe... there's a tariff war and a trade war goin on?...)
5. Politically speaking, is the general public UNITED or POLARIZED? (politics is a key fundamental aspect for the price of gold, as it either adds to uncertainty and tensions, or it calms things down).
6. Geopolitically speaking (and most importantly); is the "conflict" (war) ending, getting better, resolving? ...
7. Where is the money going and flowing? Black rock, vanguard, and other top hedge funds; where are they investing their money? ( because central banks keep BUYING gold... )
Those are some of many many questions one must study and understand, in order to align the technical aspects of the price of the yellow metal.
If any question/factor DOES NOT POINT to bullishness in price, then the technical and price projection of any analysis starts to have weakness.
On the other hand, if the fundamental factors and questions in play INDEED POINT toward an uncertain situation, adding bullishness to the price, any analysis and bullish projection simply has those aspects to its favor.
--
GOOD LUCK!
persaxu

IMPORTANT BREAKOUT 〉BULLS ARE BACKAs illustrated, price has broken out of an important 4H and 1D trend line that had kept price bearish since the beginning of the month.
Yesterday, gold made its way to a ket resistance level and broke it, CLOSING above it in the 4H timeframe, which is a key sign that bulls are back.
An interesting sign is that price bounced from the 61.8 - 67% retracement of the last bullish impulse that had an extended correction.
Should price manage to stay above 3250-3300 next week, , (a very strong psychological and algorithmic price range), the path to a new ATH is well opened and the probabilities arise on its favor.
I try to visualize a potential buy area shown in green, and the invalidation of this idea would be the level from which price has bounced.
--
I have been bullish on gold since 2023, ignoring any correction to be a "bearish market" and rather accumulation phases of longer term potential for growth.
The world economy and geopolitical conflict along many other financial macroeconomic data and circumstances, are simply NOT pointing toward a better future, and gold is screaming so by continuing to rise, and central banks back this up by continuing to buy it physically.
--
GOOD LUCK
