XAUUSD Outlook: How Risk Sentiment Could Shape the Next MoveI’m currently analysing XAUUSD (Gold) 🟡, which has come under bearish pressure 📉, showing signs of downside momentum. In the video 🎥, we also explore the inverse correlation between Gold and risk assets like the NASDAQ 📊.
Keep a close eye on NASDAQ movements—if risk assets break bullish 🚀, we may see further weakness in Gold. On the other hand, if risk sentiment shifts and risk assets break bearish 🛑, Gold could attract safe-haven demand and gain strength 💪.
We also dive into the price action, market structure, and pull up the volume profile 🧩. Gold is currently trading around the Point of Control (POC) ⚖️—a key level where significant volume has accumulated. A clean break above or below this area could act as a technical trigger for the next move 📈📉.
As always, this is not financial advice ⚠️—just my market view.
Metals

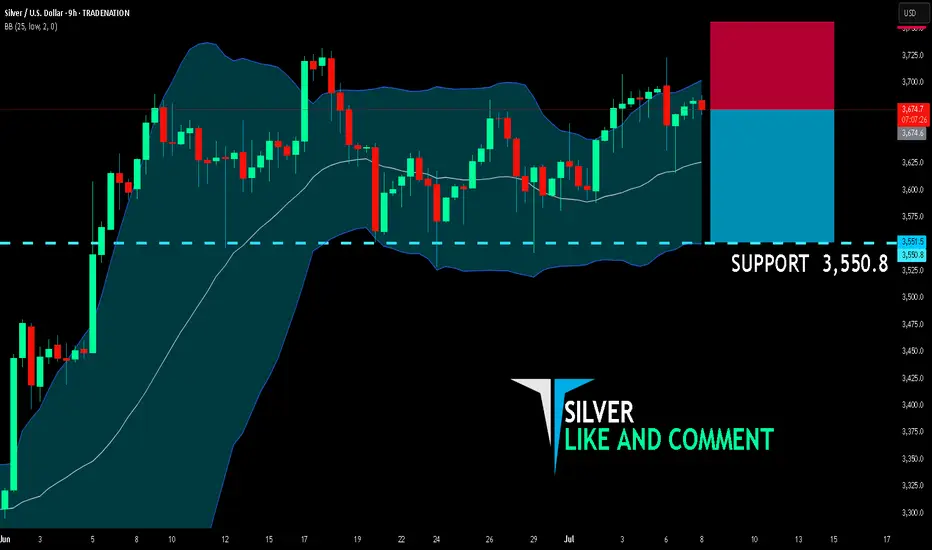
SILVER SENDS CLEAR BEARISH SIGNALS|SHORT
SILVER SIGNAL
Trade Direction: short
Entry Level: 3,674.6
Target Level: 3,550.8
Stop Loss: 3,756.2
RISK PROFILE
Risk level: medium
Suggested risk: 1%
Timeframe: 9h
Disclosure: I am part of Trade Nation's Influencer program and receive a monthly fee for using their TradingView charts in my analysis.
✅LIKE AND COMMENT MY IDEAS✅
XAUUSD: Market Analysis and Strategy for July 8Gold technical analysis
Daily chart resistance 3360, support below 3284
Four-hour chart resistance 3350, support below 3300
One-hour chart resistance 3344, support below 3314
Analysis of gold news: Last week, as the market continued to increase its bets on the Fed's dovish stance, gold rose steadily after rebounding from a major trend line. However, after the release of the stronger-than-expected US non-farm payrolls report (NFP), market expectations for interest rates turned hawkish again, and the gold rally reversed. This week, the focus will be on the Fed's minutes and the expiration of the tariff exemption on July 9, and whether it will send a signal of possible interest rate cuts in the future. Is it an extension of the tariff exemption agreement or a return to the tariff rate when the tariff took effect on April 2. To judge the further direction of the market. If the minutes are dovish, it means that policymakers are cautious about the economic outlook, the US dollar may face correction pressure, and gold prices will be supported to rebound and strengthen. On the contrary, if the need to maintain high interest rates is emphasized, it is expected to boost the strength of the US dollar and suppress the decline in gold prices. However, it is not expected to change the trend of gold prices in the near and short term.
Gold operation suggestions: From the current trend analysis, the support below focuses on the four-hour level near 3314, and the upper pressure focuses on the 3339-3350 range. The short-term long and short strength dividing line is 3314. If the four-hour level stabilizes above this position, continue to buy at a low level.
Buy: 3314near SL: 3309
Buy: 3350near SL: 3345

GOLD → Correction for confirmation before growthFX:XAUUSD is recovering due to increased demand as a safe-haven asset. After breaking through local trend resistance, an upward channel is beginning to form on the chart.
On Monday, gold tested the 3295-3300 zone (liquidity zone) and, against the backdrop of incoming economic data, is buying back the decline, forming a rather interesting pattern that could lead to continued growth, but there is a but!
Investors are reacting to President Trump's threats to impose tariffs on imports from a dozen countries starting August 1. In addition, the main question is the Fed's interest rate decision. The regulator is likely to leave the rate unchanged due to inflation risks.
Uncertainty surrounding tariffs is supporting interest in gold as a safe-haven asset. The market is awaiting further news and the publication of the Fed minutes on Wednesday.
Resistance levels: 3345, 3357, 3396
Support levels: 3320, 3311, 3295
A correction to support is forming. If the bulls hold their ground within the upward channel and above the key areas of interest, the focus will shift to 3345, a resistance level that could hold the market back from a possible rise. A breakout of this zone would trigger a rise to 3357-3396.
Best regards, R. Linda!

Gold H1 | Approaching an overlap resistanceGold (XAU/USD) is rising towards an overlap resistance and could potentially reverse off this level to drop lower.
Sell entry is at 3,344.65 which is an overlap resistance.
Stop loss is at 3,368.00 which is a level that sits above a swing-high resistance.
Take profit is at 3,313.35 which is a pullback support.
High Risk Investment Warning
Trading Forex/CFDs on margin carries a high level of risk and may not be suitable for all investors. Leverage can work against you.
Stratos Markets Limited (tradu.com ):
CFDs are complex instruments and come with a high risk of losing money rapidly due to leverage. 63% of retail investor accounts lose money when trading CFDs with this provider. You should consider whether you understand how CFDs work and whether you can afford to take the high risk of losing your money.
Stratos Europe Ltd (tradu.com ):
CFDs are complex instruments and come with a high risk of losing money rapidly due to leverage. 63% of retail investor accounts lose money when trading CFDs with this provider. You should consider whether you understand how CFDs work and whether you can afford to take the high risk of losing your money.
Stratos Global LLC (tradu.com ):
Losses can exceed deposits.
Please be advised that the information presented on TradingView is provided to Tradu (‘Company’, ‘we’) by a third-party provider (‘TFA Global Pte Ltd’). Please be reminded that you are solely responsible for the trading decisions on your account. There is a very high degree of risk involved in trading. Any information and/or content is intended entirely for research, educational and informational purposes only and does not constitute investment or consultation advice or investment strategy. The information is not tailored to the investment needs of any specific person and therefore does not involve a consideration of any of the investment objectives, financial situation or needs of any viewer that may receive it. Kindly also note that past performance is not a reliable indicator of future results. Actual results may differ materially from those anticipated in forward-looking or past performance statements. We assume no liability as to the accuracy or completeness of any of the information and/or content provided herein and the Company cannot be held responsible for any omission, mistake nor for any loss or damage including without limitation to any loss of profit which may arise from reliance on any information supplied by TFA Global Pte Ltd.
The speaker(s) is neither an employee, agent nor representative of Tradu and is therefore acting independently. The opinions given are their own, constitute general market commentary, and do not constitute the opinion or advice of Tradu or any form of personal or investment advice. Tradu neither endorses nor guarantees offerings of third-party speakers, nor is Tradu responsible for the content, veracity or opinions of third-party speakers, presenters or participants.

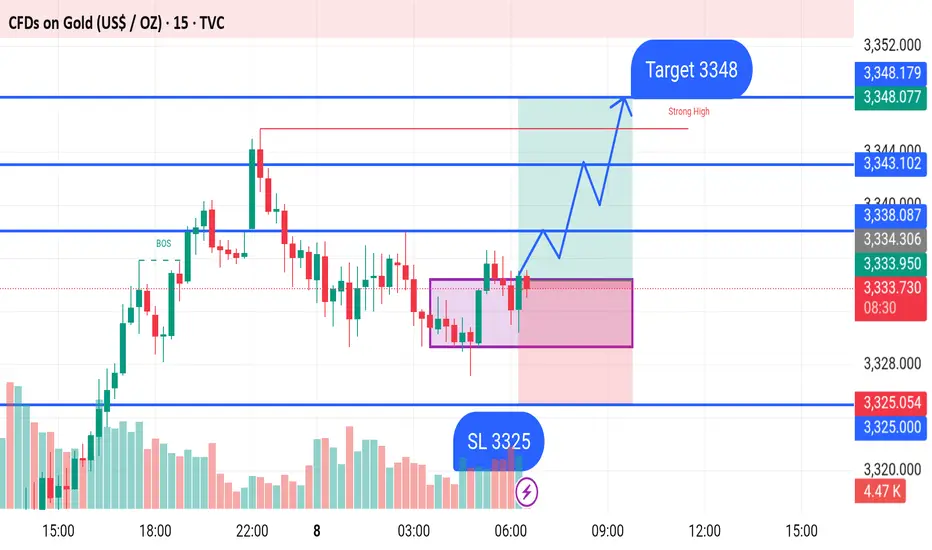
GOLD BUY M15 Gold (XAU/USD) Trade Setup – 15-Min Chart (July 8, 2025)
Entry Zone: Price is currently consolidating in a marked demand zone, forming a potential bullish setup.
Support Level (SL): 3325 – This is the stop-loss level, placed just below the support zone to minimize risk.
Buy Zone: Price is expected to rise from the current level after breaking out of the consolidation box (purple zone).
Bullish Structure: Price is forming higher lows and appears to be preparing for a breakout to the upside.
Target: 3348 – This is the marked resistance level and take-profit target, just below the "Strong High" area.
Key Levels:
Support: 3325
Current Price: Around 3334
Resistance Zones: 3343, 3348
Summary:
A bullish move is anticipated from the current price level, with an entry near 3334 targeting 3348. Stop-loss is placed at 3325 to protect against downside risk. Break of the immediate resistance could trigger upward momentum toward the target.

Is gold set to shine again as an inflation hedge?
Tariff tensions are flaring once more ahead of the scheduled end to mutual tariff suspensions. President Trump has announced that tariff rates on countries such as South Korea and Japan will increase to 25% starting in August.
This renewed threat has stoked concerns about inflation, pushing up Treasury yields. As trade war risks resurface, US Treasury prices have fallen—a move consistent with market expectations of front-loaded inflation driven by higher tariffs.
Adding to the pressure, Trump’s newly signed tax cut bill is expected to widen the fiscal deficit by $3.3 trillion over the next decade, according to the Congressional Budget Office (CBO).
XAUUSD is consolidating within a narrow range of 3320–3350. The price is hovering near both EMAs, awaiting an apparent trigger for a breakout. If XAUUSD breaks below the support at 3320, the price may retreat to 3300. Conversely, if XAUUSD breaches above the resistance at 3350, the price could extend its gains toward 3370.

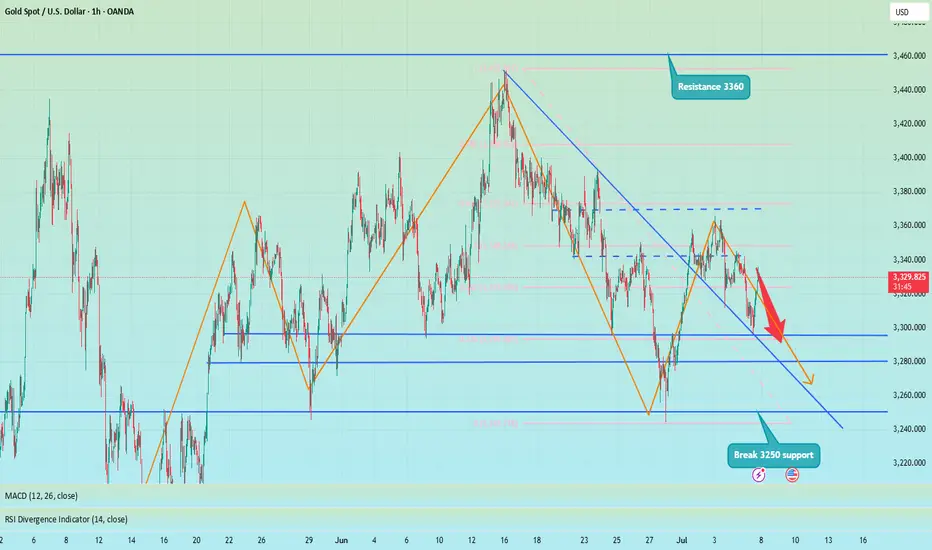
Shorts trapped? No, the head and shoulders top is still downOver the weekend, I gave a trading strategy for going long at 3315-3305. Today, I updated and optimized the long order trading, maintained the high-short-low-long trading strategy, and began to rebound near the 3300 line, and successfully touched the long TP 3333. At present, I am executing short trades again according to the trading strategy and holding short orders.
Although gold has only retreated to around 3330, I am not worried about losses and failures in short trades. As I wrote in today's post, the daily K-line chart has a head and shoulders top pattern. As long as the bulls fail to recover 3360, it is still a short trend. Therefore, in the short term, I still think that the rebound is a good opportunity for us to go short.
At present, the short-term bullish momentum of gold has been consumed and the downward trend continues. Therefore, I still insist on holding short orders in the short term.
In addition to investment, life also includes poetry, distant places, and Allen. Facing the market is actually facing yourself, correcting your shortcomings, facing your mistakes, and being strict with yourself. I share free trading strategies and analysis ideas every day for reference by brothers. I hope my analysis can help you.
FXOPEN:XAUUSD PEPPERSTONE:XAUUSD FOREXCOM:XAUUSD FX:XAUUSD FXOPEN:XAUUSD OANDA:XAUUSD TVC:GOLD
Gold sell off before continuation higher? Pending order set on this one before bed
Will see what develops overnight

Gold will continue with its bullish breakoutLooking for new highs to be made. Price has pushed bullish as trump started talking about the tariffs early today. Even though they are not supposed to discuss till the 9th. We can get a early move for the week. Monitoring the price action to see if I can get in where I fit in!

GOLD RESISTANCE AHEAD|SHORT|
✅GOLD is going up now
But a strong resistance level is ahead at 3360$
Thus I am expecting a pullback
And a move down towards the target of 3325$
SHORT🔥
✅Like and subscribe to never miss a new idea!✅
Disclosure: I am part of Trade Nation's Influencer program and receive a monthly fee for using their TradingView charts in my analysis.

Following Price Flow to the Next TargetPrice swept liquidity below the previous day’s low and then powered back up, breaking structure to the upside. Now it’s sitting above the 50 EMA, moving through fair value gaps left by the rally. I’m watching for a possible pullback into the FVG zone near the EMA. If that level holds, price could look to reach for the liquidity above around 3,365.
But here’s what matters most. Even if this ends up being a losing trade, I’d rather take that loss knowing I stuck to my plan than catch a random win by breaking my rules. Because long-term, winning trades that come from impulse actually set you up for future damage. They teach bad habits.
Losses that happen inside your system? Those are simply the cost of doing business. They protect your discipline and keep your edge intact. Over time, that’s exactly what allows you to stay in the game and grow your account.

XAUUSD Sniper Outlook – July 7, 2025"Structure over noise. Patience is power. Welcome back to the battlefield."
👋 Hey traders!
After a low-volume week due to the US Independence Day holiday, we now re-enter the battlefield with structure tightening under major resistance — and with Fed commentary on the radar.
No CPI. No NFP. But don't sleep on the setups — liquidity is quietly shifting.
🧭 Here’s what we’ve got ahead:
🔔 Key Events – July 8–12:
🟡 Monday–Tuesday: BRICS Summit (geo/political exposure)
🔵 Wednesday: FOMC Minutes – potential policy clues
🔴 Thursday: Unemployment Claims + Fed speakers (Muserlian, Waller)
⚪ Friday: Federal Budget Balance
We’re likely entering a reactive environment — fueled by internal structure shifts, not major macro catalysts. Perfect for smart money setups.
🧠 HTF Structure & Bias
🔹 Daily Bias:
Price remains capped under the key daily supply 3344–3351, which rejected cleanly before the holiday. Unless that flips into support, bias remains neutral to bearish.
EMAs 5/21 are curling sideways. RSI is flattening, and structure shows fading momentum.
🔹 H4 Bias:
We’re consolidating below a CHoCH + LH series, inside premium territory. The rejection from 3344 was precise, and unless broken, pressure favors the downside.
Price is rotating between the H4 EQ and the 3325–3332 intraday OB. Momentum is slowing — watch for re-accumulation or rejection depending on reaction at key zones.
🔴 Supply Zones (Sell Scenarios)
1. 3344 – 3351
This is the Daily + H4 supply from last week. EMA alignment + FVG + liquidity sweep confluence.
Perfect sniper rejection area if price trades up and stalls. Look for M15/M30 CHoCH confirmations.
2. 3380 – 3394
Untouched H1-H4 OB in premium. Not related to CPI/NFP — just pure inducement wick potential from above. If tapped after midweek liquidity push (e.g. FOMC Minutes), watch for overreaction entries.
🟢 Demand Zones (Buy Scenarios)
1. 3325 – 3332
Last week’s discount reaction zone. H1 OB + internal CHoCH zone. If swept and protected by bullish PA (M15 BOS), this becomes the best R/R long back into 3344.
Already tested Friday, but still holds weight for Monday.
2. 3286 – 3272
H4 OB + daily demand + RSI oversold zone.
If we get a full breakdown early week, expect this area to act as a reaccumulation pocket for bulls — but only with confirmation.
⚔️ Decision Zone – 3299 – 3305
This is the weekly flip area.
If bulls defend 3305 → bullish short-term bias returns.
If 3299 fails → downside continues into 3280s.
🧠 Summary & Gameplan
🧷 No CPI. No NFP. That means cleaner technical moves — no fake news spikes, just pure structure.
Expect Monday to be reactionary (post-holiday), and Wednesday–Thursday to bring intraday setups post-FOMC minutes.
✅ If price is in premium, watch for bearish rejections at 3344/3380.
✅ If price dips into discount, wait for confirmation longs at 3325 or 3286.
✅ Stay patient in mid-range. Don’t force trades inside chop zones.
🧲 If this gave you real clarity — don’t just scroll on.
Hit the ❤️ button, smash Follow, and tell us in the comments:
👉 Which zone do you trust more — the 3325 reentry or the 3380 inducement trap?
Let the gold tribe know 👇
—
📢 Disclosure:
This analysis is based on the Trade Nation TradingView feed. I’m part of their Influencer Program and receive a monthly fee.
⚠️ Educational content only — not financial advice.
— GoldFxMinds 💛
Patience | Discipline | Fearless Execution

90-day tariffs expire, how to position gold next week📰 News information:
1. 90-day tariffs are about to expire
📈 Technical Analysis:
With the Trump administration's massive tax cut and spending bill officially implemented, the U.S. Treasury may start a "supply flood" of short-term Treasury bonds to make up for the trillions of dollars in fiscal deficits in the future. Concerns about the oversupply of short-term Treasury bonds have been directly reflected in prices. The yield of 1-month short-term Treasury bonds has risen significantly since Monday this week. Slowing wage growth, falling total work hours, stagnant wage income growth and concerns about consumer spending are all signs that support gold.
From a technical perspective, Friday's closing long shadow small candle body, the price closed at a high of 3345 and a low of 3224. The overall idea for next week is to follow the trend and rely on the first short-term support of 3323 below to participate in long positions. Secondly, 3315-3305 is given below. If the support point is lost, then 3300 below is also in danger, and there is no need to overly insist on continuing to do more at low levels in the short-term rhythm. The key pressure above is 3340-3350, and the limit is the pressure of 3360 above.
🎯 Trading Points:
BUY 3325-3323
TP 3333-3340-3350
BUY 3315-3305
TP 3325-3333-3340
In addition to investment, life also includes poetry, distant places, and Allen. Facing the market is actually facing yourself, correcting your shortcomings, confronting your mistakes, and strictly disciplining yourself. I hope my analysis can help you🌐.
FXOPEN:XAUUSD PEPPERSTONE:XAUUSD FOREXCOM:XAUUSD FX:XAUUSD OANDA:XAUUSD TVC:GOLD

XAUUSD is getting ready to explode to $4000Gold (XAUUSD) is trading around its 1D MA50 (blue trend-line) having practically been accumulating since the April 22 High. Ever since the 1D MA100 (green trend-line) turned into a long-term Support (2023), Gold has experienced similar Accumulation Phases another 3 times.
On all of those occasions, the price broke out to the upside in the form of a Channel Up, reaching at least the 2.5 Fibonacci extension.
With the 1D MACD close to forming a Bullish Cross around the 0.0 mark, which is the level that always started the Channel Up during those 3 previous Accumulation Phases, we expect the market to start breaking upwards and towards the end of the year hit at least $4000.
-------------------------------------------------------------------------------
** Please LIKE 👍, FOLLOW ✅, SHARE 🙌 and COMMENT ✍ if you enjoy this idea! Also share your ideas and charts in the comments section below! This is best way to keep it relevant, support us, keep the content here free and allow the idea to reach as many people as possible. **
-------------------------------------------------------------------------------
💸💸💸💸💸💸
👇 👇 👇 👇 👇 👇

Gold fluctuates, beware of rebound caused by new tariffs📊 Gold Day Trading Strategy (Recommendation index ⭐️⭐️⭐️⭐️⭐️)
📰 News information:
1. 90-day tariffs are about to expire
2. New unilateral tariffs
3. Geopolitical situation
📈 Technical Analysis:
As I said this morning, shorting gold is divided into two times, the first time is near 3324, and the second time is at 3340 or 3345. If there is a short-term retracement after breaking through 24, you can follow up with a long order to look at 3335-3340. If gold is in a very weak state, you can consider shorting near 3315 and look at 3300. Because during the European session, 3300 has strong support, and the European session repeatedly tests this support. If it falls below 3300, we will go to 3295-3285, or even 3250. But at the same time, we need to pay attention to the rebound of gold that may be caused by tariff policies and geopolitical situations.
🎯 Trading Points:
SELL 3315-3325-3335
TP 3305-3295-3285
BUY 3290-3285
TP 3300-3310-3320
In addition to investment, life also includes poetry, distant places, and Allen. Facing the market is actually facing yourself, correcting your shortcomings, facing your mistakes, and being strict with yourself. I share free trading strategies and analysis ideas every day for reference by brothers. I hope my analysis can help you.
TVC:GOLD OANDA:XAUUSD FX:XAUUSD FOREXCOM:XAUUSD PEPPERSTONE:XAUUSD FXOPEN:XAUUSD

GOLD ROUTE MAP UPDATEHey Everyone,
Great start to the week with our levels being respected inline with our plans to buy dips.
We started the week with our bearish target 3330 being hit followed with ema5 cross and lock opening 3306 inline with the retracement range. This was hit perfectly completing the retracement range, followed with the weighted level bounce now heading towards 3330.
We still have the market opening bullish gap left at 3358 and will need a challenge and ema5 lock above 3330 to re-confirm this again.
We will keep the above in mind when taking buys from dips. Our updated levels and weighted levels will allow us to track the movement down and then catch bounces up.
We will continue to buy dips using our support levels taking 20 to 40 pips. As stated before each of our level structures give 20 to 40 pip bounces, which is enough for a nice entry and exit. If you back test the levels we shared every week for the past 24 months, you can see how effectively they were used to trade with or against short/mid term swings and trends.
The swing range give bigger bounces then our weighted levels that's the difference between weighted levels and swing ranges.
BULLISH TARGET
3358
EMA5 CROSS AND LOCK ABOVE 3358 WILL OPEN THE FOLLOWING BULLISH TARGETS
3389
EMA5 CROSS AND LOCK ABOVE 3389 WILL OPEN THE FOLLOWING BULLISH TARGET
3416
EMA5 CROSS AND LOCK ABOVE 3416 WILL OPEN THE FOLLOWING BULLISH TARGET
3439
BEARISH TARGETS
3330 - DONE
EMA5 CROSS AND LOCK BELOW 3330 WILL OPEN THE FOLLOWING BEARISH TARGET
3306 - DONE
EMA5 CROSS AND LOCK BELOW 3306 WILL OPEN THE SWING RANGE
3283
3254
As always, we will keep you all updated with regular updates throughout the week and how we manage the active ideas and setups. Thank you all for your likes, comments and follows, we really appreciate it!
Mr Gold
GoldViewFX

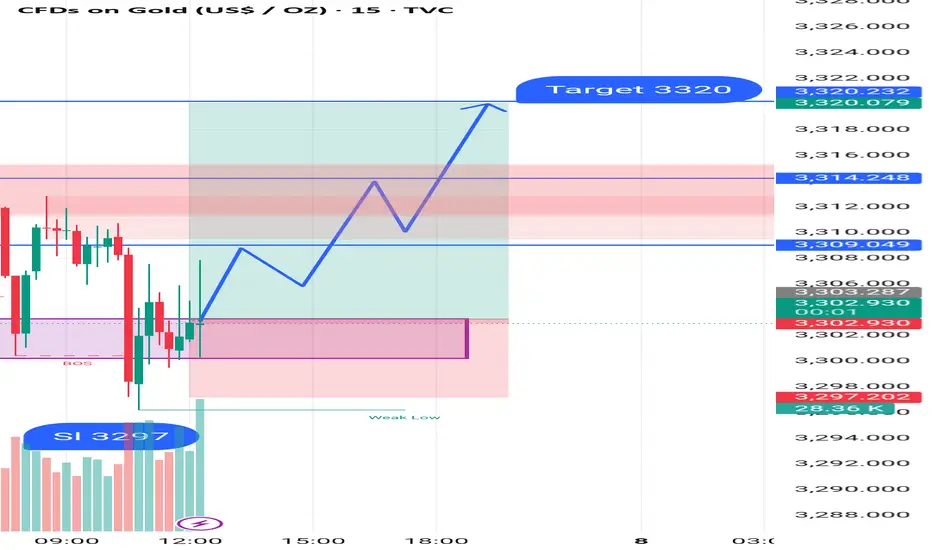
GOLD BUY M15 Gold (XAU/USD) Analysis – 15-Minute Chart
The price is currently showing signs of bullish momentum after forming a Break of Structure (BOS) around the 3297 level, which is also marked as the Stop Loss (SL) area.
After retesting the demand zone (highlighted in purple), the price has started to push upwards, suggesting a potential reversal. A bullish price path is projected, with expectations of higher highs.
Key Levels:
Entry Zone (Support): Around 3297 (SL zone)
Resistance Zones:
First Resistance: 3309
Second Resistance: 3314
Final Target: 3320
If the bullish momentum continues, the price is expected to break above the minor resistance levels and reach the target of 3320.
SILVER: Will Go Up! Long!
My dear friends,
Today we will analyse SILVER together☺️
The in-trend continuation seems likely as the current long-term trend appears to be strong, and price is holding above a key level of 36.696 So a bullish continuation seems plausible, targeting the next high. We should enter on confirmation, and place a stop-loss beyond the recent swing level.
❤️Sending you lots of Love and Hugs❤️

GOLD: Strong Bullish Sentiment! Long!
My dear friends,
Today we will analyse GOLD together☺️
The price is near a wide key level
and the pair is approaching a significant decision level of 3,317.31 Therefore, a strong bullish reaction here could determine the next move up.We will watch for a confirmation candle, and then target the next key level of 3,309.44.Recommend Stop-loss is beyond the current level.
❤️Sending you lots of Love and Hugs❤️

GOLD The Target Is DOWN! SELL!
My dear friends,
Please, find my technical outlook for GOLD below:
The price is coiling around a solid key level - 3316.4
Bias - Bearish
Technical Indicators: Pivot Points Low anticipates a potential price reversal.
Super trend shows a clear sell, giving a perfect indicators' convergence.
Goal - 3307.9
Safe Stop Loss - 3320.5
About Used Indicators:
The pivot point itself is simply the average of the high, low and closing prices from the previous trading day.
Disclosure: I am part of Trade Nation's Influencer program and receive a monthly fee for using their TradingView charts in my analysis.
———————————
WISH YOU ALL LUCK
/////////////////////////

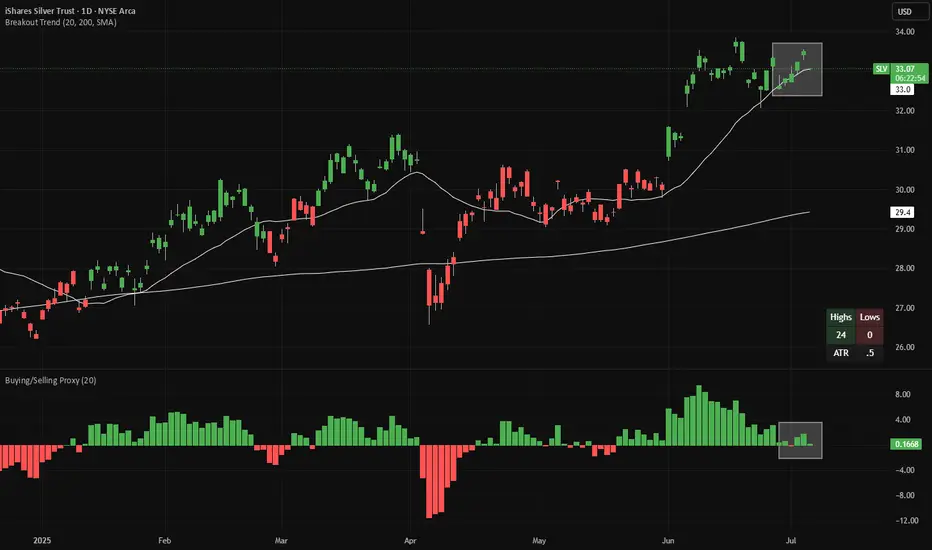
Long Silver - Buy the DipSilver is making 20-day highs (green candles in the main chart), while pulling back towards the 20D EMA line. Meanwhile, looking at a proxy of net buying/selling (bottom panel), we are almost at net selling levels.
There is good risk/reward to buy silver here, with a stop-loss if the price closes at a 20-day low. If a 20-day low is made, the candles will change color from green to red.
Both indicators (Breakout Trend and Buying/Selling Proxy) are available for free on TradingView.