SILVER: Local Bearish Bias! Short!
My dear friends,
Today we will analyse SILVER together☺️
The in-trend continuation seems likely as the current long-term trend appears to be strong, and price is holding below a key level of 36.897 So a bearish continuation seems plausible, targeting the next low. We should enter on confirmation, and place a stop-loss beyond the recent swing level.
❤️Sending you lots of Love and Hugs❤️
Metals

Gold Holds Above 3342 Ahead of Key U.S Data –Bullish Bias IntactGold Rises as Market Awaits Key U.S. Economic Data
Gold prices are pushing higher as investors position ahead of today’s major U.S. economic releases, including NFP and unemployment figures. Expectations of weaker data are supporting bullish sentiment.
Technical Outlook (XAU/USD):
Gold maintains a bullish structure as long as it trades above 3,342.
→ A push toward 3,365 is likely
→ A 1H close above 3,365 would open the path toward 3,375
However, if price closes below 3,342 on the 1H chart, bearish momentum may build, targeting 3,331 and 3,320
Key Levels:
• Resistance: 3,365 / 3,375 / 3,390
• Support: 3,341 / 3,331 / 3,320

SHORT ON SILVER XAG/USDSilver has built lots of sell side liquidity since June 10 and should now be ready to sweep it.
I will be selling silver to the next demand level.

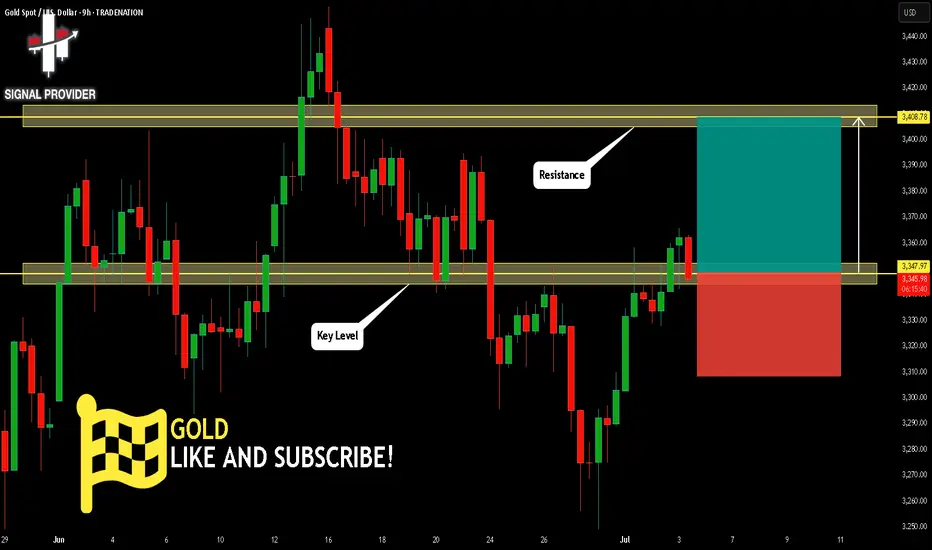
GOLD Will Move Higher! Long!
Here is our detailed technical review for GOLD.
Time Frame: 9h
Current Trend: Bullish
Sentiment: Oversold (based on 7-period RSI)
Forecast: Bullish
The market is approaching a significant support area 3,347.97.
The underlined horizontal cluster clearly indicates a highly probable bullish movement with target 3,408.78 level.
P.S
The term oversold refers to a condition where an asset has traded lower in price and has the potential for a price bounce.
Overbought refers to market scenarios where the instrument is traded considerably higher than its fair value. Overvaluation is caused by market sentiments when there is positive news.
Disclosure: I am part of Trade Nation's Influencer program and receive a monthly fee for using their TradingView charts in my analysis.
Like and subscribe and comment my ideas if you enjoy them!
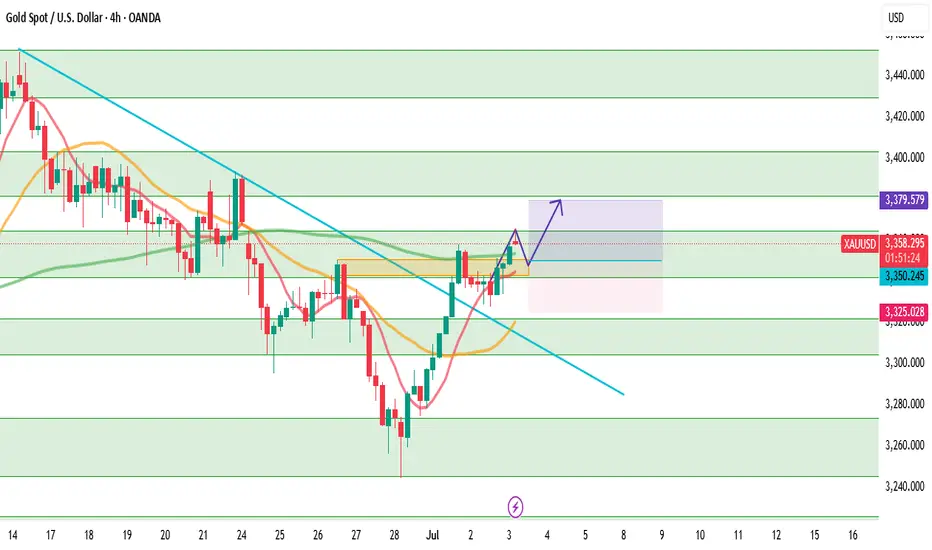
DeGRAM | GOLD retest of the resistance line📊 Technical Analysis
● Price holds above the broken blue resistance line, now acting as support near 3 347, while an inner up-sloper is guiding a stair of higher lows inside the new grey channel.
● The confluence of channel mid-line and 3 355 swing high is the gate; its clearance activates an equal-width objective at 3 380, with the outer rail / former consolidation lid at 3 425 next.
💡 Fundamental Analysis
● Easing US ISM-services prices trimmed real 2-yr yields and the dollar, while latest WGC data show June net central-bank purchases rising for a third month, reviving dip-buying in gold.
✨ Summary
Long 3 345–3 355; hold above 3 355 targets 3 380 → 3 425. Invalidate on an H1 close below 3 320.
-------------------
Share your opinion in the comments and support the idea with a like. Thanks for your support!

Gold Breakout Retest – Will PRZ Trigger the Next Rally?Gold ( OANDA:XAUUSD ) attacked the Resistance lines and Resistance zone($3,350-$3,326) as I expected in yesterday's idea .
Gold seems to have broken the Resistance zone($3,350-$3,326) and Resistance lines and is pulling back to this zone.
In terms of Elliott Wave theory , Gold appears to have completed wave 3 and is currently completing wave 4 .
I expect Gold to have a chance to rise back to the Resistance zone($3,394-$3,366) after entering the Potential Reversal Zone(PRZ) .
Note: Stop Loss (SL) = $3,297=Worst SL
Gold Analyze (XAUUSD), 1-hour time frame.
Be sure to follow the updated ideas.
Do not forget to put a Stop loss for your positions (For every position you want to open).
Please follow your strategy; this is just my idea, and I will gladly see your ideas in this post.
Please do not forget the ✅ ' like ' ✅ button 🙏😊 & Share it with your friends; thanks, and Trade safe.

GOLD → Attempt to consolidate above 3350 for growth to 3400FX:XAUUSD , after retesting resistance at 3347, is breaking through the key level, while bulls are trying to hold their ground above support. There is potential for growth to 3400.
Gold retreated from its weekly high of $3366 ahead of key US employment data (NFP), which could set a new direction for the movement. But technically, this looks like a correction to consolidate above the level before continuing to rise. After three days of growth, the price faced selling amid a recovery in the dollar and profit-taking. Weak employment data (especially below 100,000) could reinforce expectations of a Fed rate cut as early as July and support gold. Conversely, a strong report will strengthen the dollar and put pressure on the metal. The market is bracing for high volatility
Resistance levels: 3363, 3393, 3400
Support levels: 3347, 3336, 3311
The price has entered a new range of 3345-3400. Consolidation is forming above the support level before a possible rise. I do not rule out another retest of 3345-3336 (liquidity zone) before realization and a rally to 3400.
Best regards, R. Linda!

Gold Market Update: Stuck in summer time range / SeasonalityGold is stuck so far last 4-6 weeks in tight range trading conditions
due to summer time seasonality also strong gains previously
expecting range locked conditions in July as well here's an
overview of 5 years and 10 years of seasonality data by month
until at least August expecting dead market conditions it's best
to focus on trading the range or trading with automated algo instead.
Here are the two tables showing month-over-month percent changes in gold prices (London PM fix USD/oz) for June, July, and August:
| Year | June Close | July Close | August Close | June % | July % | August % |
| ---- | ---------: | ---------: | -----------: | -----: | ------: | -------: |
| 2023 | 1,942.90 | 1,951.02 | 1,918.70 | –0.04% | +0.42% | –1.68% |
| 2022 | 1,836.57 | 1,732.74 | 1,764.56 | –5.65% | +1.80% | +1.80% |
| 2021 | 1,834.57 | 1,807.84 | 1,785.28 | –1.47% | –1.48% | –1.22% |
| 2020 | 1,761.04\* | 1,771.65\* | 1,968.16\* | +8.66% | +11.19% | +10.99% |
| 2019 | 1,342.66\* | 1,413.39\* | 1,523.00\* | +5.29% | +7.95% | +7.74% |
| 2018 | 1,270.00\* | 1,230.00\* | 1,194.00\* | –1.09% | –3.15% | –3.02% |
| 2017 | 1,257.00\* | 1,243.00\* | 1,280.00\* | +0.72% | –1.10% | +2.93% |
| 2016 | 1,255.00\* | 1,364.00\* | 1,322.00\* | +3.24% | +8.67% | –3.11% |
| 2015 | 1,180.00\* | 1,172.00\* | 1,116.00\* | –2.06% | –0.68% | –4.69% |
| 2014 | 1,320.00\* | 1,311.00\* | 1,312.00\* | –0.65% | –0.68% | +0.08% |
🔍 Summary Highlights
June has been weak more often than not—negative in 6 of the past 10 years.
July shows modest gains overall—positive in 7 of the last 10.
August is the strongest summer month—positive 6 times out of the past 10, with several double-digit y/y gains (like +10.99% in 2020).

Silver Extends Gains to $36.70Silver hovered near $36.70 on Thursday after rising 1.4% in the previous session, supported by easing trade tensions and stronger expectations of Fed rate cuts.
Markets are now watching key US economic releases to see whether silver can sustain its upward momentum.
Resistance is at 37.50, while support holds at 35.40.

Gold Supported by Trade HopesGold traded around $3,360 per ounce on Thursday, supported by news of a US-Vietnam trade deal and ongoing dollar weakness.
The deal, which eases some tariffs on Vietnamese goods, increased hopes for further bilateral agreements. Meanwhile, softer US labor data, ADP figures showed the first payrolls drop in over two years, strengthened the case for Fed easing.
Tensions in the Middle East, with Iran halting cooperation with the UN nuclear agency, added a touch of geopolitical risk.
Resistance is at $3,395, while support holds at $3,330.

Gold trend analysis and layout before NFP data📰 News information:
1. Initial jobless claims and NFP data
2. The final decision of the Federal Reserve
📈 Technical Analysis:
Due to the Independence Day holiday this week, the NFP data was released ahead of schedule today, while the policy differences within the Federal Reserve have brought uncertainty to the market. Judging from the market trend, the 4H level shows that the gold price tested the upper track yesterday and then turned to high-level fluctuations after coming under pressure. In the short term, the structure still has bullish momentum after completing the accumulation of power. Although there was a correction in the US market yesterday, it stopped falling and rebounded near 3335, further confirming the strength. At present, the upper resistance in the European session is at 3365-3375, and the short-term support is at 3345-3335 below. Intraday trading still requires good SL to withstand market fluctuations. In terms of trading, it is recommended to mainly go long on callbacks
🎯 Trading Points:
SELL 3365-3375
TP 3350-3340-3335
BUY 3335-3330-3325
TP 3350-3360-3375
In addition to investment, life also includes poetry, distant places, and Allen. Facing the market is actually facing yourself, correcting your shortcomings, confronting your mistakes, and strictly disciplining yourself. I hope my analysis can help you🌐.
FXOPEN:XAUUSD PEPPERSTONE:XAUUSD FOREXCOM:XAUUSD FX:XAUUSD OANDA:XAUUSD TVC:GOLD

XAUUSD: Market analysis and strategy on July 3Gold technical analysis
Daily chart resistance level 3400, support level 3300
4-hour chart resistance level 3382, support level 3327
1-hour chart resistance level 3364, support level 3341
After bottoming out, the lowest point of yesterday's correction, 3327, has become an important support. Today's gold is still a strategy of buying at a low level. This idea can be maintained before the release of NFP employment data. Tomorrow, the US Independence Day will be closed for one day. The NFP data will be released in advance today, and the trading market will be closed in advance.
Judging from the current market trend, today it broke through the previous high of 3357. Today's Asian session slightly rose to 3365 and then quickly fell back to 3341. The low point of the Asian session retracement of 3341 is a small support. The second is the low point of 3333 in the US session yesterday. The support point of 3333/41 can be bought when the European session falls back. The possibility of a unilateral rise in the high point of today before the NFP data is small. I expect it to fluctuate and wait patiently for a pullback to buy. Today's NY market risk is relatively high. Please try to avoid trading during news time!
Buy: 3341near
Buy: 3333near

Gold & $3400Gold is under the resistance at $3400 for a long time, and if can not break that then downside movement will come.

GOLD → Retesting resistance may lead to a breakout.FX:XAUUSD breaks the downward resistance line on the senior timeframe and tests the upper limit of the trading range amid the falling dollar and Powell's speech. The metal may continue its upward movement.
The dollar's rise was short-lived after Fed Chairman Jerome Powell hinted at an imminent interest rate cut, but not in July... The probability of a rate cut in July fell to 22%, and in September to 72%.
Markets are awaiting fresh employment data (ADP and Nonfarm Payrolls), which could influence the prospects for rate cuts. Weak reports could revive interest in gold, but for now, the asset remains under pressure due to the short-term strengthening of the dollar and uncertainty surrounding Fed policy.
Technically, if the pre-breakout structure remains intact and gold continues to attack resistance within the local range of 3347-3330 (3335), the chances of further growth will be high...
Resistance levels: 3347, 3358
Support levels: 3336, 3316, 3311
The global trend is upward, and locally, the price is also returning to growth. If the bulls can maintain the current trend, break through the resistance at 3347, and hold their ground above this level, then the next target will be 3390-3400. I do not rule out a correction to 3325, 3316 (liquidity hunt) before the growth continues.
Best regards, R. Linda!

XAUUSD M15 I Bearish Reversal Based on the M15 chart, the price is approaching our sell entry level at 3355, a pullback resistance that aligns with the 61.8 Fib retracement.
Our take profit is set at 3343 an overlap support.
The stop loss is set at 3365.97, a swing high resistance.
High Risk Investment Warning
Trading Forex/CFDs on margin carries a high level of risk and may not be suitable for all investors. Leverage can work against you.
Stratos Markets Limited (tradu.com ):
CFDs are complex instruments and come with a high risk of losing money rapidly due to leverage. 63% of retail investor accounts lose money when trading CFDs with this provider. You should consider whether you understand how CFDs work and whether you can afford to take the high risk of losing your money.
Stratos Europe Ltd (tradu.com ):
CFDs are complex instruments and come with a high risk of losing money rapidly due to leverage. 63% of retail investor accounts lose money when trading CFDs with this provider. You should consider whether you understand how CFDs work and whether you can afford to take the high risk of losing your money.
Stratos Global LLC (tradu.com ):
Losses can exceed deposits.
Please be advised that the information presented on TradingView is provided to Tradu (‘Company’, ‘we’) by a third-party provider (‘TFA Global Pte Ltd’). Please be reminded that you are solely responsible for the trading decisions on your account. There is a very high degree of risk involved in trading. Any information and/or content is intended entirely for research, educational and informational purposes only and does not constitute investment or consultation advice or investment strategy. The information is not tailored to the investment needs of any specific person and therefore does not involve a consideration of any of the investment objectives, financial situation or needs of any viewer that may receive it. Kindly also note that past performance is not a reliable indicator of future results. Actual results may differ materially from those anticipated in forward-looking or past performance statements. We assume no liability as to the accuracy or completeness of any of the information and/or content provided herein and the Company cannot be held responsible for any omission, mistake nor for any loss or damage including without limitation to any loss of profit which may arise from reliance on any information supplied by TFA Global Pte Ltd.
The speaker(s) is neither an employee, agent nor representative of Tradu and is therefore acting independently. The opinions given are their own, constitute general market commentary, and do not constitute the opinion or advice of Tradu or any form of personal or investment advice. Tradu neither endorses nor guarantees offerings of third-party speakers, nor is Tradu responsible for the content, veracity or opinions of third-party speakers, presenters or participants.

Gold is Pushing Bullish but is it really ready???This looks like a early move to move full on bullish. I feel like it might need to sweep the low from mid week before they really ready to go bullish. waiting for things to show a bit more clear during the Kill Zone.

XAUUSD — July 3rd, 2025: Is the Downtrend Finally Over?Gold (XAUUSD) opened today with a bullish gap, and continued the momentum from Tuesday’s breakout above the major downtrendline that had capped the market for weeks. This technical breakout was long-awaited by many traders, and it's now leading us into a potential trend reversal phase — but not without resistance.
Price has now reached a critical resistance zone at 3366, which previously acted as a strong supply area during the last leg of the downtrend. If this level is broken decisively (ideally with a 4H candle close and follow-through), it may signal a clean shift toward a mid-term uptrend, with upside targets at 3379, 3403, and even 3430.
That said, rejection at 3366 has already triggered a minor pullback. We’re now watching the 3343–3351 zone as a potential support and an optimal buy entry area. If this zone holds, it could provide the fuel needed for bulls to continue their push.
🟢 Suggested Trade Plan
BUY LIMIT 3343–3351
Stop Loss 3325
Take Profit 1 3379
Take Profit 2 3403
Take Profit 3 3430
(Alternatively, consider a BUY STOP above 3370 in case of direct breakout)
📌 Market Structure
Resistance 3 3430
Resistance 2 3403
Resistance 1 3382
Pivot 3366
Support 1 3342
Support 2 3322
Support 3 3305
⚠️ Important Macro Alert
Today’s session is highly risky due to the early release of Non-Farm Payrolls (NFP) data, which is scheduled today instead of Friday because of the U.S. Independence Day (July 4) holiday tomorrow.
This brings a major volatility spike risk during the New York session. Manage your position size wisely, avoid emotional trades, and wait for solid confirmations.
Discipline beats prediction. Trade what you see — not what you feel.
Keep healthy so we can keep trading and we can keep on profiting.
GOLD Bullish Breakout! Buy!
Hello,Traders!
GOLD is going up now
And the price broke the
Key horizontal level
Around 3,346$ and
The breakout is confimred
So we are bullish biased
And we will be expecting
A further bullish move up
Buy!
Comment and subscribe to help us grow!
Check out other forecasts below too!
Disclosure: I am part of Trade Nation's Influencer program and receive a monthly fee for using their TradingView charts in my analysis.

ADP data has been released, how to position gold in the future📰 News information:
1. ADP data, for reference of tomorrow's NFP data
2. Interest rate cuts and Powell's dovish comments
3. Geopolitical impact on the gold market
📈 Technical Analysis:
The ADP data was significantly bullish after it was released, but gold did not rise sharply in the short term. Instead, it touched the resistance of 3350 that we gave and then fell back. I also saw a lot of fake traders in the market who immediately told their brothers to go long and look towards 3380 after the ADP data was released. To be honest, I think these people are typical hindsight experts. If everyone is like this, then anyone can be called a trader, right?
Back to the topic, I still hold short orders at 3340-3350. In the short term, gold will fluctuate and be bearish to seek restorative support, so the best place to go long is to look at the retracement below, which will at least touch 3333-3323. If it falls below this support, it will go to 3315-3305. On the contrary, if it gets effective support at 3333-3323, then gold will rebound as expected to form a head and shoulders bottom.
🎯 Trading Points:
SELL 3340-3350-3355
TP 3333-3323-3315-3295
BUY 3335-3325
TP 3345-3355-3375
In addition to investment, life also includes poetry, distant places, and Allen. Facing the market is actually facing yourself, correcting your shortcomings, confronting your mistakes, and strictly disciplining yourself. I hope my analysis can help you🌐.
FXOPEN:XAUUSD PEPPERSTONE:XAUUSD FOREXCOM:XAUUSD FX:XAUUSD OANDA:XAUUSD TVC:GOLD
GOLD - WAVE 5 BULLISH TO $3,734 (UPDATE)While we currently hold a bearish bias, let's not forget what I said on this previous 'bullish bias' post. I said Gold bullish structure is only invalidated AFTER we see price go BELOW $3,245. Price came very close to our 'Wave 2 low' but did not surpass it.
Just keep an eye out & always be prepared.

Bullish rise for the Gold?The price is reacting off the resistance level which is a pullback resistance and could potentially rise from this level to our take profit.
Entry: 3,344.54
Why we like it:
There is a pullback resistance level.
Stop loss: 3,302.57
Why we like it:
There is a pullback support level.
Take profit: 3,403.53
Why we like it:
There is a pullback resistance level that lines up with the 78.6% Fibonacci retracement.
Enjoying your TradingView experience? Review us!
Please be advised that the information presented on TradingView is provided to Vantage (‘Vantage Global Limited’, ‘we’) by a third-party provider (‘Everest Fortune Group’). Please be reminded that you are solely responsible for the trading decisions on your account. There is a very high degree of risk involved in trading. Any information and/or content is intended entirely for research, educational and informational purposes only and does not constitute investment or consultation advice or investment strategy. The information is not tailored to the investment needs of any specific person and therefore does not involve a consideration of any of the investment objectives, financial situation or needs of any viewer that may receive it. Kindly also note that past performance is not a reliable indicator of future results. Actual results may differ materially from those anticipated in forward-looking or past performance statements. We assume no liability as to the accuracy or completeness of any of the information and/or content provided herein and the Company cannot be held responsible for any omission, mistake nor for any loss or damage including without limitation to any loss of profit which may arise from reliance on any information supplied by Everest Fortune Group.

GOLD 4H: structure broken - phase reversal beginsTwo key directional signals were recorded on the gold chart: first, a breakdown of the ascending channel, followed by a confident downward exit from the triangle with a clear fixation under the $3297 boundary. Both figures worked independently, but consistently - and strengthened the impulse towards selling.
The price has already gone beyond the lower boundary of the triangle ($3297), confirming the bearish scenario. Candlesticks closing under the level and local consolidation from below is a characteristic formation before the momentum continues.
Technical parameters:
- Channel breakout: completed
- Triangle breakout: $3297 level
- Retest from below: expected as confirmation
- EMAs reversed downwards, structure broken
- Volumes strengthened at the moment of breakout
Tactical plan:
- Sell after retest of $3297
- Targets on the move: $3248 and $3201
- Stop: above $3305 (above the area of false outs).
The current structure indicates the end of the accumulation phase and the beginning of the downward momentum. As long as the price holds below $3297 - shorts are the priority.

GOLD BROKEN WEDGE|LONG|
✅GOLD was trading in an
Opening wedge pattern and
Now we are seeing a bullish
Breakout so we are bullish
Biased and we will be expecting
A further bullish move up
LONG🚀
✅Like and subscribe to never miss a new idea!✅
Disclosure: I am part of Trade Nation's Influencer program and receive a monthly fee for using their TradingView charts in my analysis.
