SILVER: Move Down Expected! Short!
My dear friends,
Today we will analyse SILVER together☺️
The in-trend continuation seems likely as the current long-term trend appears to be strong, and price is holding below a key level of 36.310 So a bearish continuation seems plausible, targeting the next low. We should enter on confirmation, and place a stop-loss beyond the recent swing level.
❤️Sending you lots of Love and Hugs❤️
Metals

GOLD 30Min Engaged ( Bearish Reversal Entry Detected )➕ Objective: Precision Volume Execution
Time Frame: 30-Minute Warfare
Entry Protocol: Only after volume-verified breakout
🩸 Bearish Reversal : 3370
Volume Poc + Value
➗ Hanzo Protocol: Volume-Tiered Entry Authority
➕ Zone Activated: Dynamic market pressure detected.
The level isn’t just price — it’s a memory of where they moved size.
Volume is rising beneath the surface — not noise, but preparation.
🔥 Tactical Note:
We wait for the energy signature — when volume betrays intention.
The trap gets set. The weak follow. We execute.
GOLD 30Min Engaged ( Bearish Reversal Entry Detected )

Gold Update: Possible Triangular Consolidation Before New RallyIt looks like corrective wave 4 is in the making within a large Triangle
3 waves A, B and C already emerged in 3-waves structure
which confirms triangle
Wave D should stay under the top of wave B
Wave E could either touch or break down the support line
It should keep above the valley of wave C
Target area changed higher as this consolidation tends to narrowing within a
contracting triangle.
Lowest target now $3,900
Optimistic target is at $4,300
Breakdown below $3,123 would invalidate the pattern

Everybody loves Gold Part 6Great week in Part 5.
Starting this week with a strong bias towards the upside.
Here's a breakdown of trading dynamics:
1. Expecting price to break past green line, level of significance (LOS) for continuation up
2. Price might bounce back for which; will be looking for a continuation from -50/-100 or -150pips to the upside
3. Will be looking for double tops/bottom along the way
As always price action determines trades

XAU/USD – Testing 2H/1H Supply Zone | Breakout or Rejection?XAU/USD – Testing 1H/2H Supply Zone | Bullish Continuation or Rejection Ahead
Gold has rallied strongly from the support zone around 3,238–3,255, breaking multiple intraday resistance levels and now approaching a critical 1H/2H Supply Zone near 3,348–3,366.
This area previously acted as a strong sell-off zone, making it a key decision point.
Scenario 1: Bullish Continuation
If price breaks and closes above 3,366 with momentum, we could see further upside toward the next resistance at 3,400 and possibly retest the ATH zone at 3,486. A short consolidation or retest within the zone would confirm strength.
Scenario 2: Rejection from Supply Zone
If the supply holds, a rejection from the zone could lead to a pullback toward:
3,320.48 (minor support)
3,297.08 (support line)
Or deeper retracement to the 3,255–3,238 support zone
Key Technical Levels
Supply Zone: 3,348 – 3,366
Resistance: 3,400 – 3,486 (ATH)
Support Levels: 3,320 – 3,297 – 3,255 – 3,238
Pivot Line: 3,348

What is Inflation Climate and Weather? Copper is NextThe key driver of most markets — and a major influence on their trends — is inflation.
Once we understand the difference between short-term inflation weather and long-term inflation climate, we can better recognize where risk meets opportunity.
On this half yearly chart. We can see as the close on 30th June, copper settled firmly, closed above its $4.44 resistance that has been tested for years.
This study indicates that copper could be at the beginning of an uptrend. I will be looking out for buying-on-dips opportunities whenever they arise.
Mirco Copper Futures
Ticker: MHG
Minimum fluctuation:
0.0005 per pound = $1.25
Disclaimer:
• What presented here is not a recommendation, please consult your licensed broker.
• Our mission is to create lateral thinking skills for every investor and trader, knowing when to take a calculated risk with market uncertainty and a bolder risk when opportunity arises.
CME Real-time Market Data help identify trading set-ups in real-time and express my market views. If you have futures in your trading portfolio, you can check out on CME Group data plans available that suit your trading needs www.tradingview.com

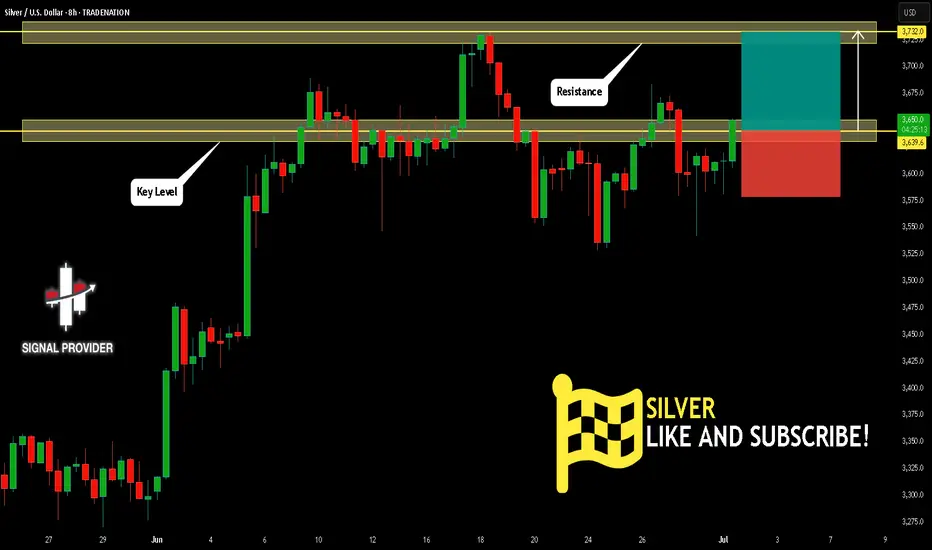
SILVER Will Move Higher! Long!
Please, check our technical outlook for SILVER.
Time Frame: 8h
Current Trend: Bullish
Sentiment: Oversold (based on 7-period RSI)
Forecast: Bullish
The price is testing a key support 3,639.6.
Current market trend & oversold RSI makes me think that buyers will push the price. I will anticipate a bullish movement at least to 3,732.0 level.
P.S
The term oversold refers to a condition where an asset has traded lower in price and has the potential for a price bounce.
Overbought refers to market scenarios where the instrument is traded considerably higher than its fair value. Overvaluation is caused by market sentiments when there is positive news.
Disclosure: I am part of Trade Nation's Influencer program and receive a monthly fee for using their TradingView charts in my analysis.
Like and subscribe and comment my ideas if you enjoy them!
GOLD → Retest of the resistance range. Correction?FX:XAUUSD is recovering amid expectations of lower interest rates in the US, and the falling dollar is also supporting the price of the metal.
The dollar remains under pressure due to political uncertainty in the US, budget concerns, and trade risks. However, strong stock market growth and possible tariff measures against Japan and the EU are also affecting the market, adding volatility to gold
Powell will speak at the ECB forum, and markets are waiting for him to hint at a rate cut. Currently, the probability of a cut in July is estimated at 20%, and in September at 77%. A dovish tone will support gold, while a hawkish tone will increase pressure.
Technically, since the opening of the session, gold has exhausted its daily range (ATR), and there is a fairly high probability that after strong growth, the price may be stopped in the 3347-3350 zone.
Resistance levels: 3347, 3350
Support levels: 3312, 3295
If gold cannot continue to rise after breaking through 3347 and the price returns to the resistance zone, then in this case, we can consider a correction to 0.5-0.7 Fibonacci before a possible continuation of growth.
Best regards, R. Linda!

The bull market is too fierce. How to solve the short position?📰 News information:
1. Geopolitical situation
2. PMI data
📈 Technical Analysis:
The conflict between Iran and Israel has stopped for a while, but there is a possibility of it breaking out again. There is a possibility of triggering risk aversion in the short term. From a technical perspective, the 4H MACD indicator shows a golden cross, and the moving average and other indicators are also radiating upward, with a strong bullish signal. The 1H chart Bollinger Bands open upward, and the short-term pressure position is at 3340-3345. The short-term data indicators are seriously overbought, and there may be a profit correction in the short term. Therefore, if you want to short in the short term, you can only consider the 3340-3350 range. In the short term, gold will not usher in a large retracement, and the short-term target is only suitable for looking at 3320-3310. As for the long trading point, it is expected to wait for the European and American trading hours.
🎯 Trading Points:
SELL 3340-3350
TP 3320-3310
BUY 3325-3315
TP 3335-3340-3350
In addition to investment, life also includes poetry, distant places, and Allen. Facing the market is actually facing yourself, correcting your shortcomings, confronting your mistakes, and strictly disciplining yourself. I hope my analysis can help you🌐.
TVC:GOLD OANDA:XAUUSD FOREXCOM:XAUUSD PEPPERSTONE:XAUUSD FXOPEN:XAUUSD FX:XAUUSD


XAUUSD Analysis – 01/07: Gold Sees a Rebound Amid USD WeaknessXAUUSD Analysis – 01/07: Gold Sees a Rebound Amid USD Weakness – Is a Recovery on the Cards?
As we enter the new month, gold prices are showing signs of recovery after a significant drop, primarily driven by the weakening of the US Dollar. However, despite some positive momentum, the path to sustained growth remains uncertain.
💵 USD Weakness Fuels Gold's Potential Rebound
Recent US economic data shows a slight decrease in consumer spending, which has led to speculation that the Federal Reserve may ease interest rate hikes in the near future.
This, in turn, has contributed to a weaker USD, providing an opportunity for gold to recover slightly.
⚖️ The Federal Reserve's Role Remains Critical
The markets are awaiting further clues on the Federal Reserve's next moves, especially with the ongoing debate about the potential direction of interest rates.
While the recent economic data isn't weak enough to force a policy reversal, it hasn't been strong enough to give the Fed the confidence to continue its hawkish stance either.
🧠 What Does This Mean for Traders?
Gold is responding to macroeconomic factors but still lacks a clear, strong trend.
Volatility remains high, with sharp price fluctuations occurring after key economic and political announcements. This uncertainty suggests gold might not yet have the momentum for a definitive break-out or trend reversal.
🔶 Summary:
Gold is starting to recover after a tough month but the outlook remains cautious.
Buyers are hoping for a Fed rate cut, while sellers are banking on the USD's strength.
Traders should stay vigilant, waiting for clear confirmation before making major moves.
📊 Key Levels to Watch:
Resistance Levels: 3358 – 3360 – 3364 – 3375 – 3380
Support Levels: 3300 – 3290 – 3280 – 3275
🎯 Trading Strategy:
🔵 Buy Zone:
Entry: 3310 – 3315
SL: 3300
TP: 3320 – 3330 – 3340 – 3350 – 3360
🔴 Sell Zone:
Entry: 3370 – 3375
SL: 3380
TP: 3360 – 3350 – 3340 – 3325
⚠️ Final Thoughts:
With USD weakness persisting, gold may continue its rebound, but the market remains uncertain.
Keep an eye on macroeconomic data and geopolitical events, as they will likely shape gold's next move.

GBPJPY H4 XABCD Short at Market TP Below Market🔸Hello traders, let's review the 4 hour chart for GBPJPY. Strong gains off the lows recently, however price getting overextended and expecting reversal later at/near PRZ/D.
🔸Speculative XABCD structure defined by point X 199 point A 188 point B 195.20 point C 186.80 point D/PRZ 198.40/80 .
🔸Currently most points validated, point D/PRZ validated as well.
Short sell at market SL over point D/PRZ TP details see chart
🔸Recommended strategy for GJ traders: Short Sell at Market
SL over point D/PRZ TP1 193.30 TP2 191.00 TP3 188.80.
🎁Please hit the like button and
🎁Leave a comment to support our team!
RISK DISCLAIMER:
Trading Futures , Forex, CFDs and Stocks involves a risk of loss.
Please consider carefully if such trading is appropriate for you.
Past performance is not indicative of future results.
Always limit your leverage and use tight stop loss.

GOLD GOES 'PREPARING FOR SCORCHING-HOT JULY'. UPSHOT OF 1H 2025Gold market shines bright in first half of 2025, with nearly 25 percent year-to-date gain, which becomes one of the best start of the year in history ever following 1H 2016 (became a launching pad for Gold to more than Triple in price over next decade) and 1H 1973 (where Gold bugs sharply skyrocketed to infinity and beyond, printed more than 10x over next decade).
The gold spot market in July 2025 is shaped by both fundamental and technical factors supporting a cautiously bullish outlook.
Fundamental perspectives
Were you ready or not, Gold prices have surged significantly in 2025, driven by persistent global uncertainties including geopolitical conflicts (e.g., Middle East tensions), trade disputes, and inflation concerns.
Central banks, notably the Federal Reserve, are expected to cut interest rates later in 2025, reducing the opportunity cost of holding gold, a non-yielding asset. This monetary easing alongside continued inflation worries and safe-haven demand underpins strong gold fundamentals.
Major financial institutions like J.P. Morgan and UBS forecast gold prices averaging around $3,500–$3,675 per ounce in late 2025, with potential to reach $4,000/oz by mid-2026.
Central bank gold purchases and diversification away from US dollar assets also support demand.
Technical perspectives
Technically, gold has experienced volatile but mostly sideways trading in a roughly $300 range around $3,200–$3,500 since mid-2025, reflecting consolidation after a strong rally earlier in the year.
Key support lies near $3,000 and $3,200 levels (125-Day, or 6-Month SMA), with resistance around $3,500 to $3,800. Indicators such as moving averages and RSI suggest an upward trend with possible short-term corrections.
A breakout above $3,500 could trigger further gains toward $3,800, while a drop below $3,200 may lead to testing $3,000 support.
Overall, July is expected to see continued range-bound trading amid new external uncertainties, with bullish momentum intact.
In summary, gold’s fundamentals remain robust due to macroeconomic and geopolitical drivers, while technicals point to consolidation with potential for renewed upward moves in the July 2025 spot market.
--
Best #GODL wishes,
@PandorraResearch Team 😎

Gold 30 Min Engaged ( Dual Entry's Detected )➕ Objective: Precision Volume Execution
Time Frame: 30-Minute Warfare
Entry Protocol: Only after volume-verified breakout
🩸 Bullish Reversal : 3309
Volume Poc + Value
🩸 Bearish Reversal : 3284
Volume Poc + Value
➗ Hanzo Protocol: Volume-Tiered Entry Authority
➕ Zone Activated: Dynamic market pressure detected.
The level isn’t just price — it’s a memory of where they moved size.
Volume is rising beneath the surface — not noise, but preparation.
🔥 Tactical Note:
We wait for the energy signature — when volume betrays intention.
The trap gets set. The weak follow. We execute.

Gold (XAU/USD) Technical Outlook — July 1, 2025In the world of financial markets, few assets capture global attention like gold. A timeless store of value, gold continues to act as both a hedge against uncertainty and a battleground for technical traders seeking high-probability setups. As of today, gold (XAU/USD) is trading at $3328, a level that places it just beneath the most recent multi-month high at $3345. The recent surge in price is underpinned by both macroeconomic factors and bullish technical structure. However, as any seasoned trader knows, trends rarely move in straight lines — and gold is now approaching a technically sensitive juncture.
I. Gold’s Structural Landscape on the 4-Hour Chart
The four-hour chart reveals a textbook bullish trend. Beginning with a significant impulse from the $3194 base, gold has climbed steadily, printing higher highs and higher lows. The most recent break of structure (BOS) above $3312 confirmed the continuation of bullish intent, while the market remains firmly above key swing lows — signaling that the bullish regime has not yet been invalidated.
Price action shows clean, impulsive expansions followed by short consolidations, with buyers continuing to absorb supply at every retracement. Despite that strength, gold has now reached a potential exhaustion point, with the price reacting to overhead supply at $3345–3355, forming what could be an early-stage distribution zone.
Key Market Structure Developments:
BOS at $3312: confirms uptrend
No CHoCH (Change of Character) yet — no confirmed bearish reversal
Clean liquidity grab above $3345, followed by rejection — hinting at short-term profit-taking or internal bearish intent
II. The Fibonacci Grid: Retracement and Extension Zones
Applying Fibonacci retracement from the $3194 swing low to the $3345 high offers crucial levels of interest. The golden ratio at 61.8% ($3253) aligns perfectly with prior demand and a 4-hour bullish order block. Similarly, the 38.2% level at $3285 corresponds with a minor liquidity pool and potential reaccumulation base.
Fibonacci Level Price
23.6% $3308
38.2% $3285
50.0% $3269
61.8% $3253
78.6% $3228
On the extension side, should gold resume its rally beyond $3345, projected Fibonacci targets sit at $3372 (127.2%) and $3410 (161.8%), with both acting as measured projections for trend continuation.
III. Supply and Demand: Mapping Institutional Footprints
Institutional activity is best observed through unmitigated supply and demand zones — areas where large orders caused rapid price displacement. Gold currently trades between two such zones:
Demand Zone: $3250–$3260 — a sharp bullish rejection occurred here on the last visit, indicating strong buy-side interest and likely pending buy orders
Supply Zone: $3345–$3355 — where a sell-side liquidity grab recently occurred, followed by a strong rejection candle
These two zones bracket the market and serve as the highest probability areas for future reactions.
IV. The Smart Money Concepts (SMC) Framework
SMC theory revolves around observing the footprints of large market participants — often labeled “smart money.” In gold’s current structure, SMC tools provide a clearer roadmap than standard indicators.
Current Observations:
Break of Structure (BOS): Confirmed at $3312 (bullish continuation)
Change of Character (CHoCH): Absent (bull trend intact)
Buy-Side Liquidity Grab: Above $3345 — trapped breakout buyers likely fuel for reversal
Sell-Side Liquidity Pool: Uncollected beneath $3280 — probable magnet for a liquidity sweep
Fair Value Gap (FVG): Between $3260 and $3280 — price inefficiency offering high-probability reentry for smart money
Bullish Order Block (OB): At $3250–$3260 — final down candle before explosive up move, unmitigated
All these elements point to a high-probability pullback, rather than a full-blown reversal. Until structure is broken with a CHoCH, the base case remains bullish.
V. High-Probability Levels for 4-Hour-Based Opportunities
From this framework, we identify the following key price levels:
The highest-probability reaction is expected at $3250–$3260, where smart money is likely to re-engage if price retraces.
VI. Refinement on the 1-Hour Chart: Intraday Trade Setups
Zooming into the 1-hour chart allows us to fine-tune our execution strategy. Gold is consolidating just below $3330, forming what appears to be an ascending triangle — a common bullish continuation structure — but within the broader context of a possible short-term pullback.
Intraday Trade Idea #1 — High-Conviction Long
Entry: $3260
Stop-Loss: $3245
Take-Profit 1: $3308
Take-Profit 2: $3340
Risk–Reward: ~1:4
Rationale: Aligned with 4H demand, fair value gap, OB, and golden ratio retracement. Structure remains bullish.
Intraday Trade Idea #2 — Speculative Short (Low Conviction)
Entry: $3340–$3350
Stop-Loss: $3362
TP1: $3305
TP2: $3285
Risk–Reward: ~1:2.5
Rationale: Countertrend, only viable if bearish rejection candle forms. Not aligned with dominant 4H structure.
VII. The Golden Setup: Long from Demand + FVG Confluence
Among all technical configurations, the long setup at $3260 emerges as the most compelling. It is supported by:
An unmitigated bullish order block
A clear fair value gap
61.8% Fibonacci retracement
Untouched sell-side liquidity below
Directional alignment with trend
Institutional demand pattern
This setup offers both superior risk-to-reward and a technical foundation that aligns with Smart Money’s modus operandi. It represents a low-risk, high-reward opportunity for traders who wait for price to re-enter the value zone and confirm with bullish order flow (e.g., a bullish engulfing or BOS on 15m).
VIII. Final Thoughts and Tactical Summary
As of July 1, 2025, the gold market reflects strong bullish momentum, albeit entering a corrective phase that should not be mistaken for reversal. While intraday volatility and range compression may tempt countertrend trades, the smartest play remains to wait for a discounted reentry into a zone of value.
Until structure shifts significantly, the dominant trading thesis remains: “Buy the dip into institutional zones”. Patience, not aggression, will separate the retail trader from the professional in today’s complex market structure.

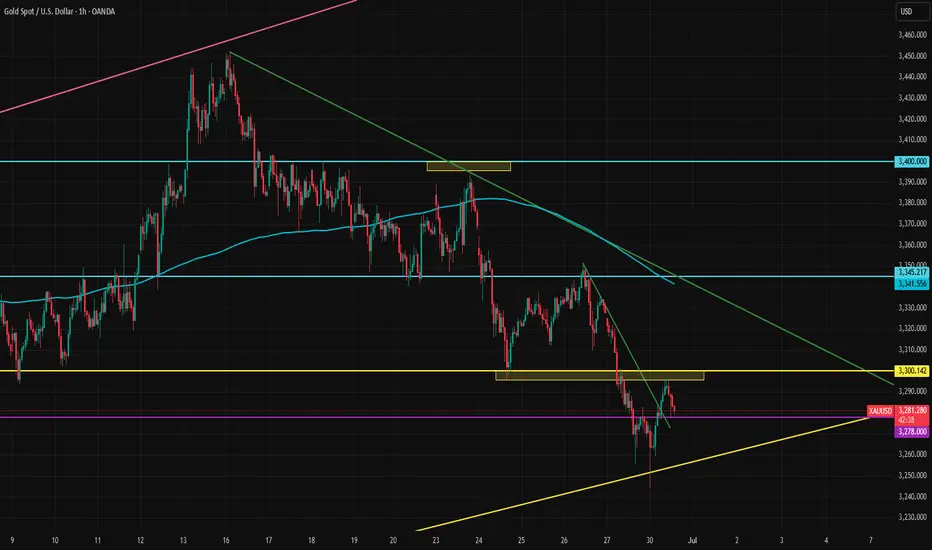
GOLD → Recovery and retest of resistance. DowntrendFX:XAUUSD has been recovering since the start of the session thanks to a weak dollar, but further growth is uncertain. However, the price is still below the key range and important levels.
At the beginning of the week, gold rebounded from monthly lows amid a weakening US dollar, which remains under pressure due to trade disputes with Japan, uncertainty surrounding the budget, and expectations of a Fed rate cut in September.
However, the technical picture for gold remains bearish, and further dynamics will depend on new statements from Fed officials, labor market data, and Jerome Powell's speech on Tuesday.
Technically, after breaking through the global range support, the price is forming a correction and testing 3294. Before a possible rise to 3320 or to the 0.7 Fibonacci zone, a correction to 3271 may form, which will determine the further development of the situation.
Support levels: 3271, 3255, 3245
Resistance levels: 3294, 3320, 3347
A retest of 3295 (0.5) Fibonacci is forming. There is a possibility of a false breakout with a possible correction. If, during the correction, buyers keep the price above 3271 and return to retest 3294, we will have a chance to attempt growth to 3320 - 3347
Best regards, R. Linda!

Gold Tests 6-Month TrendGold is attempting to find support at the yellow trendline below, which has held since late December. At today’s open, gold quickly found support at that level, which is a bullish signal. However, it may not be over yet.
For gold to recover meaningfully, it needs to break above the 3300 resistance first, followed by 3345 to confirm a move higher. This week, the U.S. Senate will discuss the "Big, Beautiful Bill," which markets expect will widen the deficit, despite Trump’s claims to the contrary. Regardless of the outcome, the discussion could provide gold with the fuel it needs to rebound after its weak performance in the second half of June.
Gold, GC!, Sideway to the Downside (Long Term)06/30/2025, 10:30 PM PT
GC! is currently at its max around 3,500.
On the Weekly MACD, the crossover between MACD lind signal line already happened. There is also a bearish divergence on weekly chart.
On the Daily chart, RSI just crosses below 50 on RSI, and MACD shows weakness on the bull (it still not in the bear's territory just yet).
Reversasl to bear side may happen if price stays below 3,200
Bullish will continues if price break out of all time high
Current range for big timeframe from 3,200 - 3,500
Plan for swing trade:
Bullish Case (short term): break trendline. If hold above 3,360, price could go up to 3,400 -> 3,450
Bearish Case (short term): If price rejects and stays below 3,360, price could go down 3,310 -> 3,280
***Disclaimer: This analysis and trade plan are for educational and informational purposes only and should not be considered as financial or investment advice.

GOLD SHORT TRADE IDEA ! Gold Looking For Sell On Order Block Zone 3331/3334 Target Will Be 3300
Gold Sell Second Zone Bearish Engulfing + Fresh Supply Target Will Be 3275
Gold Sell First Zone OB H1 (3331/3335
Stoploss - 3345
Tp Levels - 3325,3320,3310,3300
Gold Sell Second Zone Bearish EG + Fresh Supply (3338/3344)
Stoploss - 3350
TP levels : 3330; 3322; 3314; 3330, 3290

XAU/USD) bearish reversal analysis Read The captionTechnical analysis of (XAU/USD) based on price action and technical indicators on the 15-minute timeframe. Here's a
---
Key Technical Insights:
1. Resistance Level (Highlighted Yellow Zone):
Price is approaching a strong resistance zone (previous rejection marked by red arrows).
This area has historically pushed price downward.
2. Trendline Support (Rising Black Line):
Price has been following a short-term ascending trendline, forming higher lows.
A break below this trendline signals potential bearish reversal.
3. EMA 200 (Blue Line):
Price is currently above the EMA 200, indicating short-term bullish momentum.
However, price is testing resistance — a rejection could flip momentum bearish.
4. Bearish Rejection & Projection:
The chart shows an anticipated rejection from resistance, followed by a break of trendline support.
Target zone is marked near 3,228.098, indicating a drop of ~94 points from the current level.
5. RSI (Relative Strength Index):
RSI is nearing overbought territory (68.79).
A bearish divergence or RSI crossing down may confirm weakening momentum.
Mr SMC Trading point
---
Conclusion / Trading Idea:
Bias: Bearish
Entry Zone: Near the resistance level (~3,322)
Confirmation: Break of trendline support
Target: 3,228
Stop-Loss: Above resistance zone (just over the upper trendline)
---
pelas support boost 🚀 this analysis)

GoldHere's an analysis based on the information presented in the image:
Overall Market Structure (from a quick glance):
Recent Price Action: The price has recently experienced a significant decline, followed by a bounce.
Order Block (OB): There's a clearly marked "4 Hours OB" (Order Block) which is a key area of interest for potential resistance.
Potential Trading Setup:
Entry: The "Entry" price is set at 3,340.00. This entry point is within the bearish order block, suggesting a short (sell) position.
Stop Loss (S/L): The "S/L" is placed at 3,352.00. This is above the high of the 4-hour order block, aiming to limit losses if the price moves against the short position and breaks above the resistance.
Take Profit (Profit): The "Profit" target is set at 3,296.00. This target is significantly lower than the entry, aiming to capture a downward movement.
Risk-Reward Ratio:
Risk: The difference between the entry (3,340.00) and the stop loss (3,352.00) is 12 points.
Reward: The difference between the entry (3,340.00) and the take profit (3,296.00) is 44 points.
Ratio: This implies a risk-reward ratio of approximately 1:3.67 (44 / 12), which is generally considered favorable.
Key Technical Concepts Illustrated (from the inset image):
The smaller inset image on the left illustrates concepts commonly used in Smart Money Concepts (SMC) or Institutional Order Flow (IOF) trading:
Order Block (OB): A price range where significant institutional buying or selling occurred, often leading to price reversals. The red box indicates a bearish order block.
Entry: The point at which a trade is entered.
FVG (Fair Value Gap) / Imbalance: An area on the chart where price moved quickly in one direction, leaving an "inefficiency" or gap that price often retests.
CHoCH (Change of Character): An early sign of a potential trend reversal, indicating a shift in market sentiment.
BOS (Break of Structure): When price breaks a significant high (for a bullish trend) or low (for a bearish trend), confirming the continuation or reversal of a trend. The multiple "BOS" labels suggest a series of lower lows, confirming a bearish trend.
BERISH DISPLACEMENT: Implies strong bearish momentum leading to lower prices.
PRLII S: This specific acronym is not universally recognized but could refer to a specific pattern or setup within the trader's methodology, possibly related to liquidity or price action.
Conclusion/Potential Interpretation:
The chart suggests a bearish outlook for XAUUSD, with the trader looking to short Gold at the retest of a 4-hour bearish order block. The setup has a favorable risk-reward ratio. The concepts in the inset image provide a theoretical framework for why this particular entry and targets might be chosen, based on institutional trading principles. The current price is at 3,322.285 at 08:33:38 +04, which is below the proposed entry, suggesting this might be a setup that the trader is waiting to happen or a retrospective analysis of a potential trade idea.

XAGUSD H1 I Bearish Drop Based on the H1 chart analysis, we can see that the price is approaching our sell entry at 36.05, a pullback resistance
Our take profit will be at 34.77, a pullback support.
The stop loss will be placed at 37.00, a pullback resistance.
High Risk Investment Warning
Trading Forex/CFDs on margin carries a high level of risk and may not be suitable for all investors. Leverage can work against you.
Stratos Markets Limited (tradu.com ):
CFDs are complex instruments and come with a high risk of losing money rapidly due to leverage. 63% of retail investor accounts lose money when trading CFDs with this provider. You should consider whether you understand how CFDs work and whether you can afford to take the high risk of losing your money.
Stratos Europe Ltd (tradu.com ):
CFDs are complex instruments and come with a high risk of losing money rapidly due to leverage. 63% of retail investor accounts lose money when trading CFDs with this provider. You should consider whether you understand how CFDs work and whether you can afford to take the high risk of losing your money.
Stratos Global LLC (tradu.com ):
Losses can exceed deposits.
Please be advised that the information presented on TradingView is provided to Tradu (‘Company’, ‘we’) by a third-party provider (‘TFA Global Pte Ltd’). Please be reminded that you are solely responsible for the trading decisions on your account. There is a very high degree of risk involved in trading. Any information and/or content is intended entirely for research, educational and informational purposes only and does not constitute investment or consultation advice or investment strategy. The information is not tailored to the investment needs of any specific person and therefore does not involve a consideration of any of the investment objectives, financial situation or needs of any viewer that may receive it. Kindly also note that past performance is not a reliable indicator of future results. Actual results may differ materially from those anticipated in forward-looking or past performance statements. We assume no liability as to the accuracy or completeness of any of the information and/or content provided herein and the Company cannot be held responsible for any omission, mistake nor for any loss or damage including without limitation to any loss of profit which may arise from reliance on any information supplied by TFA Global Pte Ltd.
The speaker(s) is neither an employee, agent nor representative of Tradu and is therefore acting independently. The opinions given are their own, constitute general market commentary, and do not constitute the opinion or advice of Tradu or any form of personal or investment advice. Tradu neither endorses nor guarantees offerings of third-party speakers, nor is Tradu responsible for the content, veracity or opinions of third-party speakers, presenters or participants.

XAUUSD H1 I Bearish Drop Based on the H1 chart analysis, we can see that the price is trading near our sell entry at 33192, which is a pullback support.
Our take profit will be at 3297.07, a pullback support.
The stop loss will be placed at 3350.85, which is a swing high resistance.
High Risk Investment Warning
Trading Forex/CFDs on margin carries a high level of risk and may not be suitable for all investors. Leverage can work against you.
Stratos Markets Limited (tradu.com ):
CFDs are complex instruments and come with a high risk of losing money rapidly due to leverage. 63% of retail investor accounts lose money when trading CFDs with this provider. You should consider whether you understand how CFDs work and whether you can afford to take the high risk of losing your money.
Stratos Europe Ltd (tradu.com ):
CFDs are complex instruments and come with a high risk of losing money rapidly due to leverage. 63% of retail investor accounts lose money when trading CFDs with this provider. You should consider whether you understand how CFDs work and whether you can afford to take the high risk of losing your money.
Stratos Global LLC (tradu.com ):
Losses can exceed deposits.
Please be advised that the information presented on TradingView is provided to Tradu (‘Company’, ‘we’) by a third-party provider (‘TFA Global Pte Ltd’). Please be reminded that you are solely responsible for the trading decisions on your account. There is a very high degree of risk involved in trading. Any information and/or content is intended entirely for research, educational and informational purposes only and does not constitute investment or consultation advice or investment strategy. The information is not tailored to the investment needs of any specific person and therefore does not involve a consideration of any of the investment objectives, financial situation or needs of any viewer that may receive it. Kindly also note that past performance is not a reliable indicator of future results. Actual results may differ materially from those anticipated in forward-looking or past performance statements. We assume no liability as to the accuracy or completeness of any of the information and/or content provided herein and the Company cannot be held responsible for any omission, mistake nor for any loss or damage including without limitation to any loss of profit which may arise from reliance on any information supplied by TFA Global Pte Ltd.
The speaker(s) is neither an employee, agent nor representative of Tradu and is therefore acting independently. The opinions given are their own, constitute general market commentary, and do not constitute the opinion or advice of Tradu or any form of personal or investment advice. Tradu neither endorses nor guarantees offerings of third-party speakers, nor is Tradu responsible for the content, veracity or opinions of third-party speakers, presenters or participants.
