July Seasonality Patterns For Index, Metals and ForexSeasonality can be a useful tool if used wisely (and in context) with current sentiment and news flows. Seasonality really is a backwards looking indicator that can easily be overpowered by key macro drivers. But its strength comes in to play when seasonality aligns with the macro landscape.
With that in mind, I share my seasonality matrix for indices, metals and USD FX pairs to highlight potential patterns for July, then wrap up with an update on my Nasdaq 100 analysis.
Matt Simpson, Market Analyst at City Index and Forex.com.
Metals

The latest analysis and layout of gold in July made a good start📰 News information:
1. Geopolitical situation
2. PMI data
📈 Technical Analysis:
Yesterday, we gave the idea of looking at the upper resistance of 3310-3320. The 4H pressure is still at 3327. As long as this key resistance level is not effectively broken, gold will fall again. On the contrary, if it stabilizes above 3327, the trend may reverse. In the short term, pay attention to the upper resistance of 3327. If it is not broken, you can short with a light position. If it falls below 3300-3290, consider going long.
🎯 Trading Points:
SELL 3310-3320
TP 3305-3300
BUY 3300-3290
TP 3310-3320-3350
In addition to investment, life also includes poetry, distant places, and Allen. Facing the market is actually facing yourself, correcting your shortcomings, confronting your mistakes, and strictly disciplining yourself. I hope my analysis can help you🌐.
TVC:GOLD FXOPEN:XAUUSD PEPPERSTONE:XAUUSD FOREXCOM:XAUUSD OANDA:XAUUSD TVC:GOLD

The limit is 3320. Rebound and still short📰 News information:
1. Gold market liquidity at the end of the month
2. Impact of geopolitical situation
📈 Technical Analysis:
Currently, gold has rebounded to around 3295, reaching our ideal trading area. I have given the short-selling trading idea in the previous post. At present, in the short term, we still maintain the short-selling trading idea before effectively breaking through the upper resistance. Focus on the 3325 line of resistance
🎯 Trading Points:
SELL 3295-3310-3320
TP 3285-3270
In addition to investment, life also includes poetry, distant places, and Allen. Facing the market is actually facing yourself, correcting your shortcomings, confronting your mistakes, and strictly disciplining yourself. I hope my analysis can help you🌐.
OANDA:XAUUSD FOREXCOM:XAUUSD FX:XAUUSD PEPPERSTONE:XAUUSD FXOPEN:XAUUSD TVC:GOLD

Whats the Play for the week? Are we bullish?Looking for more bullish activity to continue. Just need to see price confirm if it is indeed ready to proceed. if we can find a solid entry we will rock with it. but not trying to force anything.

GOLD, back at higher base. BUY at 3250 enroute to ath 3500 / 4k.GOLD had a wonderful run this past few seasons grinding up a series of ATH taps every higher baselines since 1500.
After goin to a new parabolic highs of 3500 ATH, GOLD did hibernate a bit and got trimmed back to 3240 levels -- a precise 61.8 FIB tap. This is where most buyers converge, and position themselves on the next run up.
The next ascend series will be far more generous eyeing new higher numbers never before seen. Ideal seeding zone is at the current price range of 3250.
Current higher lows on momentum metrics has been spotted conveying intense upside pressure as it moves forward.
Spotted at 3250
Interim target at 3500 ATH
Long term: 4000
TAYOR.
Trade safely. Market will be market.
Not financial advice.

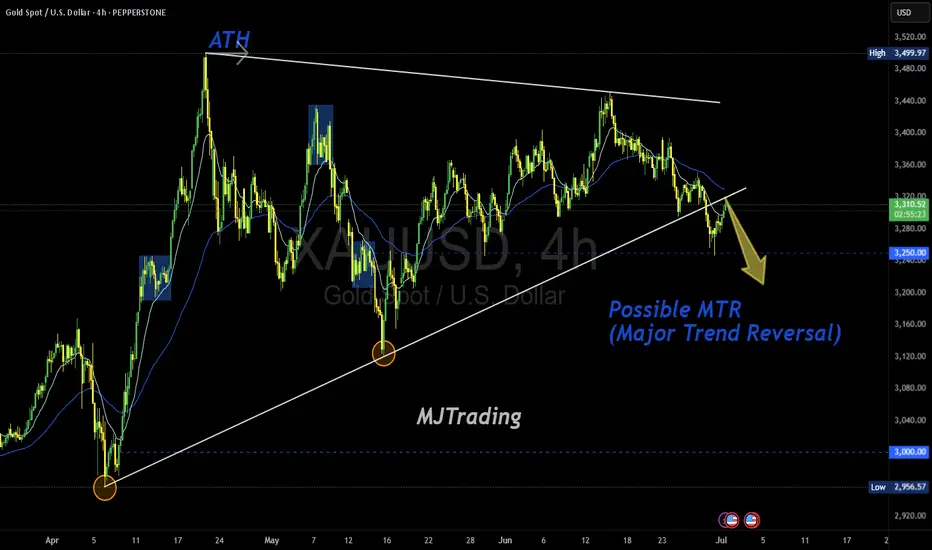
Possible MTR in Play (TBC)Gold has printed a textbook structure for a potential Major Trend Reversal (MTR) off the ATH zone, with a clean rejection and a shift in character. The descending trendline from the top aligns with lower highs, while the ascending base from April is now under pressure.
📌 Key Levels to Watch:
3,280.0 – neckline of the potential MTR
3,250.00 – psychological magnet and structural support
3,000.00 – major downside target if the reversal confirms
🧠 “Markets top on euphoria, not logic.” If price breaks and retests the neckline with momentum, the MTR thesis gains traction. Until then — TBC.
#XAUUSD #Gold #MajorTrendReversal #MTR #PriceAction #TechnicalAnalysis #GoldBears #ATHRejection #TrendShift #MJTrading
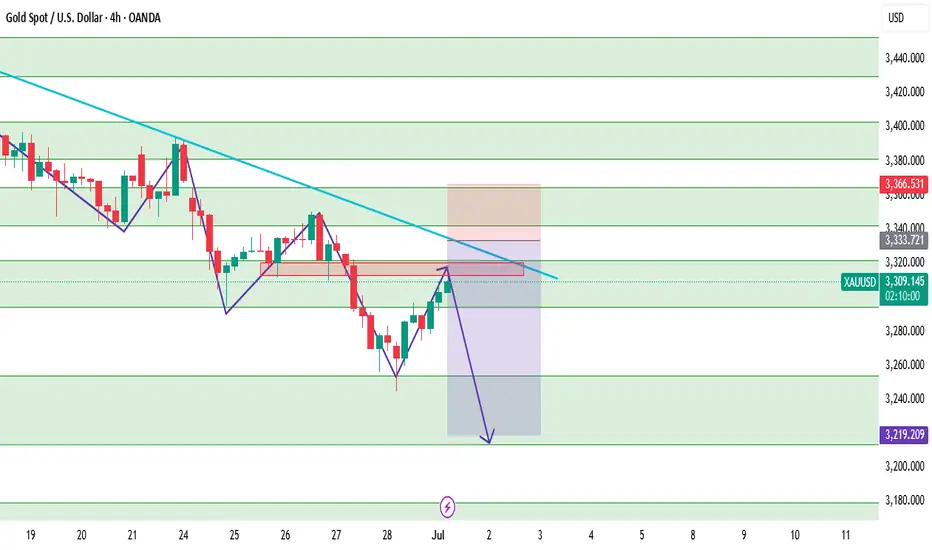
XAUUSD – Technical Outlook 4HXAUUSD is currently undergoing a corrective move after last week's bearish continuation. Price is now testing the minor resistance zone of 3295–3322, and could potentially extend the correction to test the descending trendline near 3333–3342.
The overall market structure remains bearish, with lower highs and lower lows clearly intact. Price has yet to break above the dynamic resistance trendline or the key swing high at 3366 — making any bullish move at this stage corrective, not a reversal.
Unless we see a strong bullish break and close above 3366, we expect sellers to return once price reaches the trendline or supply area around 3333–3342.
📌 Trade Plan (Sell on Pullback)
Sell Limit: 3333–3342
SL: 3368
TP1: 3296
TP2: 3255
TP3: 3220
📊 Key Levels:
R2: 3342
R1: 3322
Pivot: 3295
S1: 3254
S2: 3214
S3: 3180
Summary: Wait for bearish confirmation at the supply zone before entering. Bias remains bearish until proven otherwise by a structural break above 3366. Use smaller lot size or scale in slowly if price approaches the sell zone with weak bullish momentum.
Gold Bounces Off Trendline as Bulls Defend Structure Ahead of $3Gold (XAU/USD) has rebounded sharply from its rising trendline support and 50-day SMA (around $3,221), suggesting that the broader bullish trend remains intact despite recent consolidation below the $3,430 resistance.
The uptrend from the December 2024 lows continues to hold, anchored by a sequence of higher lows and a clear ascending trendline. The recent dip toward the trendline was met with firm buying, resulting in a strong bullish candle on the daily chart. Price action now sets up a potential retest of the $3,430 horizontal resistance — a key level that has capped multiple rallies over the past few months.
Momentum indicators paint a mixed but improving picture. The RSI has bounced from just below 40 to 46.64, avoiding oversold territory and hinting at a potential momentum recovery. Meanwhile, the MACD remains in negative territory but is beginning to flatten, signaling a possible shift in short-term momentum.
A confirmed breakout above $3,430 would mark a resumption of the broader bullish leg and expose gold to new highs. However, a breakdown below trendline support would invalidate the current structure and shift focus toward the 200-day SMA near $2,924.
For now, the trendline bounce gives bulls the upper hand, keeping the upside scenario in play.
-MW

Go long on dips and short on rallies📰 News information:
1. Gold market liquidity at the end of the month
2. Impact of geopolitical situation
📈 Technical Analysis:
Last week we predicted that gold would rebound. Today, after gold rebounded as expected, we gave a short trading strategy. Gold fell precisely at the point we gave, 3295, and successfully hit our TP3280-3270. The result confirmed the correctness of our trading strategy. Next, we will focus on the long trading opportunities below 3270-3260.
🎯 Trading Points:
BUY 3270-3260
TP 3290-3300
SELL 3295-3300-3310
TP 3280-3270
In addition to investment, life also includes poetry, distant places, and Allen. Facing the market is actually facing yourself, correcting your shortcomings, confronting your mistakes, and strictly disciplining yourself. I hope my analysis can help you🌐.
TVC:GOLD FXOPEN:XAUUSD PEPPERSTONE:XAUUSD FX:XAUUSD FOREXCOM:XAUUSD OANDA:XAUUSD

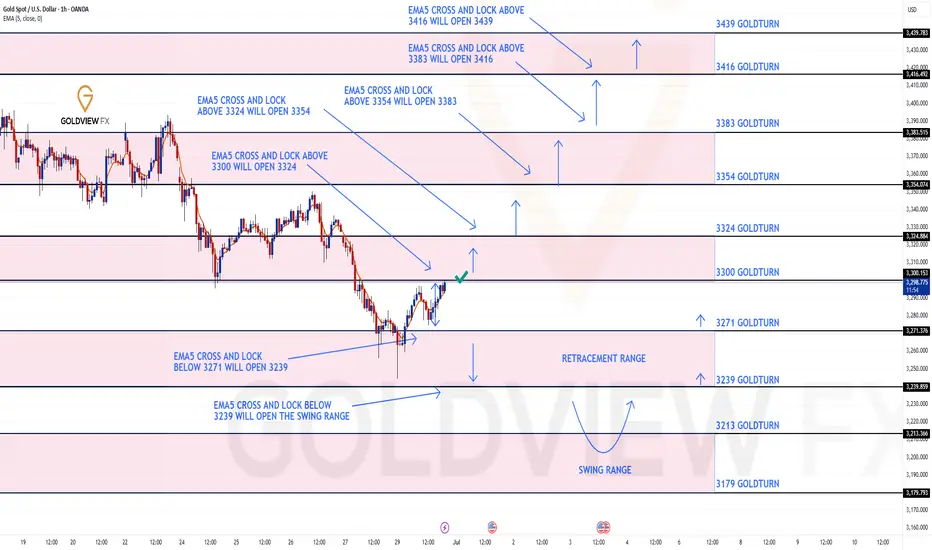
GOLD ROUTE MAP UPDATEHey Everyone,
Great start to the week with our Bullish target at 3300 hit perfectly!!!!
We will now look for ema5 cross and lock to confirm a continuation or failure to lock will follow with a rejection into the lower Goldturns for support and bounce.
We will see levels tested side by side until one of the weighted levels break and lock to confirm direction for the next range.
We will keep the above in mind when taking buys from dips. Our updated levels and weighted levels will allow us to track the movement down and then catch bounces up.
We will continue to buy dips using our support levels taking 20 to 40 pips. As stated before each of our level structures give 20 to 40 pip bounces, which is enough for a nice entry and exit. If you back test the levels we shared every week for the past 24 months, you can see how effectively they were used to trade with or against short/mid term swings and trends.
The swing range give bigger bounces then our weighted levels that's the difference between weighted levels and swing ranges.
BULLISH TARGET
3300 - DONE
EMA5 CROSS AND LOCK ABOVE 3300 WILL OPEN THE FOLLOWING BULLISH TARGETS
3324
EMA5 CROSS AND LOCK ABOVE 3324 WILL OPEN THE FOLLOWING BULLISH TARGET
3354
EMA5 CROSS AND LOCK ABOVE 3354 WILL OPEN THE FOLLOWING BULLISH TARGET
3383
BEARISH TARGETS
3271
EMA5 CROSS AND LOCK BELOW 3354 WILL OPEN THE FOLLOWING BEARISH TARGET
3239
EMA5 CROSS AND LOCK BELOW 3239 WILL OPEN THE SWING RANGE
3213
3179
As always, we will keep you all updated with regular updates throughout the week and how we manage the active ideas and setups. Thank you all for your likes, comments and follows, we really appreciate it!
Mr Gold
GoldViewFX
Gold 1H Intra-Day Chart 39.06.2025Option 1: Gold rejects from CMP or from $3,346 & drops towards $3,240.
Option 2: Gold keeps moving higher into another strong demand zone of $3,416.
Which scenario do you find more likely?

GOLD Short From Resistance! Sell!
Hello,Traders!
GOLD made a bullish
Rebound from the support
Below just as we predicted in
Our previous analysis but
Gold is still trading in the
Downtrend as the lower lows
And higher highs are intact
And the structure is healthy
So after the price retested the
Horizontal resistance above
Around 3,310$ we are
Likely to see a further
Bearish move down
Sell!
Comment and subscribe to help us grow!
Check out other forecasts below too!
Disclosure: I am part of Trade Nation's Influencer program and receive a monthly fee for using their TradingView charts in my analysis.

GOLD WILL FALL|SHORT|
✅GOLD is trading in a
Downtrend and the price is
Making a typical rebound but
After the horizontal resistance
Level above around 3,300$ is
Retested we will be expecting
A further bearish move down
SHORT🔥
✅Like and subscribe to never miss a new idea!✅
Disclosure: I am part of Trade Nation's Influencer program and receive a monthly fee for using their TradingView charts in my analysis.

GOLD LONG IDEA MARKET STRUCTURE CHANGEgold futures were on a full sell off due to ongoing global turbulence in the month of June macro news is there to show the bigger picture but price tells the full story
imbalance was filled and the week opened with a bearish candle closing above 3,250 COMEX:GC1! price range now it is time to see It play out to the buyside for the precious metal

GOLD XAUUSD potential 1-2 setup to downsideLooking at an potential 1-2 setup to the downside wave 3 of 5. adding to my previous gameplay

XAUUSD I Trade Update Welcome back! Let me know your thoughts in the comments!
** XAUUSD Analysis - Listen to video!
We recommend that you keep this pair on your watchlist and enter when the entry criteria of your strategy is met.
Please support this idea with a LIKE and COMMENT if you find it useful and Click "Follow" on our profile if you'd like these trade ideas delivered straight to your email in the future.
Thanks for your continued support!Welcome back! Let me know your thoughts in the comments!

Internal and external liquidity Here's another mechanical lesson for you.
In my last post I covered a mechanical technique to identify swing ranges. Rule-based, simple and repeatable.
In this post, I want to share another little technique, again part of the mechanical series. But this time I want to talk about liquidity.
Most traders talk about liquidity, they might even have a grasp of what it is. But most do not know how liquidity forms the sentiment and how that creates a type of algo for the market.
You might have heard of Elliott wave theory. There is a saying along the lines of "you ask 10 Elliott traders for their count and you get 11 answers".
But the point is here, when you simplify the concept, it's clear to see that sentiment caused by liquidity swings is what causes a repeatable pattern in the market.
Let's take the idea of the ranges from my last post.
Now after a fair amount of accumulation, this level becomes "defended" - the price will gradually move up until old short stop losses are tagged and new long entries are entered into.
This allows the institutional players to open up their orders without setting off the alarm bells.
Price then comes back from external liquidity to find internal liquidity (more on this in a later post).
But then it looks for the next fresh highs.
As the highs are put in, we can use the range technique to move our range to the new area as seen in the image above.
Next we will be looking for an internal move, not just internal to the range, but a fractal move on the smaller timeframe that drives the pullback down. See this in blue.
The logic here is simple; on the smaller timeframes we have witnessed an accumulation at the 2 region and as we spike up for 3; we will witness a distribution on the smaller timeframes.
Wyckoff called this the accumulation, followed by a mark-up and then the distribution and a mark-down.
It is this pattern, over and over again that leads to this type of structure.
This will then be re-branded by various analysts who will call it things like a head and shoulders, smart money will see a change of character and a retest before breaking the structure.
This is all the same thing - just a different naming convention.
Again, I hope this helps some of you out there!
Disclaimer
This idea does not constitute as financial advice. It is for educational purposes only, our principal trader has over 25 years' experience in stocks, ETF's, and Forex. Hence each trade setup might have different hold times, entry or exit conditions, and will vary from the post/idea shared here. You can use the information from this post to make your own trading plan for the instrument discussed. Trading carries a risk; a high percentage of retail traders lose money. Please keep this in mind when entering any trade. Stay safe.

GOLD - Price can grow to resistance line of wedge patternHi guys, this is my overview for XAUUSD, feel free to check it and write your feedback in comments👊
Some time ago price bounced from $3390 level and declined, but soon turned back and even entered to resistance area.
After this, the price dropped from this area and then started to grow inside the wedge, where it at once made an impulse up.
Price reached $3390 level one more time and broke it, after which it continued to grow to the resistance line of the wedge.
When it reached this line, price turned around and in a short time declined below $3390 level, breaking and then made a retest.
Later, Gold broke $3300 level and fell to the support line of the wedge, after which it rose to the resistance area.
Now I expect that Gold can make a correction to almost support line and then bounce up to $3320 resistance line of the wedge.
If this post is useful to you, you can support me with like/boost and advice in comments❤️
Disclaimer: As part of ThinkMarkets’ Influencer Program, I am sponsored to share and publish their charts in my analysis.

XAUUSD – June 30, 2025: Trade Strategy Right Now – Focus on SellGold OANDA:XAUUSD has been recovering slightly toward the 3,282 USD zone, but macroeconomic headwinds remain strong:
- The U.S. Dollar Index (DXY) TVC:DXY remains above 106.3 – the highest level in a month – making gold less attractive due to increased opportunity cost.
- U.S. 10-year Treasury yields remain firm around 4.35%, reflecting market expectations that the Fed will maintain tight monetary policy.
- Core PCE data for June remains elevated, far from the Fed's 2% target – lowering the likelihood of a rate cut anytime soon.
- Geopolitical tensions are cooling off, reducing demand for safe-haven assets like gold.
➡ These macro factors suggest that the current rebound in gold is more technical than fundamental, and unlikely to signal a major trend reversal.
1. Technical Analysis – XAUUSD OANDA:XAUUSD on D1 Timeframe
- After bouncing from 3,255 USD, price is now testing the 3,285 – 3,295 USD resistance zone.
- This is a Fibonacci retracement zone (0.5 – 0.618) from the previous bearish leg 3,314 → 3,255.
- EMA20 and EMA50 remain downward-sloping, signaling that the dominant trend is still bearish.
- RSI is hovering around 52, suggesting mild momentum but not enough for a confirmed bullish reversal.
➡ The current price behavior aligns with a pullback within a downtrend, with potential for continuation to the downside.
2. Trade Setup – Short-Term Sell Strategy
Primary Setup: Sell the Rally
Entry: Sell near 3,294 – 3,295
Stop Loss: 3,300
Take Profit 1: 3,260
Take Profit 2: 3,244
Take Profit 3: 3,225
Ps: Gold OANDA:XAUUSD is showing signs of a technical bounce, but fundamentals and structure still support the downtrend. Selling at resistance remains the preferred strategy as long as macro pressure persists.
The strategy will be updated continuously – don't forget to save and follow to avoid missing key opportunities.
Analysis by @Henrybillion

Gold: Eyes on QML Zone for Potential Reaction Before Deeper DropHello guys!
Let's go deep into the GOLD chart!
Price has completed a liquidity grab near 3440 (marked as "a hunting") and is now heading downward toward a key QML zone.
First, a reaction is expected around the QML area (3180–3220), where previous structural interest and demand may cause a temporary bounce.
After this reaction, the price is likely to retest higher, potentially forming a lower high.
Then, the dominant bearish structure is expected to continue, with a possible sharp drop toward the final demand zone around 3050–3080.
This movement represents a classic manipulation.

XAUUSD: Market analysis and strategy on June 30Gold technical analysis
Daily chart resistance 3350, support 3225
4-hour chart resistance 3310, support 3245
1-hour chart resistance 3295, support 3260
From the 4-hour level, after gold fell to 3255 last Friday, the real candlestick chart was difficult to continue to fall, suggesting that the downward momentum has slowed down. It is necessary to pay attention to the possibility of double bottom support at 3245. At the same time, this is also the 0.618 support level of the golden section of the 3120-3452 band. With the MACD showing signs of bottom divergence, short-term operations are bearish, but the probability of rebound is also very high. The short-term support position below the market is near 3281, and the break will look at 3260-3247; the important pressure position is near 3295; the break will look at 3309-3313!
BUY: 3281near
BUY: 3260near
BUY: 3245near

HelenP. I Gold may retest resistance before dropping to $3230Hi folks today I'm prepared for you Gold analytics. If we look at the chart, we can see that after a period of sideways consolidation, gold started to form lower highs under a descending trend line. Each time the price approached this trend line, it was rejected, confirming strong bearish pressure. Most recently, XAUUSD broke below the support-turned-resistance level around 3295, entering the lower resistance zone. Now, the price is trading just under this area, which has acted as a strong supply zone in the past. Given the current technical setup, I expect that gold may show a minor upward move to retest the resistance zone between 3285 - 3295. However, this retest is likely to act as a trigger for sellers to step back in. The prevailing downtrend and repeated failures to break the trend line suggest further weakness ahead. That’s why I’ve placed my target at 3230 points - a level that aligns with the next major support on the chart. This area could provide the next bounce opportunity, but for now, the bearish structure remains dominant. If you like my analytics you may support me with your like/comment ❤️
Disclaimer: As part of ThinkMarkets’ Influencer Program, I am sponsored to share and publish their charts in my analysis.

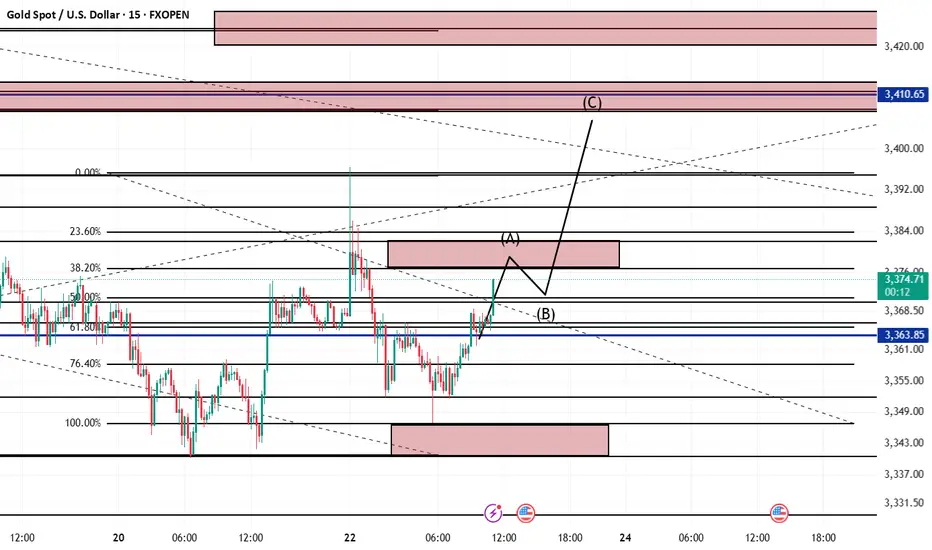
GOLD Analysis 23/6/2025Based on gold analysis using digital analysis, gold is rising to target the 3377-3387 zone,
then rebound and then target the 3410-3426 zone .