$XAUTUSDt 300625 TRADE SETUPWaiting for Price to show its hand, then I'll take a Trade.
Overall 🔺BULLISH; anticipating the PWL to be souped where I will start hunting Entries to LONG.
For Entertainment. Not a Financial/Investment Advice.
What's your view❓
Metals

XAUUSD 4hour TF - June 29th, 2025XAUUSD 4hour Neutral Idea
Monthly - Bullish
Weekly - Bullish
Daily - Bullish
4hour - Bearish
Gold has been on the rally of a century for a while and isn’t showing too many signs of slowing down long term. For now we do have a couple opportunities I can bring to your attention.
4hour bearish continuation - For this to happen we would like to see price action come back to our pocket of confluence near the 3,320.000 level followed by bearish conviction. If this happens look to target lower toward major support levels like 3,225.500.
4hour trend reversal - If we are to see a reversal of the 4hour trend we would need to see price action pop back above the 3,320.000 resistance area. Look for strong bullish conviction above this level and target higher toward appropriate levels of resistance.

Will Gold Break out for the New Month this week?I was anticipating these possible sweeps. with it being the end of the month I'm thinking I might need to do more watching for now than positioning. waiting for the market to show its hand on what it wants to do next.

XAUUSD Analysis – June Monthly CloseGold starts the week with a weak bounce attempt after a strong bearish momentum on Friday, which pushed the market below the key 3254 support. The downtrend structure remains valid with a clear pattern of lower highs and lower lows on the 4H chart.
At the moment, price is trapped inside the 3254–3295 range. Despite the strong bearish pressure, we have yet to see a meaningful correction after the sharp drop on June 28th. This opens the door for a potential intraday pullback to test minor supply and moving average resistance near 3291–3297.
However, today is monthly candle close, which means increased volatility and possible false breakouts—especially during US sessions. Traders should be cautious with breakout traps, especially around 3305–3310, where stop hunting might occur.
The bigger picture still favors the bears unless gold manages to break and hold above the descending trendline and the EMA cluster.
📌 Trade Setup (Short Bias – Intraday Correction)
SELL zone: 3291 – 3297
SL: 3303 (Above supply & EMA test zone)
TP1: 3278
TP2: 3255
TP3: 3215
This is not a high-conviction swing setup but a tactical short based on potential rejection from previous supply and dynamic resistance. Small lot size is recommended due to the wider stop-loss and low R/R reward unless high volatility plays in our favor.
📊 Key Intraday Levels
R3: 3342
R2: 3322
R1: 3295
Pivot: 3254
S1: 3214
S2: 3180
S3: 3123

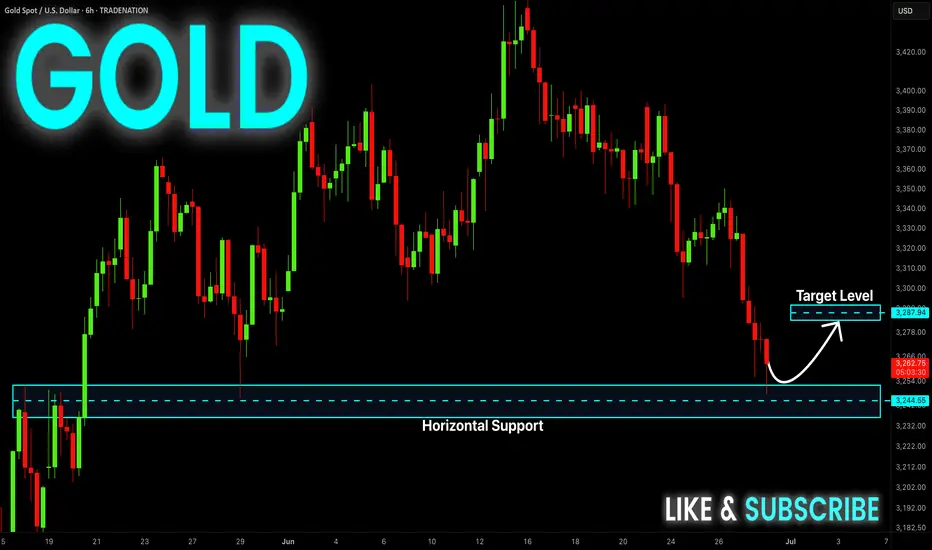
GOLD Support Ahead! Buy!
Hello,Traders!
GOLD keeps falling just
As I predicted but the price
Will soon hit a horizontal support
Around 3235$ from where we
Will be expecting a local
Bullish rebound
Buy!
Comment and subscribe to help us grow!
Check out other forecasts below too!
Disclosure: I am part of Trade Nation's Influencer program and receive a monthly fee for using their TradingView charts in my analysis.
Risk On! Buy Stock Indices, Sell Gold, Silver.In this Weekly Market Forecast, we will analyze the S&P 500, NASDAQ, DOW JONES, Gold and Silver futures, for the week of June 29 - July 4th..
Stock Indices are pointed to the all time highs. Take advantage of the "risk on" environment while it lasts!
Gold and Silver have seen the outflows and profit taking... so look for lower prices this week.
Oil ... be patient. After a huge dump in prices when the tensions eased up between Israel/US and Iran, price is moving sideways in consolidation. I suspect lower prices to come, but I urge patience! Wait for the signature of price to show it intends to move lower. A sweep of the range highs and a run of the range lows right after... is the signal to sell.
Enjoy!
May profits be upon you.
Leave any questions or comments in the comment section.
I appreciate any feedback from my viewers!
Like and/or subscribe if you want more accurate analysis.
Thank you so much!
Disclaimer:
I do not provide personal investment advice and I am not a qualified licensed investment advisor.
All information found here, including any ideas, opinions, views, predictions, forecasts, commentaries, suggestions, expressed or implied herein, are for informational, entertainment or educational purposes only and should not be construed as personal investment advice. While the information provided is believed to be accurate, it may include errors or inaccuracies.
I will not and cannot be held liable for any actions you take as a result of anything you read here.
Conduct your own due diligence, or consult a licensed financial advisor or broker before making any and all investment decisions. Any investments, trades, speculations, or decisions made on the basis of any information found on this channel, expressed or implied herein, are committed at your own risk, financial or otherwise.

XAU/USD) bearish Trand analysis Read The captionSMC trading point update
Technical analysis of (XAU/USD) on a short-term timeframe, incorporating several key tools and concepts:
---
Overview of the Analysis
Price Level (Current): Around $3,273.40
EMA 200 (Blue Line): Around $3,337.95 (signaling broader trend)
Resistance Zone (Yellow Box): Between approximately $3,300–$3,320
Support/Target Zone: Around $3,231.11
RSI (Relative Strength Index): At 32.88, which is near oversold territory (below 30)
---
Interpretation of Chart Structure
1. Descending Channel:
Price is moving within a downward-sloping channel.
Suggests a bearish trend is in play.
2. Resistance Level (Yellow Box):
Price is expected to retest this area and face resistance.
Confluence of a supply zone and upper trendline, reinforcing its strength.
3. Projected Price Action:
Price may climb back up into the resistance zone.
A rejection is anticipated, leading to another leg down.
The target is around $3,231.11, which matches previous measured moves.
4. Measured Moves (Blue Arrows):
Highlights historical price drops of ~79 points.
Repeating this pattern suggests symmetry and continuation.
5. RSI Indicator:
Currently at 32.88: nearing oversold, but not quite.
No clear bullish divergence, so price could drop further.
---
Trade Idea Summary
Bias: Bearish
Entry Zone: Near $3,300–$3,320 (resistance)
Target: Around $3,231.11
Invalidation: If price breaks and holds above $3,337–$3,340 (EMA 200 and channel breakout)
Mr SMC Trading point
---
Caution/Considerations
Watch for false breakouts above the resistance zone.
Monitor RSI for potential bullish divergence that could invalidate the downside.
Be cautious around the U.S. economic news event icon, which might cause volatility.
plesse support boost 🚀 this analysis)

Gold | Oil | Dollar | Silver | Natural Gas Price Forecast.Gold | Oil | Dollar | Silver | Natural Gas Price Forecast.
NYMEX:NG1! COMEX:GC1! AMEX:UNG COMEX:SI1!

Navigating Gold Futures: Support, Resistance, and ProjectionsCOMEX:GC1!
The chart appears to depict a clear five-wave pattern: I, II, III, IV, and V.
Waves I to III show strong upward movements, indicating bullish sentiment.
Wave IV looks like it could be a corrective phase, with a potential dip before another upward movement in Wave V.
Support and Resistance Levels:
The horizontal lines around 2,800 and 2,575.3 indicate critical Fibonacci retracement levels (38.20% and 50%).
If the price approaches these levels during the correction, they could serve as support, making it a potential buying opportunity.
RSI Indicator:
From the bottom indicator (RSI), we can see fluctuations in momentum, which can aid in timing trades.
Look for interpretations of the RSI: if it trends towards the extremes (overbought/oversold), that could signal reversal points.
Future Projections:
Should the market respect the outlined support levels, Wave V could potentially push towards a new high above 4,000 as indicated by the upward projection.
Market Sentiment:
Overall, the pattern suggests a bullish outlook long-term, but caution is warranted during corrective phases as prices might retrace towards support levels.

Skeptic | Gold (XAU/USD) Watchlist: Key Triggers for the WeekLast week, our XAU/USD short trigger from the previous watchlist activated cleanly, driving a strong downward move. Now, let’s unpack the Daily and 4-Hour timeframes to pinpoint the Low Wave Cycle (LWC) and lock in new long and short triggers for the week ahead. Here’s the no-nonsense breakdown to keep you ahead of the game. 📊
Daily Timeframe: The Big Picture
On the Daily chart, Gold pulled off an intriguing move last week. After breaking the ceiling of a previous downward channel, I cloned that channel and placed it above the prior one. Price reacted perfectly to the channel’s midline and is now heading toward the channel floor. Overall, the Daily trend is range-bound, likely ranging between 3125 and 3445. However, the Higher Wave Cycle (HWC) on the Weekly timeframe remains uptrend, so we focus on the Low Wave Cycle (LWC) for our setups.
Key Insight: The range-bound Daily suggests consolidation, but the Weekly uptrend keeps the bigger picture bullish. Prioritize LWC for precise entries.
4-Hour Timeframe: Long & Short Triggers
Zooming into the 4-Hour chart, let’s identify the LWC and set our long and short triggers:
Short Trigger: A break below the 4-hour support at 3255.71 could drive price back to the channel floor, potentially re-entering the previous downward channel. This is the safer play, aligning with recent momentum.
Long Trigger: A break above resistance at 3336.81 is the initial trigger, but the primary long trigger is a break of 3396.50 . This is riskier due to the range-bound Daily , so use a tighter stop-loss and take profits quickly to avoid choppy reversals.
Pro Tip: Shorts are stronger given the recent downward momentum. For longs, expect volatility—set conservative stops to dodge stop-loss hunts in the range.
Final Vibe Check
This Gold Watchlist equips you to trade smarter, not harder. With XAU/USD in a Daily range but a Weekly uptrend, patience for clear triggers at 3255.71 (short) and 3396.50 (long) will maximize your edge. I’ll keep you updated daily as the market evolves. Protect your capital—stick to 1%–2% risk per trade, no exceptions. Want more on HWC/LWC strategies or another pair? Drop it in the comments! If this analysis sharpened your game, hit that boost—it fuels my mission! 😊 Stay disciplined, fam! ✌️
💬 Let’s Talk!
Which Gold trigger are you eyeing? Share your thoughts in the comments, and let’s crush it together!

GOLD BUY + SHORT TRADE IDEA Buy Signals !
We Are Looking For Buy trade Reasons : Consolidating Upto Demand Thats We Are Looking For A Bullish Move to Supply Zone
Buy Zone : 3269-3263
Targets : 3300/3325
SL : 3255
Sell Signal !
We Are Looking For Best Sell Trade Reasons : Order Block H1 + H4 Thats We Are Take Sell With Best Entry With High Target Sell Side Liquidity
Sell Zone : 3327-3334
Target Sell Side Liquidity - 3245-3250
SL 3345

"The Vault is Open!" - Time to Steal Silver Pips🔥 XAG/USD SILVER HEIST: Bearish Raid in Progress! (Short Setup) 🔥
🦹♂️ ATTENTION SILVER BANDITS!
To the Metals Mercenaries & Risk-Takers! 💰🔪
Using our 🔥Thief Trading Tactics🔥, we're executing a bearish raid on XAG/USD - this is not advice, just a strategic robbery plan for traders who play to win.
📉 THE SILVER VAULT BREAK-IN (SHORT ENTRY PLAN)
🎯 Loot Zone: 34.500 (or escape earlier if bulls fight back)
💣 High-Stakes Play: Perfect pullback to steal pips
👮♂️ Cop Trap: Where bulls get liquidated
🔪 ENTRY RULES:
"Vault Breach Confirmed!" - Strike at pullback to nearest swing high/low (15-30min TF)
Sell Limit Orders for optimal risk/reward
Aggressive? Enter at market but watch gold correlation
📌 SET ALERTS! Don't miss the rejection
🚨 STOP LOSS (Escape Plan):
Thief SL at 36.400 (Key swing level)
⚠️ Warning: "Ignore this SL? Enjoy donating to bulls."
🎯 TARGETS:
Main Take-Profit: 34.500
Scalpers: Ride the NY session momentum
🔍 WHY THIS HEIST WORKS
✅ Industrial demand slowing
✅ Dollar strength crushing metals
✅ ETF outflows accelerating
✅ Technical rejection at key level
🚨 RISK WARNING
Avoid FOMC/NFP periods (Silver loves volatility)
Trailing stops = your escape plan
💎 BOOST THIS HEIST!
👍 Smash Like to fund our next raid!
🔁 Share to build our thief army!
🤑 See you at 34.500, bandits!
⚖️ DISCLAIMER: Hypothetical scenario. Trade at your own risk.
#XAGUSD #SilverTrading #Commodities #ThiefTrading
💬 COMMENT: "Short already - or waiting for better entry?"* 👇🔥

XAUUSD 30/6 – 4/7/2025: Selling Pressure Builds - In the past week, gold OANDA:XAUUSD has been under consistent selling pressure due to the following key macro factors:
- The U.S. Dollar Index (DXY) TVC:DXY surged, raising the opportunity cost of holding gold and leading to widespread sell-offs.
- 10-year U.S. Treasury yields hovered around 4.30%–4.35% , reinforcing expectations that the Fed will keep rates higher for longer.
- Core PCE data for June indicated that inflation remains elevated, reducing the likelihood of imminent rate cuts by the Federal Reserve.
- Geopolitical tensions in the Middle East have temporarily eased, diminishing gold’s safe-haven appeal in the short term.
➤ As a result, these combined factors are applying downward pressure on XAUUSD, especially after price decisively broke the 3,300 USD support zone.
1. Technical Analysis of XAUUSD – Daily Timeframe
On the D1 chart:
- Price has broken below the key support zone 3,300 – 3,331 USD, confirming a short-term bearish structure.
- The Fibonacci retracement from the 3,399 peak to the 3,295 low has completed its pullback to the 0.5–0.618 zone (3,345 – 3,359 ) but was strongly rejected by sellers.
- Price is now trading below both EMA20 and EMA50, indicating strong bearish momentum.
- RSI has turned back under 50 and has not yet reached oversold territory, suggesting further downside potential exists.
2. Key Resistance and Support Zones for XAUUSD
Technical Role ( 3,345 – 3,359 )
- Major confluence resistance (Fibonacci 0.618 + supply) ( 3,295 – 3,300 )
- Immediate resistance zone (post-breakdown retest) ( 3,260 – 3,235 )
- Short-term support and potential buy interest ( 3,223 – 3,205 )
- Strong medium-term support (Fibonacci 1.0 + April lows)
3. Trading Strategy for XAUUSD This Week (30/6 – 4/7/2025)
Strategy 1 – Favor Short Positions Aligned with Bearish Momentum
Entry: Sell near 3,295 – 3,300 (anticipating resistance retest)
Stop Loss: 3,304
Take Profit 1: 3,290
Take Profit 2: 3,285
Take Profit 3: 3,275
Strategy 2 – Countertrend Buy at Key Support with Confirmation
Entry: Buy near 3,235 – 3,240 only if bullish reversal candles (pin bar or bullish engulfing) appear on H4 or D1
Stop Loss: 3,230
Take Profit 1: 3,245
Take Profit 2: 3,250
Take Profit 3: 3,260
Ps : XAUUSD is currently in a downward correction phase, with the next target zone lying between 3,235 – 3,260 USD. The inability to hold above 3,300 confirms that sellers remain in control. The most favorable approach this week is to sell on rallies, especially near former support-turned-resistance zones.
Stay vigilant, follow updated price action closely, and strictly manage risk to protect your capital.
Follow for more high-probability strategies throughout the week – and save this idea if you find it valuable to your trading journey.
Analysis by @Henrybillion

Silver is in the Bearish trend after testing ResistanceHello Traders
In This Chart XAGUSD HOURLY Forex Forecast By FOREX PLANET
today XAGUSD analysis 👆
🟢This Chart includes_ (XAGUSD market update)
🟢What is The Next Opportunity on XAGUSD Market
🟢how to Enter to the Valid Entry With Assurance Profit
This CHART is For Trader's that Want to Improve Their Technical Analysis Skills and Their Trading By Understanding How To Analyze The Market Using Multiple Timeframes and Understanding The Bigger Picture on the Charts

"Stealing Gold Profits: XAU/USD Long Setup (Risk-Reward Heist)"🔥 GOLD HEIST ALERT: XAU/USD Breakout Robbery Plan (Long Setup) 🔥
🌟 Hi! Hola! Ola! Bonjour! Hallo! Marhaba! 🌟
Attention, Money Makers & Market Robbers! 🤑💰💸✈️
Based on the 🔥Thief Trading Style🔥 (technical + fundamental analysis), we’re plotting a heist on XAU/USD (GOLD). Follow this master plan for a bullish escape near the high-risk ATR zone. Beware—overbought signals, consolidation traps, and bearish robbers lurk! Take profits fast and treat yourself—you’ve earned it! 🏆💸
📈 ENTRY: THE HEIST BEGINS!
Wait for Resistance Breakout (3400.00) → Then strike!
Buy Stop Orders: Place above Moving Average.
Buy Limit Orders: Use 15M/30M pullbacks (swing lows/highs).
Pro Tip: Set a chart ALERT to catch the breakout live!
🛑 STOP LOSS: DON’T GET CAUGHT!
For Buy Stop Orders: Never set SL before breakout!
Thief’s SL Spot: Recent swing low (4H timeframe).
Adjust SL based on your risk, lot size, and order count.
Rebel Traders: Place SL wherever—but you’ve been warned! 🔥
🏴☠️ TARGET: 3480.00
Scalpers: Long-only! Use trailing SL to lock profits.
Swing Traders: Join the robbery crew for bigger gains.
📊 MARKET CONTEXT:
XAU/USD is neutral but primed for bullish moves 🐂. Watch:
Fundamentals (COT Reports, GeoPolitics, News).
Intermarket Trends & Sentiment.
Positioning & Future Targets (Check our bio0 for analysis linkss!).
⚠️ TRADING ALERTS:
News Releases = High Volatility!
Avoid new trades during major news.
Use Trailing SL to protect open positions.
💥 SUPPORT THE HEIST!
Hit the Boost Button 💖→ Strengthen our robbery team!
Profit daily with the Thief Trading Style. 🏆💪🚀
Stay tuned for the next heist—more loot awaits! 🤑🐱👤🎉

SILVER Sellers In Panic! BUY!
My dear friends,
Please, find my technical outlook for SILVER below:
The price is coiling around a solid key level - 35.993
Bias -Bullish
Technical Indicators: Pivot Points Low anticipates a potential price reversal.
Super trend shows a clear buy, giving a perfect indicators' convergence.
Goal - 36.378
About Used Indicators:
The pivot point itself is simply the average of the high, low and closing prices from the previous trading day.
Disclosure: I am part of Trade Nation's Influencer program and receive a monthly fee for using their TradingView charts in my analysis.
———————————
WISH YOU ALL LUCK

GOLD 4H CHART ROUTE MAP UPDATE & TRADING PLAN FOR THE WEEKHey Everyone,
Please see our updated 4h chart levels and targets for the coming week.
We are seeing price play between two weighted levels with a gap above at 3301 and a gap below at 3242. We will need to see ema5 cross and lock on either weighted level to determine the next range.
We will see levels tested side by side until one of the weighted levels break and lock to confirm direction for the next range.
We will keep the above in mind when taking buys from dips. Our updated levels and weighted levels will allow us to track the movement down and then catch bounces up.
We will continue to buy dips using our support levels taking 20 to 40 pips. As stated before each of our level structures give 20 to 40 pip bounces, which is enough for a nice entry and exit. If you back test the levels we shared every week for the past 24 months, you can see how effectively they were used to trade with or against short/mid term swings and trends.
The swing range give bigger bounces then our weighted levels that's the difference between weighted levels and swing ranges.
BULLISH TARGET
3301
EMA5 CROSS AND LOCK ABOVE 3301 WILL OPEN THE FOLLOWING BULLISH TARGETS
3370
EMA5 CROSS AND LOCK ABOVE 3370 WILL OPEN THE FOLLOWING BULLISH TARGET
3429
EMA5 CROSS AND LOCK ABOVE 3429 WILL OPEN THE FOLLOWING BULLISH TARGET
3499
BEARISH TARGETS
3242
EMA5 CROSS AND LOCK BELOW 3242 WILL OPEN THE FOLLOWING BEARISH TARGET
3171
EMA5 CROSS AND LOCK BELOW 3171 WILL OPEN THE SWING RANGE
3089
3171
EMA5 CROSS AND LOCK BELOW 3171 WILL OPEN THE SECONDARY SWING RANGE
3089
3001
As always, we will keep you all updated with regular updates throughout the week and how we manage the active ideas and setups. Thank you all for your likes, comments and follows, we really appreciate it!
Mr Gold
GoldViewFX

GOLD DAILY CHART ROUTE MAPHey Everyone,
Following up on our previous Goldturn channel post – the recent price action has played out exactly as anticipated. We saw a clean rejection at the channel top around 3433, with price failing to lock above and confirming that resistance is still very much in control at the range ceiling.
This rejection was perfect and it led to a decisive move back down into the 3272 Goldturn support. This level is now acting as a critical pivot. From here, we’re watching closely for one of two outcomes:
1. Bounce Scenario: If price holds and we see a supportive reaction from 3272, particularly with no EMA5 cross and lock confirmation, we will look for long opportunities to slowly ascend the channel again. Expect a grind with testing of in-between levels as structure develops.
2. Breakdown Scenario: If 3272 fails to hold, we expect the next key test to occur at the channel’s midline – a level that has acted as support. A further breakdown would likely target 3106, our next Goldturn support zone, for potential reversal setups.
This price action continues to validate the effectiveness of the Goldturn channel structure keeping us grounded and responsive rather than reactive.
We remain focused on level to level trading, guided by the channel and supported by EMA5 confirmations for directional analysis.
Key Levels to Watch:
Resistance: 3433
Support: 3272 (current test), 3106 (if breakdown continues)
Stay patient and let price confirm. The best trades continue to come from structure respecting reactions, not from chasing.
Mr Gold
GoldViewFX

GOLD WEEKLY CHART MID/LONG TERM ROUTE MAPHey Everyone,
Follow up on our Weekly Goldturn channel outlook.
Last week’s action delivered the rejection at the channel top, right in line with expectations. Importantly, we did not get an EMA5 lock confirmation, reinforcing the rejection. We still have the previous weekly candle body close above 3387, leaving the gap at 3482 active and exposed overhead.
The early rejection saw a swift retrace into the 3281 Goldturn axis support, where price is currently attempting to stabilise. This is a pivotal level. From here, we are watching two potential paths unfold:
1. Bounce Scenario: If 3281 holds and buyers step in, we’ll look for a gradual climb within the channel, testing key in between levels. EMA5 cross and lock confirmation will be key for directional bias. A reclaim and continuation higher keeps the 3482 gap firmly in play as a target.
2. Breakdown Scenario: If 3281 gives way, we have a body close gap to the channel mid-line, which becomes the next key level for potential support and Goldturn reaction. A move into this area could offer another structured long opportunity, aligned with the overall bullish framework.
Despite the rejection at the highs, the broader channel structure remains intact, and the longer term outlook still favours a measured move up level by level, using Goldturn levels and EMA5 as our compass.
Key Focus:
Support: 3281 → Channel Half-line (if broken)
Resistance: 3387 → 3482 (gap target)
We remain patient and continue reacting to clean structure backed opportunities.
Mr Gold
GoldViewFX

Gold Bull Markets: Long-Term Overview & Current Market UpdateGold Bull Markets: Long-Term Overview & Current Market Update (2024–2025)
________________________________________
🏆 Historic Gold Bull Markets: Timeline & Stats
1️⃣ 1968–1980 “Super Bull”
• Start/End: 1968 ($35) → 1980 ($850)
• Total Gain: ~2,330%
• Key Drivers:
o End of the gold standard (Bretton Woods collapse)
o Double-digit inflation, oil shocks
o Political/economic turmoil (Vietnam, stagflation)
• Correction:
o Nearly –45% drop (1974–1976)
• Recovery:
o Took years; massive rebounds afterward
2️⃣ 1999–2012 Bull Market
• Start/End: 1999 ($252) → 2012 ($1,920)
• Total Gain: ~650%
• Key Drivers:
o Commodities supercycle
o Emerging market demand
o US dollar weakness, financial crisis fears
• Correction:
o ~–30% during 2008 crisis, but fast recovery
• Recovery:
o Rebounded quickly after 2008, then peaked in 2011–12
3️⃣ 2016/2018–2027 (Current Cycle)
• Start/End: 2016/2018 ($1,050–$1,200) → ongoing ($3,500+)
• Key Drivers:
o Record central bank buying
o Persistent inflation & low real rates
o Geopolitical instability (Russia/Ukraine, China/US, etc.)
• Correction:
o Only –20% drawdown in 2022; quick recovery
o Broke 13-year technical “cup-and-handle” base in 2024
________________________________________
📊 Current Bull Market Stats (2025) – At a Glance
Metric 1968–80 Super Bull 1999–2012 Bull 2018–2025 Current Bull
🚀 Total Gain ~2,330% ~650% ~200% so far
⏲️ Duration 12 years 13 years 7–9 years so far
💔 Max Drawdown –45% (1974–76) –30% (2008) –20% (2022)
🏦 Central Bank Role Moderate Emerging Dominant
📉 Correction Recovery Years 4 years Months
🏛️ Technical Pattern Secular breakout Multiple peaks 13-yr base breakout
________________________________________
📈 Top 10 Stats of the Current Gold Bull Market (2025):
1. Gold Price:
o ~$3,338–$3,364/oz; ATH > $3,500 in April 2025
2. Year-to-Date Gain:
o +29% YTD (2025); +30% in 2024
3. Central Bank Demand:
o 1,000 tonnes bought for 4th straight year; reserves near records
4. Inflation Hedge:
o Strong negative correlation with real yields; safe-haven demand up
5. Gold vs S&P 500:
o Gold +27% YTD; S&P 500 up only ~2%
6. Jewelry Demand:
o Down –9% in 2024, projected –16% in 2025 (high prices suppress demand)
7. Gold-Silver Ratio:
o Now ~94 (down from 105); silver catching up
8. Record Closes:
o Over 40 daily record closes in 2025; price consolidating near highs
9. Technical Breakout:
o 13-year “cup-and-handle” breakout (March 2024)
10. 2025 Forecasts:
• Range: $3,600–$4,000 by Q2 2026; some see $4,500+ if risks persist
________________________________________
🔄 How This Bull Market Stands Out
• Dominance of Central Banks:
Central banks are setting the pace—record demand, making gold a reserve anchor again.
• Faster Recovery:
Corrections are less severe, recoveries are quick (months, not years).
• Synchronized Rally with Equities:
Rare for gold and stocks to hit highs together—shows systemic confidence in gold.
• Technical Breakout:
13-year base break signals powerful, long-term momentum.
• Future Outlook:
Targets as high as $7,500/oz (650% from cycle lows) possible by 2026/27, if historical analogs play out.
________________________________________
⭐️ Recommended Strategy (2025 and Beyond)
• BUY/HOLD/ACCUMULATE on Dips:
Favor physical gold, gold ETFs (GLD), and miners (GDX).
• Physical Over Paper:
Preference for allocated, physical bullion amid rising counterparty risks.
• Diversify with Miners/Silver:
Gold-silver ratio suggests silver may offer leverage; quality miners benefit in the latter stage of bull runs.
• Long-Term Perspective:
Anticipate volatility, but higher highs are likely if macro themes persist.
________________________________________
🧭 Summary Table: Historic vs Current Bull Markets
Feature 1968–80 1999–2012 2016/18–2027
Total Gain 2,330% 650% 200%+ (so far)
Duration 12 yrs 13 yrs 7–9 yrs (so far)
Correction –45% –30% –20%
Main Buyer Retail Funds Central Banks
Pattern Parabolic Cyclical Cup & Handle
Key Risks Inflation USD/credit Inflation, war, geopolitics
________________________________________
Key Takeaways
• Gold’s current bull market is distinguished by relentless central bank demand, robust technical momentum, and swift recoveries from corrections.
• The macro backdrop—persistent inflation, global uncertainty, and sovereign de-dollarization—supports an extended cycle.
• Expectations for $4,000+ gold in the next 12–24 months are widely held, with even higher targets in a true global crisis.

H4 Outlook | XAUUSD Monday • June 30 • 2025Hey fam,
Fresh week on gold — clean structure, clean levels, clean execution ahead. Forget the noise. We trade price, we trust precision.
🔍 Market Flow & Bias
Gold remains bearish on the H4 timeframe.
Lower highs, lower lows, clean rejection from supply, and all EMAs (21/50/200) aligned down. RSI hovers near 30, showing heavy momentum — not exhaustion yet.
Price is coiled, not crushed. If structure holds, we follow the short flow into deeper zones.
📌 Bias: Bearish below 3325. Pullbacks into supply = opportunity.
—
🧱 Zones of Interest (Clean & Confluent)
🔺 Zone 1 – 3380–3405 | Extreme Supply
Top OB zone with resting liquidity above. If price sweeps this level and fails, expect a sharp reversal. Only valid with reaction (CHoCH or bearish engulfing).
🔺 Zone 2 – 3325–3350 | Main Supply
Strong H4 breaker block. Origin of the last major selloff. Already defended once — if it holds again, look for sniper shorts from within.
🔺 Zone 3 – 3285–3305 | Frontline Supply
First inducement zone. Clean micro-OB that could give early fade trades. If bulls break through, Zone 2 becomes magnet.
⚖️ Zone 4 – 3260–3240 | Flip Shelf
Range base. If price holds, bulls might step in short-term. But a clean break below shifts momentum fully toward lower demand.
🟢 Zone 5 – 3215–3195 | Main Demand
Unmitigated OB with imbalance. If gold drops here with momentum and forms rejection wicks or CHoCH on LTF → long opportunity for bounce.
🟢 Zone 6 – 3150–3120 | Extreme Demand
Macro swing demand. Deepest discount level on the chart. Valid only if market flushes — this is the “last stand” for buyers.
—
🎯 Key Levels Zone Cheat-Sheet
Above
• 3380–3405 → Extreme Supply (trap zone)
• 3325–3350 → Main Supply block
• 3285–3305 → Micro OB inducement
Below
• 3260–3240 → Flip shelf (structural pivot)
• 3215–3195 → Main buy zone
• 3150–3120 → Deep macro demand
—
⚔️ Execution Plan
We sell from reaction zones, not assumptions.
We buy from confluence, not hope.
Every zone above comes with condition: no confirmation, no entry.
—
📣 Found this useful?
Drop a ⚔️ in the comments, tag your bias, 🚀and follow GoldFxMinds for sniper-level execution.
This isn’t guessing. This is structure. This is clarity.

Daily Outlook | XAUUSD June 30, 2025Hey traders,
Fresh week, clean structure. Let’s lock in the key levels and let price do the talking.
🌐 Macro Context
It’s a heavy week for USD – all major data drops before Friday:
Tuesday: ISM Manufacturing + Powell speaks
Wednesday: ADP Employment
Thursday: NFP, Unemployment Rate, ISM Services
Friday: US holiday – markets closed
📌 This means liquidity will build into Thursday, then fade. Expect gold to stay range-bound early in the week, unless momentum shifts hard today. Volatility should peak around NFP.
🧭 Daily Structure & Bias
Gold opened weak under 3287, still below 21EMA and 50EMA. The structure shows lower highs, bearish control, and no signs of strength reclaiming ground. RSI is at 42 — momentum down, but not oversold yet. Unless price breaks back above 3340, sellers stay in control.
✅ D1 Bias: Bearish while under 3340
📌 Key D1 Zones to Watch
🔺 D1 Breaker Block – 3340–3355
Former support, now clean resistance. Includes 50EMA and last failed closes. If price rejects again here, bearish continuation likely. A daily close above 3355 flips short bias.
🔺 D1 Supply + FVG – 3385–3405
Unmitigated imbalance from early June. If price pushes through 3355, this is the next upside magnet. Good spot for first reaction.
⚖️ D1 Decision Zone – 3287–3265
Current price zone. Multiple past reactions. A daily close below 3265 confirms breakdown. Holding above = more choppy range.
🟢 D1 Reaction Shelf – 3210–3180
Minor support zone from April candle bodies. Can slow price, but not strong enough for reversal on its own.
🟢 D1 Demand Block – 3155–3120
First major HTF demand. Includes 200EMA, strong structure, and previous breakout base. If price sells into it fast, watch for rejection — but only with confirmation.
🟢 D1 Macro Demand – 3090–3055
Final line of macro defense. Clean imbalance + demand from February. Valid only if sentiment breaks post-NFP.
✅ Final Summary
• Below 3265 = structure breaks → opens 3180
• 3155–3120 = real support zone
• Below 3120 = macro shift risk
• Reclaiming 3340 = short bias invalid
• Break above 3385 = continuation possible
📌 Today is all about the close. No confirmation = no trade. Thursday is the real trigger — be positioned, not exposed.
—
📣 If this gave you clarity and structure, drop a 🔥, share your bias, and follow GoldFxMinds for sniper plans with zero fluff — only clean, confirmed price action.

Weekly Outlook | XAUUSD June 30 – July 4, 2025Welcome to a new trading week. Let’s break down the gold chart from a clean, high-timeframe perspective. No setups, no noise – just structure, momentum, and zones that matter.
🌐 Macro Overview
This week concentrates all key USD events into one tight window:
Tuesday: ISM Manufacturing + Fed Chair Powell speech
Wednesday: ADP Employment
Thursday: NFP, Unemployment Rate, ISM Services PMI
Friday: US holiday – markets closed
📌 This means liquidity and momentum will peak by Thursday, then fade into the weekend.
Expect gold to stay in range until macro data breaks direction.
🧠 Weekly Structure & Momentum
Gold remains in a bullish macro structure, but price is hesitating below 3300.
Last two weekly candles printed long upper wicks with no body follow-through – clear sign of distribution, not continuation.
We’re still trading above the 21EMA Weekly, which maintains the uptrend’s integrity.
RSI (14): sitting at ~59 → no real momentum breakout, just consolidation.
📌 The chart is not reversing, but it’s also not trending anymore. We’re in a decision zone.
📍 Key Weekly Areas of Interest
3430 – 3500 → W1 Imbalance + March High Sweep
This is a wide weekly imbalance left unfilled since March, paired with the prior 2024 swing high. 3500 is also a psychological round number. If price pushes into this area, it becomes a liquidity target, not an entry – unless a clear rejection forms.
3330 – 3230 → Weekly Decision Block
This is the current consolidation range. It includes multiple W1 candle bodies, wick highs/lows, and volume cluster.
– Weekly close above 3330 = likely bullish continuation toward 3430+
– Weekly close below 3230 = confirms weakness and opens path to the next major support
3080 – 2970 → Weekly Demand + Fib 38%
Clean block of accumulation from April–May, aligned with the 38.2% retracement of the 2024 rally. This is where we’d expect institutional buying interest on a deeper pullback.
A weekly candle with a long wick into this zone + strong close would reset bullish structure.
2850 – 2720 → Last Macro Demand Zone
This zone includes the 50EMA weekly, a weekly FVG from late 2023, and unmitigated demand before the full 2024 breakout. If price ever gets here, we’re no longer in a healthy uptrend – we’re correcting structurally. But this zone will matter if that happens.
🧭 Summary & Expectations
Gold is still inside a large weekly range.
Until we break above 3330 or below 3230, it’s just consolidation on the HTF.
Thursday’s data will decide the candle.
Don’t predict direction — let the W1 close speak.
📌 Final Notes:
Above 3330 = room toward 3430–3500
Below 3230 = risk opens toward 3080–2970
Inside = no directional edge — stay reactive, not biased
🔥 If you enjoy this clean breakdown: hit that 🚀, follow & drop your thoughts below!
Stay sharp traders — we execute with precision.
— GoldFxMinds
