GOLD WEEKLY CHART MID/LONG TERM ROUTE MAPHey Everyone,
Follow up on our Weekly Goldturn channel outlook.
Last week’s action delivered the rejection at the channel top, right in line with expectations. Importantly, we did not get an EMA5 lock confirmation, reinforcing the rejection. We still have the previous weekly candle body close above 3387, leaving the gap at 3482 active and exposed overhead.
The early rejection saw a swift retrace into the 3281 Goldturn axis support, where price is currently attempting to stabilise. This is a pivotal level. From here, we are watching two potential paths unfold:
1. Bounce Scenario: If 3281 holds and buyers step in, we’ll look for a gradual climb within the channel, testing key in between levels. EMA5 cross and lock confirmation will be key for directional bias. A reclaim and continuation higher keeps the 3482 gap firmly in play as a target.
2. Breakdown Scenario: If 3281 gives way, we have a body close gap to the channel mid-line, which becomes the next key level for potential support and Goldturn reaction. A move into this area could offer another structured long opportunity, aligned with the overall bullish framework.
Despite the rejection at the highs, the broader channel structure remains intact, and the longer term outlook still favours a measured move up level by level, using Goldturn levels and EMA5 as our compass.
Key Focus:
Support: 3281 → Channel Half-line (if broken)
Resistance: 3387 → 3482 (gap target)
We remain patient and continue reacting to clean structure backed opportunities.
Mr Gold
GoldViewFX
Metals

Gold Bull Markets: Long-Term Overview & Current Market UpdateGold Bull Markets: Long-Term Overview & Current Market Update (2024–2025)
________________________________________
🏆 Historic Gold Bull Markets: Timeline & Stats
1️⃣ 1968–1980 “Super Bull”
• Start/End: 1968 ($35) → 1980 ($850)
• Total Gain: ~2,330%
• Key Drivers:
o End of the gold standard (Bretton Woods collapse)
o Double-digit inflation, oil shocks
o Political/economic turmoil (Vietnam, stagflation)
• Correction:
o Nearly –45% drop (1974–1976)
• Recovery:
o Took years; massive rebounds afterward
2️⃣ 1999–2012 Bull Market
• Start/End: 1999 ($252) → 2012 ($1,920)
• Total Gain: ~650%
• Key Drivers:
o Commodities supercycle
o Emerging market demand
o US dollar weakness, financial crisis fears
• Correction:
o ~–30% during 2008 crisis, but fast recovery
• Recovery:
o Rebounded quickly after 2008, then peaked in 2011–12
3️⃣ 2016/2018–2027 (Current Cycle)
• Start/End: 2016/2018 ($1,050–$1,200) → ongoing ($3,500+)
• Key Drivers:
o Record central bank buying
o Persistent inflation & low real rates
o Geopolitical instability (Russia/Ukraine, China/US, etc.)
• Correction:
o Only –20% drawdown in 2022; quick recovery
o Broke 13-year technical “cup-and-handle” base in 2024
________________________________________
📊 Current Bull Market Stats (2025) – At a Glance
Metric 1968–80 Super Bull 1999–2012 Bull 2018–2025 Current Bull
🚀 Total Gain ~2,330% ~650% ~200% so far
⏲️ Duration 12 years 13 years 7–9 years so far
💔 Max Drawdown –45% (1974–76) –30% (2008) –20% (2022)
🏦 Central Bank Role Moderate Emerging Dominant
📉 Correction Recovery Years 4 years Months
🏛️ Technical Pattern Secular breakout Multiple peaks 13-yr base breakout
________________________________________
📈 Top 10 Stats of the Current Gold Bull Market (2025):
1. Gold Price:
o ~$3,338–$3,364/oz; ATH > $3,500 in April 2025
2. Year-to-Date Gain:
o +29% YTD (2025); +30% in 2024
3. Central Bank Demand:
o 1,000 tonnes bought for 4th straight year; reserves near records
4. Inflation Hedge:
o Strong negative correlation with real yields; safe-haven demand up
5. Gold vs S&P 500:
o Gold +27% YTD; S&P 500 up only ~2%
6. Jewelry Demand:
o Down –9% in 2024, projected –16% in 2025 (high prices suppress demand)
7. Gold-Silver Ratio:
o Now ~94 (down from 105); silver catching up
8. Record Closes:
o Over 40 daily record closes in 2025; price consolidating near highs
9. Technical Breakout:
o 13-year “cup-and-handle” breakout (March 2024)
10. 2025 Forecasts:
• Range: $3,600–$4,000 by Q2 2026; some see $4,500+ if risks persist
________________________________________
🔄 How This Bull Market Stands Out
• Dominance of Central Banks:
Central banks are setting the pace—record demand, making gold a reserve anchor again.
• Faster Recovery:
Corrections are less severe, recoveries are quick (months, not years).
• Synchronized Rally with Equities:
Rare for gold and stocks to hit highs together—shows systemic confidence in gold.
• Technical Breakout:
13-year base break signals powerful, long-term momentum.
• Future Outlook:
Targets as high as $7,500/oz (650% from cycle lows) possible by 2026/27, if historical analogs play out.
________________________________________
⭐️ Recommended Strategy (2025 and Beyond)
• BUY/HOLD/ACCUMULATE on Dips:
Favor physical gold, gold ETFs (GLD), and miners (GDX).
• Physical Over Paper:
Preference for allocated, physical bullion amid rising counterparty risks.
• Diversify with Miners/Silver:
Gold-silver ratio suggests silver may offer leverage; quality miners benefit in the latter stage of bull runs.
• Long-Term Perspective:
Anticipate volatility, but higher highs are likely if macro themes persist.
________________________________________
🧭 Summary Table: Historic vs Current Bull Markets
Feature 1968–80 1999–2012 2016/18–2027
Total Gain 2,330% 650% 200%+ (so far)
Duration 12 yrs 13 yrs 7–9 yrs (so far)
Correction –45% –30% –20%
Main Buyer Retail Funds Central Banks
Pattern Parabolic Cyclical Cup & Handle
Key Risks Inflation USD/credit Inflation, war, geopolitics
________________________________________
Key Takeaways
• Gold’s current bull market is distinguished by relentless central bank demand, robust technical momentum, and swift recoveries from corrections.
• The macro backdrop—persistent inflation, global uncertainty, and sovereign de-dollarization—supports an extended cycle.
• Expectations for $4,000+ gold in the next 12–24 months are widely held, with even higher targets in a true global crisis.

H4 Outlook | XAUUSD Monday • June 30 • 2025Hey fam,
Fresh week on gold — clean structure, clean levels, clean execution ahead. Forget the noise. We trade price, we trust precision.
🔍 Market Flow & Bias
Gold remains bearish on the H4 timeframe.
Lower highs, lower lows, clean rejection from supply, and all EMAs (21/50/200) aligned down. RSI hovers near 30, showing heavy momentum — not exhaustion yet.
Price is coiled, not crushed. If structure holds, we follow the short flow into deeper zones.
📌 Bias: Bearish below 3325. Pullbacks into supply = opportunity.
—
🧱 Zones of Interest (Clean & Confluent)
🔺 Zone 1 – 3380–3405 | Extreme Supply
Top OB zone with resting liquidity above. If price sweeps this level and fails, expect a sharp reversal. Only valid with reaction (CHoCH or bearish engulfing).
🔺 Zone 2 – 3325–3350 | Main Supply
Strong H4 breaker block. Origin of the last major selloff. Already defended once — if it holds again, look for sniper shorts from within.
🔺 Zone 3 – 3285–3305 | Frontline Supply
First inducement zone. Clean micro-OB that could give early fade trades. If bulls break through, Zone 2 becomes magnet.
⚖️ Zone 4 – 3260–3240 | Flip Shelf
Range base. If price holds, bulls might step in short-term. But a clean break below shifts momentum fully toward lower demand.
🟢 Zone 5 – 3215–3195 | Main Demand
Unmitigated OB with imbalance. If gold drops here with momentum and forms rejection wicks or CHoCH on LTF → long opportunity for bounce.
🟢 Zone 6 – 3150–3120 | Extreme Demand
Macro swing demand. Deepest discount level on the chart. Valid only if market flushes — this is the “last stand” for buyers.
—
🎯 Key Levels Zone Cheat-Sheet
Above
• 3380–3405 → Extreme Supply (trap zone)
• 3325–3350 → Main Supply block
• 3285–3305 → Micro OB inducement
Below
• 3260–3240 → Flip shelf (structural pivot)
• 3215–3195 → Main buy zone
• 3150–3120 → Deep macro demand
—
⚔️ Execution Plan
We sell from reaction zones, not assumptions.
We buy from confluence, not hope.
Every zone above comes with condition: no confirmation, no entry.
—
📣 Found this useful?
Drop a ⚔️ in the comments, tag your bias, 🚀and follow GoldFxMinds for sniper-level execution.
This isn’t guessing. This is structure. This is clarity.

Daily Outlook | XAUUSD June 30, 2025Hey traders,
Fresh week, clean structure. Let’s lock in the key levels and let price do the talking.
🌐 Macro Context
It’s a heavy week for USD – all major data drops before Friday:
Tuesday: ISM Manufacturing + Powell speaks
Wednesday: ADP Employment
Thursday: NFP, Unemployment Rate, ISM Services
Friday: US holiday – markets closed
📌 This means liquidity will build into Thursday, then fade. Expect gold to stay range-bound early in the week, unless momentum shifts hard today. Volatility should peak around NFP.
🧭 Daily Structure & Bias
Gold opened weak under 3287, still below 21EMA and 50EMA. The structure shows lower highs, bearish control, and no signs of strength reclaiming ground. RSI is at 42 — momentum down, but not oversold yet. Unless price breaks back above 3340, sellers stay in control.
✅ D1 Bias: Bearish while under 3340
📌 Key D1 Zones to Watch
🔺 D1 Breaker Block – 3340–3355
Former support, now clean resistance. Includes 50EMA and last failed closes. If price rejects again here, bearish continuation likely. A daily close above 3355 flips short bias.
🔺 D1 Supply + FVG – 3385–3405
Unmitigated imbalance from early June. If price pushes through 3355, this is the next upside magnet. Good spot for first reaction.
⚖️ D1 Decision Zone – 3287–3265
Current price zone. Multiple past reactions. A daily close below 3265 confirms breakdown. Holding above = more choppy range.
🟢 D1 Reaction Shelf – 3210–3180
Minor support zone from April candle bodies. Can slow price, but not strong enough for reversal on its own.
🟢 D1 Demand Block – 3155–3120
First major HTF demand. Includes 200EMA, strong structure, and previous breakout base. If price sells into it fast, watch for rejection — but only with confirmation.
🟢 D1 Macro Demand – 3090–3055
Final line of macro defense. Clean imbalance + demand from February. Valid only if sentiment breaks post-NFP.
✅ Final Summary
• Below 3265 = structure breaks → opens 3180
• 3155–3120 = real support zone
• Below 3120 = macro shift risk
• Reclaiming 3340 = short bias invalid
• Break above 3385 = continuation possible
📌 Today is all about the close. No confirmation = no trade. Thursday is the real trigger — be positioned, not exposed.
—
📣 If this gave you clarity and structure, drop a 🔥, share your bias, and follow GoldFxMinds for sniper plans with zero fluff — only clean, confirmed price action.

Weekly Outlook | XAUUSD June 30 – July 4, 2025Welcome to a new trading week. Let’s break down the gold chart from a clean, high-timeframe perspective. No setups, no noise – just structure, momentum, and zones that matter.
🌐 Macro Overview
This week concentrates all key USD events into one tight window:
Tuesday: ISM Manufacturing + Fed Chair Powell speech
Wednesday: ADP Employment
Thursday: NFP, Unemployment Rate, ISM Services PMI
Friday: US holiday – markets closed
📌 This means liquidity and momentum will peak by Thursday, then fade into the weekend.
Expect gold to stay in range until macro data breaks direction.
🧠 Weekly Structure & Momentum
Gold remains in a bullish macro structure, but price is hesitating below 3300.
Last two weekly candles printed long upper wicks with no body follow-through – clear sign of distribution, not continuation.
We’re still trading above the 21EMA Weekly, which maintains the uptrend’s integrity.
RSI (14): sitting at ~59 → no real momentum breakout, just consolidation.
📌 The chart is not reversing, but it’s also not trending anymore. We’re in a decision zone.
📍 Key Weekly Areas of Interest
3430 – 3500 → W1 Imbalance + March High Sweep
This is a wide weekly imbalance left unfilled since March, paired with the prior 2024 swing high. 3500 is also a psychological round number. If price pushes into this area, it becomes a liquidity target, not an entry – unless a clear rejection forms.
3330 – 3230 → Weekly Decision Block
This is the current consolidation range. It includes multiple W1 candle bodies, wick highs/lows, and volume cluster.
– Weekly close above 3330 = likely bullish continuation toward 3430+
– Weekly close below 3230 = confirms weakness and opens path to the next major support
3080 – 2970 → Weekly Demand + Fib 38%
Clean block of accumulation from April–May, aligned with the 38.2% retracement of the 2024 rally. This is where we’d expect institutional buying interest on a deeper pullback.
A weekly candle with a long wick into this zone + strong close would reset bullish structure.
2850 – 2720 → Last Macro Demand Zone
This zone includes the 50EMA weekly, a weekly FVG from late 2023, and unmitigated demand before the full 2024 breakout. If price ever gets here, we’re no longer in a healthy uptrend – we’re correcting structurally. But this zone will matter if that happens.
🧭 Summary & Expectations
Gold is still inside a large weekly range.
Until we break above 3330 or below 3230, it’s just consolidation on the HTF.
Thursday’s data will decide the candle.
Don’t predict direction — let the W1 close speak.
📌 Final Notes:
Above 3330 = room toward 3430–3500
Below 3230 = risk opens toward 3080–2970
Inside = no directional edge — stay reactive, not biased
🔥 If you enjoy this clean breakdown: hit that 🚀, follow & drop your thoughts below!
Stay sharp traders — we execute with precision.
— GoldFxMinds

GOLD (XAUUSD): Your Trading Plan for Monday
Gold went strongly rejected from a key daily support on Friday.
Your confirmation signal for a pullback trade from that will
be a bullish breakout and an hourly candle close above
3283 intraday resistance.
After that the price will likely reach 3292 level.
❤️Please, support my work with like, thank you!❤️
I am part of Trade Nation's Influencer program and receive a monthly fee for using their TradingView charts in my analysis.

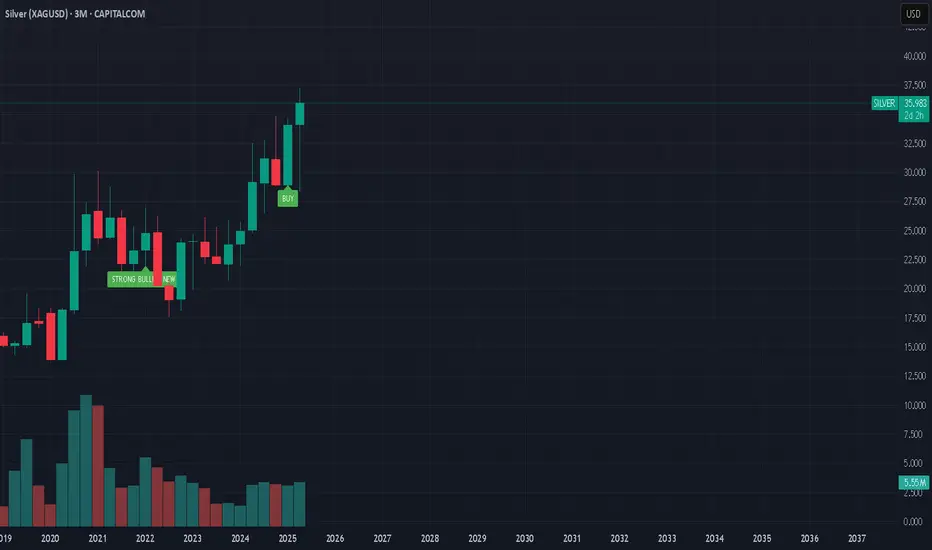
Is the Uptrend Over? Critical Break on the Silver 1-Hour ChartHey everyone,
After the upward trend structure on XAGUSD broke down, the support level was breached, followed by a pullback. Because of this, my target level is 35.286.💬
Also, keep a close eye on key economic data releases on the fundamental side, as they could significantly influence your strategy.
I meticulously prepare these analyses for you, and I sincerely appreciate your support through likes. Every like from you is my biggest motivation to continue sharing my analyses.
I’m truly grateful for each of you—love to all my followers💙💙💙

RSI Flashes Warning on EURUSD: Critical Level Under Watch!Good morning traders,
If the EURUSD pair breaks below the 1.16729 level due to an RSI divergence, the next potential target could be around 1.16093.
Keep in mind that a break below 1.16729 may also signal a potential trend reversal.
I've marked the pivot points for you on the chart for better clarity.
Additionally, it's crucial to keep an eye on current economic data and news releases as part of your fundamental analysis.
I meticulously prepare these analyses for you, and I sincerely appreciate your support through likes. Every like from you is my biggest motivation to continue sharing my analyses.
I’m truly grateful for each of you—love to all my followers💙💙💙

Small SLV positionTaking a small position in SLV here.
Long term looking at the gold to silver ratio trading around 90 If gold holds its grounds and silver plays catch up to a ratio of 70 even 60. I will be playing this position less about price and more about the ratio. If slv breaks all time high I will start selling regardless of price 20% week unless price is parabolic. Then selling will be 50% per week.

Silver-The Next Gold?The precious metals market is abuzz with a compelling question: Is silver poised to become the next gold? As gold continues its record-breaking ascent, investors and analysts are turning their attention to silver, which has demonstrated remarkable performance and potential in 2025. Let’s dive into the factors driving silver’s price, expert forecasts, and what the future may hold for this dynamic metal.
Silver’s 2025 Surge: Outpacing Expectations
Silver prices have surged impressively in 2025, recently trading above $34 per ounce—a 14% year-to-date increase that outpaces many other commodities. This rally is not just a speculative spike; it’s underpinned by robust fundamentals, including:
Gold’s record run, which historically pulls silver prices higher due to their strong correlation
Persistent supply deficits, with 2025 marking the fifth consecutive year of market shortfall
Soaring industrial demand, especially from the green technology and electronics sectors
Renewed safe-haven buying amid ongoing geopolitical and economic uncertainties
#commodity #silver #gold #xau #metals #finance #market #trading #portfolio #analysis
Market Re-Cap and Outlook for NEXT WEEKHere I am giving you a little insight as to what trades I am currently in, taken & looking to take for the week just gone and the week coming.
1 Winning trade on EU
1 Current open position on EU
EURGPB - Breakdown
AUDUSD - Breakdown
NZDUSD - Breakdown
Gold - Breakdown
If there are any pairs you would like me to share my feedback on give me a message and I will be happy to try and do so.
Thanks
Happy Hunting

Gold 1H Intra-Day Chart 26.06.2025Option 1: Gold rejects from $3,346 & drops towards $3,280.
Option 2: Gold keeps moving higher into another strong demand zone of $3,416.
Which scenario do you find more likely?

Gold Rebounds After Filling Gap >> Bullish Continuation in SightHello guys!
Gold (XAU/USD) is showing signs of strength on the 4H chart after filling a key gap around the $3,290 level and bouncing off it with bullish intent.
🔹 What I see:
– Price previously broke out of a broad descending channel, flipping the structure bullish
– After forming a rising wedge, Gold corrected lower and filled the gap
– The zone around $3,290 acted as solid support, and the current bounce suggests bulls are regaining control
📈 Outlook:
If this bounce holds and momentum builds, the next area of interest is clearly marked:
🎯 First Target: $3,466 – an area of prior structure and possible supply
📍 Current Price: $3,329
🟢 Bias: Bullish (above $3,290)
🔴 Invalidated below: $3,244
This setup offers a favorable risk-to-reward opportunity if the structure continues holding. Keep an eye on price action near the recent local highs for confirmation.

SILVER: Bulls Will Push
The price of SILVER will most likely increase soon enough, due to the demand beginning to exceed supply which we can see by looking at the chart of the pair.
Disclosure: I am part of Trade Nation's Influencer program and receive a monthly fee for using their TradingView charts in my analysis.
❤️ Please, support our work with like & comment! ❤️

Gold may bounce up from support line of channel to 3330 pointsHello traders, I want share with you my opinion about Gold. Previously, the price broke out of a symmetrical triangle and moved confidently toward the seller zone. However, it failed to consolidate there and formed a downward channel, where price action has remained since. The movement inside this channel has been consistent, respecting both the resistance and support lines. After reaching the lower boundary, the price bounced up and approached the resistance area (3290 - 3300), which now acts as a key short-term obstacle. This zone was tested multiple times and served as support earlier, making it a strong technical level. Currently, the price is trading just below this zone and forming a base for the next move. I expect a possible retest of the support line of the downward channel, which may provide the impulse needed for a new upward move. In my opinion, the price will rebound from the bottom of the channel and start to grow toward the current resistance level at 3300. If this level is broken and confirmed via a retest, I expect continued movement toward the channel’s upper resistance line. That’s why I set my TP 1 at 3330 points, right near the resistance line of the channel. Please share this idea with your friends and click Boost 🚀
Disclaimer: As part of ThinkMarkets’ Influencer Program, I am sponsored to share and publish their charts in my analysis.

BRIEFING Week #26 : Are we going for a Bubble ?Here's your weekly update ! Brought to you each weekend with years of track-record history..
Don't forget to hit the like/follow button if you feel like this post deserves it ;)
That's the best way to support me and help pushing this content to other users.
Kindly,
Phil

SMC Trading Basics. Change of Character - CHoCH (GOLD FOREX)
In the today's post, we will discuss one of the most crucial concepts in SMC - Change of Character.
Change of Character relates to market trend analysis.
In order to understand its meaning properly, first, we will discuss how Smart Money traders execute trend analysis.
🔘Smart Money Traders apply price action for the identification of the direction of the market.
They believe that the trend is bullish ,
if the price forms at least 2 bullish impulse with 2 consequent higher highs and a higher low between them.
The market trend is considered to be bearish ,
if the market forms at least 2 bearish impulses with 2 consequent lower lows and a lower high between them.
Here is how the trend analysis looks in practice.
One perceives the price action as the set of impulse and retracement legs.
According to the rules described above, USDCAD is trading in a bullish trend because the pair set 2 higher lows and 2 higher highs.
🔘Of course, trends do not last forever.
A skill of the identification of the market reversal is a key to substantial profits in trading.
Change of Character will help you quite accurately identify a bullish and bearish trend violation.
📉In a bearish trend, the main focus is the level of the last lower high.
While the market is trading below or on that, the trend remains bearish .
However, its bullish violation is a very important bullish signal,
it is called a Change of Character, and it signifies a confirmed violation of a bearish trend.
In a bearish trend, CHoCH is a very powerful bullish pattern.
Take a look, how accurate CHoCH indicated the trend reversal on Gold.
After a massive selloff, a bullish breakout of the level of the last lower high confirmed the initiation of a strong bullish wave.
📈In a bullish trend, the main point of interest is the level of the last higher low. While the price is trading above that or on that, the trend remains bullish.
A bearish violation of the last higher low level signifies the violation of a current bullish trend. It is called a Change of Character, and it is a very accurate bearish pattern.
Take a look at the example on Dollar Index below.
In a bullish trend, bearish violation of the last higher low level
quite accurately predicted a coming bearish reversal.
Change of Character is one of the simplest , yet accurate SMC patterns that you should know.
First, learn to properly execute the price action analysis and identify HH, HL, LL, LH and then CHoCH will be your main tool for the identification of the trend reversal.
❤️Please, support my work with like, thank you!❤️
I am part of Trade Nation's Influencer program and receive a monthly fee for using their TradingView charts in my analysis.

XAUUSD D1 Forecast: Gold at Pivotal 325x Support What's Next for the Yellow Metal?
Today, we're zooming out to examine the broader picture for Gold (XAUUSD) on the Daily (D1) timeframe. Our latest analysis indicates that Gold has encountered a very strong, critical support level around the 325x region. This is a pivotal point that could significantly influence Gold's medium to long-term direction!
🌍 Macroeconomic Landscape: The Underlying Forces Influencing Gold
While we've observed a degree of USD weakness stemming from speculations around the Federal Reserve (such as the rumours regarding Jerome Powell's replacement) and expectations of interest rate cuts, these factors haven't fully countered Gold's recent decline on the daily chart. Furthermore, the sustained ceasefire between Israel and Iran continues to temper Gold's appeal as a safe-haven asset.
Nevertheless, the current price action at the robust 325x support level presents a significant technical signal. The impact of forthcoming US macroeconomic data (particularly the PCE Price Index on Friday) and speeches from FOMC members will be crucial in confirming or negating our projected movements for Gold. Should positive news for Gold align with this support holding, it could act as a potent catalyst.
📊 XAUUSD D1 Technical Analysis: Projecting Gold's Next Move
Given that Gold has reached strong support at 325x, we can anticipate the following scenarios:
Bounce from 325x (Potential Upside Phase):
If the 325x area (which reinforces the 3264.400 support from image_e9d325.png) holds firm, we expect a strong reaction and an upward move for Gold.
The initial target for this bounce would be the 332x region, aligning with resistance levels 3313.737 - 3330.483 from our previous analysis. On a broader timeframe (as illustrated in image_83845c.png), this corresponds to the resistance zone around 3326.022. This 332x area might represent a continuation pattern, suggesting it could be a corrective rally before the resumption of the larger trend.
Resumption of Downtrend (After Reaching 332x):
Once Gold reaches and tests the 332x zone (3313.737 - 3330.483 / 3326.022) and exhibits bearish confirmation signals (e.g., a strong bearish engulfing candle, a pin bar, or a clear top formation), we anticipate a resumption of the downward movement.
The next major target for this decline would be the 317x area, which correlates well with the strong support at 3173.052 on the larger timeframe (as depicted in image_83845c.png).
🎯 XAUUSD D1 Trading Plan: Your Long-Term Strategy Ahead!
Considering the current D1 analysis, here's our actionable plan:
1. BUY PHASE (Bounce from Support):
Entry: Observe price reaction in the 325x - 326x zone (specifically 3264.400). Only consider buying if there are clear bullish confirmations (e.g., a confirmed bullish pattern on the daily or 4-hour candle, a strong bounce from the zone with significant volume).
SL (Stop Loss): Position just below the 325x support zone (e.g., 3245-3240, depending on confirmation).
TP (Take Profit): 3280 - 3284 - 3290 - 3295 - 3300 - 3305 - 3310 - 3313.737 - 3320 - 3326.022 (key 332x zone). This will be our primary target for the potential bounce.
2. SELL PHASE (Downtrend Resumption):
Entry: Once the price reaches and tests the 332x zone (3313.737 - 3330.483 / 3326.022) and shows bearish confirmation signals (e.g., a strong bearish engulfing, pin bar, or clear top formation).
SL (Stop Loss): Position slightly above the 332x zone (e.g., 3335-3340).
TP (Take Profit): 3326 - 3320 - 3316 - 3310 - 3305 - 3300 - 3295 - 3290 - 3280 - 3200 - 3173.052 (final 317x target).

Gold is coiling for a breakout... All eyes on the next move!📉 Gold is currently moving within a minor descending channel.
In yesterday’s analysis, I pointed out the potential for a drop. Now, after a period of range-bound movement, I expect a breakout from this channel and a return to the main trend.
🎯 The first target on a reversal would be the top of the minor channel.
Keep a close eye on price action here — this zone could be key for the next move
OANDA:XAUUSD

GOLD 4H: not all that glitters is bullish...The 4H chart shows a clean descending triangle breakdown. Price failed to reclaim the trendline and was rejected under both MA50 and MA200. The bounce into 3325–3340 was absorbed — classic liquidity sweep and fade. Volume confirms bearish control.
Technically, the breakdown below 3320 opens the way toward $3293 (1.0 Fibo), $3250 (1.272 extension), and final target at $3195 (1.618), where buyers might step in. RSI supports the continuation without signs of reversal. Structure broke — and the market is telling us where it's heading.
Tactical plan:
— Entry at market or on a retest of $3325–3335
— Targets: $3293 → $3250 → $3195
— Stop: above $3340 (above MA50 and broken trendline)
When gold looks shiny, smart traders look deeper. This breakout isn’t golden — it’s a trap for late bulls.


XAUUSD : Ready for More Upside Before Another Fall ?By analyzing the gold chart on the 4-hour timeframe, we can see that price initially followed our bullish scenario, climbing 140 pips up to $3336. However, after hitting that level, gold reversed and entered the bearish scenario, dropping below $3300 and eventually finding support around $3255.
This area acted as a strong demand zone, and we’ve since seen a rebound. Currently, gold is trading around $3273, and as long as price holds above the marked demand zone (Bullish Rejection Block), we may expect another bullish move before price potentially targets the liquidity below $3245 and $3203.
Please support me with your likes and comments to motivate me to share more analysis with you and share your opinion about the possible trend of this chart with me !
Best Regards , Arman Shaban

Gold: Market analysis and strategy for June 27Gold technical analysis
Daily chart resistance level 3350, support level 3250
4-hour chart resistance level 3340, support level 3245
1-hour chart resistance level 3300, support level 3280
Technical indicators show that the 4-hour moving average system shows a dead cross arrangement, and the MACD indicator dead cross continues. The gold price has fallen below the lower track support of the Bollinger Band, and the Bollinger Channel is narrowing. The short-term price is in a low-level weak consolidation pattern.
The 1-hour chart price broke the previous low of 3295, but the price is oversold and may rebound in the short term. The short-term support level below is around 3280. If it falls below, continue to look at the 3271-3245 range; the important pressure level is around 3300!
If there is a short-term rebound before the NY market, wait until the rebound before continuing to sell! The current minimum is 3279. After the short-term stabilization, refer to the resistance of 3300/3310 to sell.
Sell: 3300near
Sell: 3310near
