GOLD - SHORT TO $2,800 (UPDATE)Our original sell bias from $3,347 which I posted live for you all, is now running in deep profits! Market is now down & running 810 PIPS in profit in just 2 days.
We have broken structure to the downside, crossing below our previous 'Wave E' low, indicating & acting as stronger confluence that Gold will carry on down towards our $2,800 target. Huge profits en-route for us all in this free channel.
Metals

GOLD ROUTE MAP UPDATEHey Everyone,
A fantastic close to the week as our analysis once again played out level to level with precision!
As a follow-up from yesterday's post:
- The swing range completed the move into 3348, as expected.
- However, we had no further EMA5 lock above, confirming rejection back into the swing range.
- This was followed by an EMA5 cross and lock below 3306, opening the secondary swing range.
- That range played out perfectly today, hitting both 3288 and 3271 targets.
We’re now seeing a bounce off those levels giving the 20 to 40 pips, and we will now be observing to see if the full secondary swing is completed.
It's Friday, and it's been a PIPTASTIC week across the board. Well done to everyone following the plan and sticking to the levels.
QUICK RECAP
BULLISH TARGET
3376 - DONE
BEARISH TARGETS
3348 - DONE
EMA5 CROSS AND LOCK BELOW 3348 WILL OPEN THE SWING RANGE
3330 - DONE
3306 - DONE
EMA5 CROSS AND LOCK BELOW 3306 WILL OPEN THE SECONDARY SWING RANGE
3288 - DONE
3271 - DONE
We’ll be back now on Sunday with our multi-timeframe analysis and trading plans for the week ahead. Thanks again for all your likes, comments, and follows.
Wishing you all a fantastic weekend!!
Mr Gold
GoldViewFX

GOLD: Will Go Up! Long!
My dear friends,
Today we will analyse GOLD together☺️
The in-trend continuation seems likely as the current long-term trend appears to be strong, and price is holding above a key level of 3,274.66 So a bullish continuation seems plausible, targeting the next high. We should enter on confirmation, and place a stop-loss beyond the recent swing level.
❤️Sending you lots of Love and Hugs❤️

Nasdaq Hits New ATH at $22,570 – Eyes Now on $23,200 and $24,000By analyzing the #Nasdaq chart on the weekly timeframe, we can see that the index followed our previous analysis perfectly, hitting the $22,400 target and printing a new all-time high at $22,570!
Momentum remains strong and bullish, and we expect price to continue climbing toward the next targets. Based on the original projection, upcoming targets are $23,200 and $24,000.
Stay tuned for the next update!
Please support me with your likes and comments to motivate me to share more analysis with you and share your opinion about the possible trend of this chart with me !
Best Regards , Arman Shaban

SILVER: The Market Is Looking Down! Short!
My dear friends,
Today we will analyse SILVER together☺️
The market is at an inflection zone and price has now reached an area around 35.998 where previous reversals or breakouts have occurred.And a price reaction that we are seeing on multiple timeframes here could signal the next move down so we can enter on confirmation, and target the next key level of 35.727..Stop-loss is recommended beyond the inflection zone.
❤️Sending you lots of Love and Hugs❤️

GOLD Trading Opportunity! BUY!
My dear subscribers,
GOLD looks like it will make a good move, and here are the details:
The market is trading on 3270.6 pivot level.
Bias - Bullish
My Stop Loss - 3260.7
Technical Indicators: Both Super Trend & Pivot HL indicate a highly probable Bullish continuation.
Target - 3289.4
About Used Indicators:
The average true range (ATR) plays an important role in 'Supertrend' as the indicator uses ATR to calculate its value. The ATR indicator signals the degree of price volatility.
Disclosure: I am part of Trade Nation's Influencer program and receive a monthly fee for using their TradingView charts in my analysis.
———————————
WISH YOU ALL LUCK

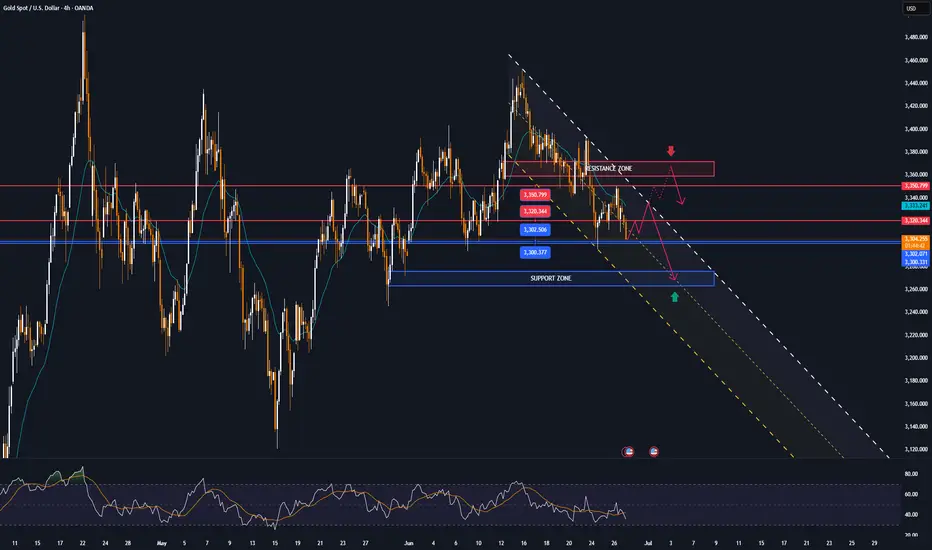
XAUUSD - Gold Bearish Bias Remains StrongXAU/USD remains under bearish pressure on the 4-hour timeframe. Until price breaks and closes above $3,336 with strength, selling the rallies remains a preferred strategy. However, watch for potential bounces near support zones, especially if momentum weakens or reversal candles appear. The price is currently trading below both the 50, 100 and 200 EMA, indicating a short-term downtrend. The recent price action has respected the trendline resistance and failed to break higher, reinforcing sellers’ control.
Price structure has formed a descending channel, which often signals a bearish continuation. However, if price finds a strong reaction from support, a temporary rebound could occur before further downside. Overall sentiment is cautious due to recent geopolitical de-escalation between Iran and Israel, which reduced gold’s safe-haven demand. Dollar strength, driven by hawkish Fed tone, continues to pressure gold.
Key Support Levels :
$3,295 – A minor support where previous candles showed buying interest.
$3,289 – Critical horizontal support and psychological level.
$3,270 – Next significant support if $3,289 breaks.
$3,240 – Major support zone, last line before larger downside moves.
Key Resistance Levels:
$3,310 – Near-term resistance and EMA zone.
$3,320 – Price rejection level from earlier 4H candles.
$3,336 – Strong resistance with previous swing highs.
Note
Please risk management in trading is a Key so use your money accordingly. If you like the idea then please like and boost. Thank you and Good Luck!

This Trendline Has Held Since January, Will Gold Finally Break?Gold (XAUUSD) is currently testing a key ascending trendline that has acted as dynamic support since early 2025. Today's price action shows strong bearish pressure, but confirmation is still needed as the daily candle has not yet closed below the trendline. A decisive close beneath this level would signal a potential shift in market structure and open the door for further downside. Fundamentally, mixed U.S. data adds to the uncertainty—while Personal Income (-0.4%) and Spending (-0.1%) came in below expectations, the Core PCE Price Index rose to 0.2%, suggesting lingering inflationary pressure.
If price breaks and closes below 3,260, I’ll consider a bearish continuation toward 3,200, 3,120, and possibly 3,000. However, if bulls defend this zone and reclaim 3,300+, a short-term bounce could still play out. For now, I'm staying patient and waiting for the daily close to confirm direction.

GOLD recovers, capped by $3,350, trend viewOANDA:XAUUSD recovered then weakened as it failed to break above $3,350, supported by a weaker dollar and market uncertainty sparked by reports that U.S. President Donald Trump could replace Federal Reserve Chairman Jerome Powell in September or October. The reports raised concerns about the future independence of the Federal Reserve, boosting demand for safe-haven gold.
On Wednesday, Trump called Powell “terrible” and said he was considering three or four candidates to replace him. Meanwhile, the Wall Street Journal reported that Trump was even considering announcing a potential successor as early as September or October.
The current market narrative is that once Trump nominates a new Fed chair, market expectations will tend to favor a more “dovish” Fed. This could lead to a weaker US dollar, higher long-term US Treasury yields and higher stock prices.
Forexlive points out that this story may be more an emotional reaction than a result of objective and rational thinking. The policy of the FOMC (Federal Open Market Committee) is decided not only by the Fed Chairman but also by a majority vote of the 12 voting members (including 7 directors and 5 regional Fed presidents). The Fed Chairman does have a lot of influence, but he does not have absolute control over monetary policy. The Fed was originally designed to be independent of political pressure.
Moreover, even if Trump nominates the next chairman, there is no guarantee that this will automatically lead to a rate cut. In fact, Powell was also nominated by Trump, but his monetary policy decisions are still based on professional judgment rather than serving Trump's wishes.
So, in the worst case, the market could face policy uncertainty as differences between FOMC members increase and more disagreements emerge. Currently, there are fewer moderate members on the committee, while neutral or hawkish members dominate.
Markets are now focused on personal consumption expenditure (PCE) data due later today (Friday) for further clues on whether the Federal Reserve will cut interest rates.
On the geopolitical front, a ceasefire between Israel and Iran appeared to be in place on Wednesday after Trump hailed a swift end to the 12-day conflict at the NATO summit and said he would seek a commitment from Iran to abandon its nuclear ambitions in talks next week.
Technical Outlook Analysis OANDA:XAUUSD
On the daily chart, after gold recovered and reached the initial target at 3,350 USD, the nearest resistance is also the price point of the EMA21 noted for readers in the previous publication.
However, the recovery momentum is currently weakening, specifically at the time of writing, the gold price is falling below 3,320 USD. Gold falling below 3,320 USD provides conditions for a possible decline with the next target around 3,302 - 3,300 USD, which is the area of the 0.382% Fibonacci retracement confluence with the lower edge of the price channel.
In terms of momentum, the RSI is heading down and breaking below 50, which should be considered an initial bearish signal.
Overall, gold does not have a clear long-term trend as the uptrend is still the main trend, while the momentum is showing signs of decline.
But personally, I am still leaning towards the uptrend, and continue to look for positions to buy.
Finally, the notable positions will be listed as follows.
Support: 3,302 – 3,300 USD
Resistance: 3,320 – 3,350 – 3,371 USD
SELL XAUUSD PRICE 3367 - 3365⚡️
↠↠ Stop Loss 3371
→Take Profit 1 3359
↨
→Take Profit 2 3353
BUY XAUUSD PRICE 3272 - 3274⚡️
↠↠ Stop Loss 3268
→Take Profit 1 3280
↨
→Take Profit 2 3286
WHAT IS THE EXPECTED RETURN and DURATION of this GOLD Bull Run?Well, when measured against the DXY index, a clear trend becomes apparent.
A Golden Bull typically lasts about 40 quarters, which is essentially 1 decade (give or take a quarter).
Similar to #Bitcoin and its cyclical bull markets within a larger secular bull, the returns tend to decrease over time.
However, it seems that a triple-digit Gold price relative to the DXY is on the horizon at the very least.
What would that look like if the DXY were to hit a new low around 69? This would suggest a Gold price of $6900 at a ratio of 100:1.
A Gold price of $12K with a DXY of 80 only requires a ratio of 150...
Thus, a five-digit Gold price is certainly within the realm of possibility.
I have forecasts that extend as high as $12K.

Gold Confirms Breakdown — Eyes on $3100 TargetGold has broken below the neckline of multiple Head & Shoulders formations, signaling potential downside continuation. This technical development opens the path toward the projected target around $3100, Let’s monitor whether the pattern fulfills its full potential.
#Gold #XAUUSD #HeadAndShoulders #TechnicalAnalysis #ChartPattern #GoldForecast #TradingView #Commodities #PriceAction

GOLD → Local bearish trend. Retest of support.FX:XAUUSD is technically looking a little weak. Support is being retested amid de-escalation of geopolitical conflicts in the Middle East. Interest in the metal is waning.
On Friday, gold remains under pressure ahead of data on the core PCE index, a key inflation indicator for the Fed. If inflation turns out to be higher than expected, this could strengthen expectations of a rate cut as early as July, supporting gold. The probability of a July cut is currently estimated at 21%, and 75% for September. Amid dollar volatility caused by rumors of a possible Fed chair replacement and trade negotiations with the EU and China, traders remain cautious, awaiting clarity on inflation and monetary policy
Technically, before falling, gold may form a correction to 3320 (liquidity capture).
Resistance levels: 3320, 3336, 3347
Support levels: 3293, 3271
If the fundamental background remains unchanged and gold continues to decline towards support at 3293 and break through this level, the breakout could lead to a fall to 3271. However, I do not rule out the possibility that after a sharp decline, a correction to 3320 could form before the fall.
Best regards, R. Linda!

Gold Holds Above $3340 as Dollar Drops and Fed Uncertainty Rises GOLD OVERVIEW
Gold Holds Gains as Dollar Weakens and Fed Uncertainty Grows
Gold climbed above $3,340 per ounce on Thursday, supported by a sharp decline in the U.S. dollar amid growing dovish expectations from the Federal Reserve.
Adding to market speculation, U.S. President Donald Trump hinted he may announce a new Fed Chair as early as September or October, potentially reducing Jerome Powell’s influence before his term ends in June and boosting expectations for a more accommodative policy stance.
TECHNICAL OUTLOOK – XAU/USD
Gold shows bearish potential if the price can stabilize below the pivot level at 3,341.
However, while trading above 3,341, a short-term correction toward 3,364–3,365 is likely before any renewed selling pressure.
Today’s U.S. GDP release may add further volatility and direction to the market.
Key Levels
Pivot Line: 3,341
Resistance: 3,364 → 3,373
Support: 3,320 → 3,302
previous idea:

Waiting for data release to rebound and short📰 Impact of news:
1. PCE and Consumer Index
📈 Market analysis:
The current price of 3280 has a higher profit and loss ratio advantage. Technical indicators show that the hourly chart is severely oversold. Combined with the top and bottom conversion of 3300 above, there is a 20-point rebound space in the short term. If the PCE data is in line with the trend, gold prices are expected to quickly regain the 3,300 mark. Note that negative data beyond expectations may cause a brief decline.
🏅 Trading strategies:
BUY 3295-3280-3275
TP 3298-3300-3310
SELL 3300-3310
TP 3290-3280-3260-3250
If you agree with this view, or have a better idea, please leave a message in the comment area. I look forward to hearing different voices.
TVC:GOLD FXOPEN:XAUUSD FOREXCOM:XAUUSD FX:XAUUSD OANDA:XAUUSD

Is gold in an ascending triangle, or in a wider range?A quick technical piece on TVC:GOLD . What are your thoughts?
MARKETSCOM:GOLD
Let us know what you think in the comments below.
Thank you.
77.3% of retail investor accounts lose money when trading CFDs with this provider. You should consider whether you understand how CFDs work and whether you can afford to take the high risk of losing your money. Past performance is not necessarily indicative of future results. The value of investments may fall as well as rise and the investor may not get back the amount initially invested. This content is not intended for nor applicable to residents of the UK. Cryptocurrency CFDs and spread bets are restricted in the UK for all retail clients.

HelenP. I Gold will rebound up from trend line to $3400 levelHi folks today I'm prepared for you Gold analytics. After looking at this chart, we can see how the price after a prolonged consolidation inside a large wedge pattern, XAUUSD, approached the ascending trend line again - this line has acted as a key support several times in the past. This time is no exception: the price reacted to it with a bullish bounce. We can see a confluence here — trend line support coincides with the lower boundary of the wedge and the local support zone at 3270 - 3250 points. Now the price is trading above this line, showing early signs of recovery. Given the symmetry of this structure and past behavior, I expect gold to continue rising from current levels. The nearest major obstacle lies in the resistance zone around 3400 - 3420, which acted as a turning point before. That’s why my current goal is set at the 3400 level. If bulls hold the trend line, we may see a steady move toward this key resistance. Given the trend line reaction, wedge structure, and current momentum, I remain bullish and expect further growth. If you like my analytics you may support me with your like/comment ❤️
Disclaimer: As part of ThinkMarkets’ Influencer Program, I am sponsored to share and publish their charts in my analysis.

GOLD - SELL TO $3,288 (1H VIEW)Still looking for a move lower into the $2,787 - $3,276 zone, to take out the June low, like I mentioned to you all a few days ago.
Tomorrow is Friday so be careful as price action could be choppy & use strict risk management.
⭕️Imbalance Left Below $3,300 Psychological Number.
⭕️Either Wave 2 or Wave C Not Complete of Major Impulse Move Down.
⭕️Sellers Holding Below Resistance Zone.
TP: $3,288

GOLD Will Grow! Long!
Here is our detailed technical review for GOLD.
Time Frame: 1h
Current Trend: Bullish
Sentiment: Oversold (based on 7-period RSI)
Forecast: Bullish
The market is trading around a solid horizontal structure 3,290.38.
The above observations make me that the market will inevitably achieve 3,315.54 level.
P.S
We determine oversold/overbought condition with RSI indicator.
When it drops below 30 - the market is considered to be oversold.
When it bounces above 70 - the market is considered to be overbought.
Disclosure: I am part of Trade Nation's Influencer program and receive a monthly fee for using their TradingView charts in my analysis.
Like and subscribe and comment my ideas if you enjoy them!

Silver consolidation supported at 3500Silver – Technical Analysis
The Silver price action continues to exhibit a bullish sentiment, underpinned by a prevailing rising trend. However, recent intraday moves indicate a corrective pullback, reflecting short-term consolidation within the broader uptrend.
Key Technical Levels:
Support:
3,500 – Primary support and previous consolidation zone; critical for maintaining bullish structure.
3,450 – Secondary support; potential downside target if 3,500 fails.
3,390 – Key lower support; aligns with a broader demand area.
Resistance:
3,720 – Immediate upside resistance; first target on a bullish bounce.
3,790 – Intermediate resistance; aligns with recent swing highs.
3,850 – Long-term resistance target; marks the upper boundary of the current bullish channel.
Scenario Analysis:
Bullish Continuation (Base Case):
A bounce from the 3,500 level would affirm the corrective pullback as temporary, with potential for a bullish continuation targeting 3,720, followed by 3,790 and 3,850 over a longer timeframe.
Bearish Reversal (Alternative Scenario):
A daily close below 3,500 would undermine the current bullish outlook and signal a deeper retracement, with downside risk toward 3,450 and potentially 3,390, where structural support may stabilize price.
Conclusion:
Silver remains structurally bullish, with the current pullback offering a potential entry point within the trend. The 3,500 level is the key pivot—holding above it supports further upside continuation, while a breakdown below would raise the risk of a deeper correction. Traders should watch for price action confirmation at this level to validate the next directional move.
This communication is for informational purposes only and should not be viewed as any form of recommendation as to a particular course of action or as investment advice. It is not intended as an offer or solicitation for the purchase or sale of any financial instrument or as an official confirmation of any transaction. Opinions, estimates and assumptions expressed herein are made as of the date of this communication and are subject to change without notice. This communication has been prepared based upon information, including market prices, data and other information, believed to be reliable; however, Trade Nation does not warrant its completeness or accuracy. All market prices and market data contained in or attached to this communication are indicative and subject to change without notice.

XAUUSD Daily Sniper Plan – June 27, 2025Hey traders! Today’s a trader’s dream: high-impact US news, gold trapped in a tight coil between supply and demand, and price flirting with the decision zone. The first breakout will be explosive — but only one side survives the trap. Let’s lock in the real structure, real bias, and sniper-level execution.
🔸 HTF Bias Breakdown
Daily Bias: Neutral → Price trapped between major supply (3359) and HTF demand (3282). Expect breakout after news.
H4 Bias: Bearish → Lower highs holding below 3359, structure weak below 3340.
H1 Bias: Mixed → Bullish momentum building off 3310–3282, but compression under EMAs warns of a fake rally.
🔹 Key Levels Above Price
3385 – Final top-side liquidity zone (last week’s spike high)
3359–3344 – HTF supply & OB (main short zone)
3340–3330 – The pivot zone (battle for control)
🔸 Key Levels Below Price
3317–3310 – Primary demand zone (where buyers stepped in yesterday)
3297–3282 – Deep liquidity pocket & HTF OB (last chance for bulls)
3260 – Breakdown zone if everything fails below
🔥 Sniper Zones & Execution Logic
🔴 3385–3375 – Extreme Supply
Only trade this zone if NY news launches price up and rejection is instant. Needs M5/M15 bearish reversal (engulfing, CHoCH, FVG fill). No news spike = no trade.
🔴 3359–3344 – Main Supply Zone
This is your first real short setup. Sweep into this area + rejection = clean short trigger. Confluence: HTF OB, FVG, EMA 100 rejection, bearish CHoCH.
⚔️ 3340–3330 – Pivot Decision Zone
This is where direction flips.
Break and hold above 3340 = bullish → targets 3359 / 3375
Rejection under 3330 = bearish → back toward 3310 or 3282
Plan: Use for break/retest entries only with M5/M15 confirmation. No blind trades.
🟢 3317–3310 – Primary Demand Zone
Watch for news-induced sweep, then M15 bullish PA (CHoCH, engulfing, RSI bounce). First safe buy zone if structure holds.
🟢 3297–3282 – Deep Demand Zone
Only used if NY session nukes the market. Enter only on textbook SMC/ICT reversal + RSI sub-30. This is the last stand for bulls.
🧠 Execution Strategy
Wait for NY news and first liquidity sweep. Don’t guess.
Sell 3359–3344 or 3375+ only on strong rejection
Buy 3310 or 3282 only on bullish reversal confirmation
Pivot 3340–3330 is the heart of today — use for break/retest or trap reversal
If you love clear logic, tap like, follow, and share your bias in the comments! 🚀👇
Disclosure: I am part of TradeNation's Influencer program and I'm using their TradingView charts in my analyses and educational articles.
GoldFxMinds

XPTUSD 1W:While Everyone Watches Gold, Platinum Quietly Wakes UpGold gets the headlines — but platinum just broke two years of silence with a clean, high-volume breakout from a symmetrical triangle on the weekly chart. And this isn’t noise — this is the structural shift traders wait for.
Price has been coiled inside a compressing wedge since early 2022. Equal highs. Equal lows. Stop hunts both ways. The classic “shake out before take off.” Now? The breakout is in. And the weekly candle closed above resistance with volume confirmation. Oh, and while we're at it — the 50MA just crossed above the 200MA, signaling a long-term trend reversal.
Target? Measure the triangle height: ~398 points. That projects a breakout target of 1440 USD, which aligns perfectly with previous institutional rejection zones.
But this isn’t just about the chart.
🔹 South Africa, the top global supplier, is struggling with energy and production cuts;
🔹 The Fed is pausing rate hikes — the dollar weakens, metals rally;
🔹 Demand from hydrogen tech, clean energy, and industrial catalysts is on the rise.
Translation? Smart money has been accumulating. The move from 965–1070 was just the ignition. The drive hasn’t started yet.
So while everyone fights over gold highs, platinum sits at the base of a move no one's prepared for — except those who know how accumulation ends.
🧭 Key support: 965–985
📍 Resistance zone: 1150–1180
🎯 Measured target: 1440+

DeGRAM | GOLD broke the demand zone📊 Technical Analysis
● Price sliced beneath the long-term rising‐channel base and the triangle apex, turning 3 300-3 310 into fresh supply; the current pull-back is a textbook bearish retest of the break zone.
● Hourly structure now tracks a new descending trend-line; failure to reclaim 3 300 keeps momentum pointed to the next fib / horizontal shelf at 3 280, with the channel width projecting 3 245 support.
💡 Fundamental Analysis
● Rebound in US 2-yr yields after hawkish Fed speakers and a stronger-than-expected durable-goods print lifted the DXY, reducing short-term bullion appeal.
-------------------
Share your opinion in the comments and support the idea with a like. Thanks for your support!

GOLD Bearish Breakout! Sell!
Hello,Traders!
GOLD made a bearish
Breakout of the key
Horizontal level of 3,300$
And the breakout is confirmed
So we are bearish biased and
We will be expecting a
Further bearish continuation
Sell!
Comment and subscribe to help us grow!
Check out other forecasts below too!
Disclosure: I am part of Trade Nation's Influencer program and receive a monthly fee for using their TradingView charts in my analysis.
