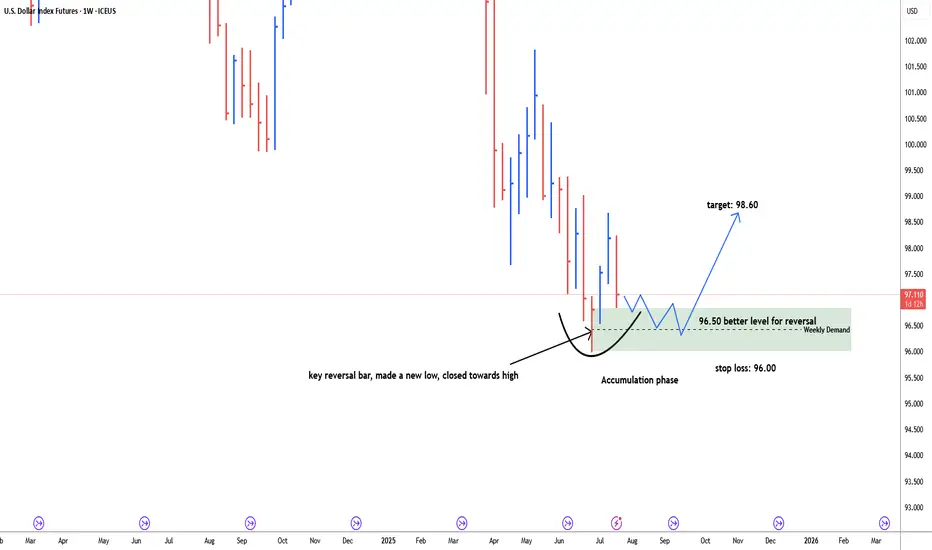
USD Dollar index possbile bullish reversal#usddollarindex, last weekly bar of the month of June is key reversal bar, made a new low and closed towards high. price retracing back down to test weekly demand zone. discount zone of demand is 96.50. possible bullish reversal target: 98.60. Stop loss below 96.00. price need time to build energy for bullish momentum. 96.50-96.00 is more secure level for long.
Metals
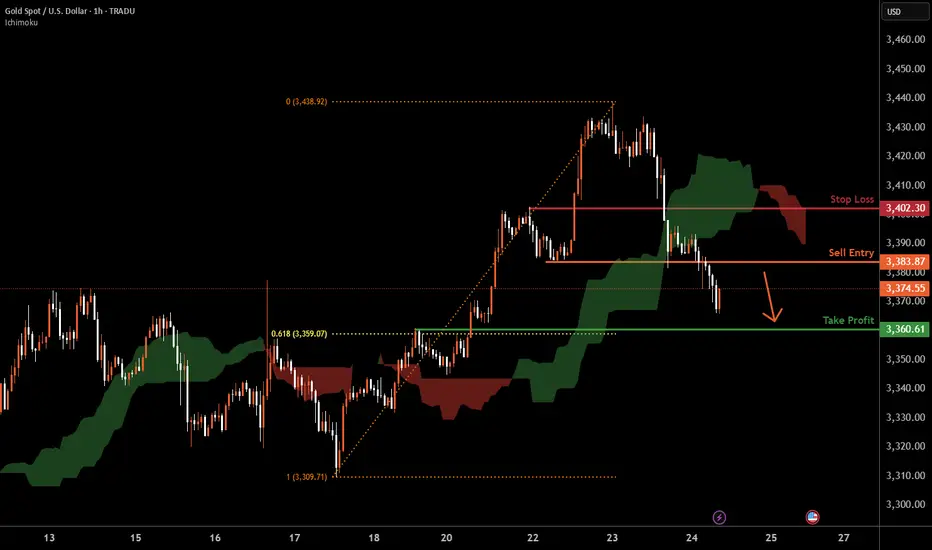
XAUUSD H1 I Bearish Reversal Based on the H1chart, the price is approaching our sell entry level at 3383.87, a pullback resistance.
Our take profit is set at 3360.61, a pullback support that aligns with the 61.8% Fib retracement.
The stop loss is set at 3402.30, a pullback resistance.
High Risk Investment Warning
Trading Forex/CFDs on margin carries a high level of risk and may not be suitable for all investors. Leverage can work against you.
Stratos Markets Limited (tradu.com ):
CFDs are complex instruments and come with a high risk of losing money rapidly due to leverage. 63% of retail investor accounts lose money when trading CFDs with this provider. You should consider whether you understand how CFDs work and whether you can afford to take the high risk of losing your money.
Stratos Europe Ltd (tradu.com ):
CFDs are complex instruments and come with a high risk of losing money rapidly due to leverage. 63% of retail investor accounts lose money when trading CFDs with this provider. You should consider whether you understand how CFDs work and whether you can afford to take the high risk of losing your money.
Stratos Global LLC (tradu.com ):
Losses can exceed deposits.
Please be advised that the information presented on TradingView is provided to Tradu (‘Company’, ‘we’) by a third-party provider (‘TFA Global Pte Ltd’). Please be reminded that you are solely responsible for the trading decisions on your account. There is a very high degree of risk involved in trading. Any information and/or content is intended entirely for research, educational and informational purposes only and does not constitute investment or consultation advice or investment strategy. The information is not tailored to the investment needs of any specific person and therefore does not involve a consideration of any of the investment objectives, financial situation or needs of any viewer that may receive it. Kindly also note that past performance is not a reliable indicator of future results. Actual results may differ materially from those anticipated in forward-looking or past performance statements. We assume no liability as to the accuracy or completeness of any of the information and/or content provided herein and the Company cannot be held responsible for any omission, mistake nor for any loss or damage including without limitation to any loss of profit which may arise from reliance on any information supplied by TFA Global Pte Ltd.
The speaker(s) is neither an employee, agent nor representative of Tradu and is therefore acting independently. The opinions given are their own, constitute general market commentary, and do not constitute the opinion or advice of Tradu or any form of personal or investment advice. Tradu neither endorses nor guarantees offerings of third-party speakers, nor is Tradu responsible for the content, veracity or opinions of third-party speakers, presenters or participants.
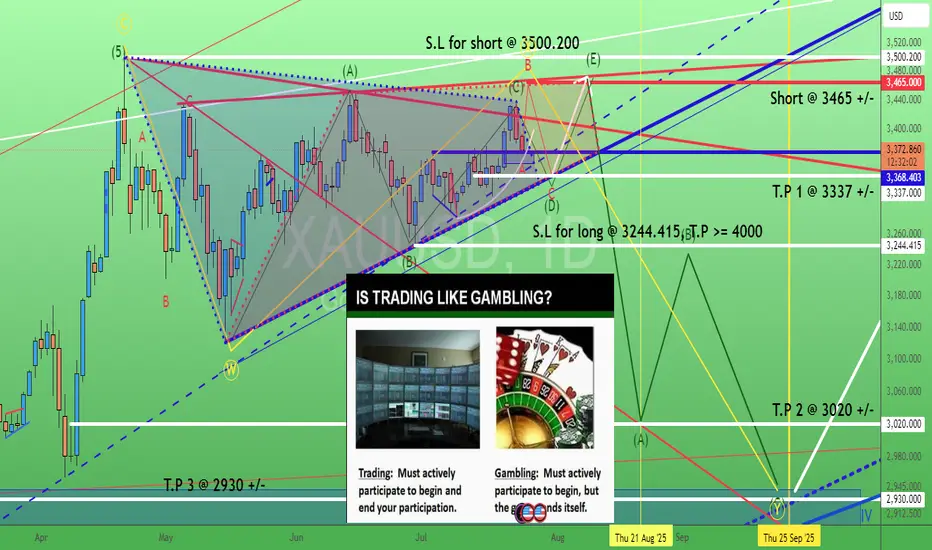
Gold. How to "kill" bull or bear (triangle)? 24/July/25XAUUSD. are you betting (gambling) OR trading for bull/bear triangle? With or without "active lost/cut lost"?.. No stop lost = passive (cut) lost = Let the "gambling" games end for you. Not you end the "trading" any time actively. The "happy ending" always come with good risk management with good risk/reward ratio where ONLY happened when we have T.P and S.L plans.
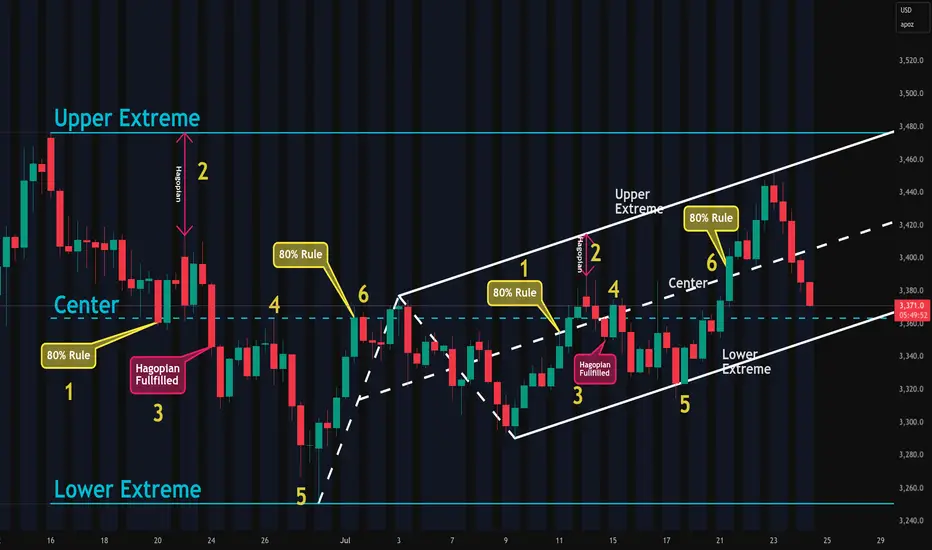
The Edge Of The Fork - The Joker In Your PocketWOW!
\ \ First of all, I want to say THANK YOU for all the boosts, follows, and comments. You guys & gals give me the energy to continue this journey with you.\ \
Today, I want to show you that what we’ve learned with horizontal lines can also be applied to "Medianlines," or Forks.
Listen, I don’t want you to blow your brain with all the rules.
Not at the beginning of this journey, and not later on either.
Don’t ask yourself:
* when to use which Fork
* which swing to measure
* when to trade
* where to set your stop
* what if... bla bla bla
That’s not fun — that’s stress.
I don’t like stress — nobody does.
So let’s just chill and have fun here.
That’s my personal reason for doing all this Trading thing. I want to have fun — the money will take care of itself, just like the destination of a trail takes care of itself, as long as I keep putting one foot in front of the other. And that’s simple, right?
So let’s do it exactly the same way.
Just simple steps, connecting some dots, and BAM! — You’re there before you even know it §8-)
\ Let’s jump to the chart:\
Today, you’ll find out why Medianlines/Forks are a cousin of the horizontal Channel — but NOT the same.
Where are they different?
Forks are different because they’re capable of projecting the most probable path of price. And that’s a HUGE difference.
Yes, you can apply the full rule set of Forks to a horizontal Channel.
But the Channel CANNOT project the most probable path of price.
I hear you, I hear you: "No one and nothing can foresee the future. How is it even possible that Forks can?"
\ Here’s why:\
There’s a thing called "Statistical Importance." And it means that if something happens very often in the same way, we have a higher chance of seeing the same behavior again in the future.
And that’s what the inventor, Allan Andrews, discovered — and he created the rules around his findings.
\ A high probability that price will move in the direction of the projected path, as long as it stays within the boundaries of the Medianlines/Fork.\
That’s the whole "magic" behind Medianlines/Forks.
And the same applies to the "Behavior of Price" within and around Medianlines. That’s really all there is to it.
Look at the chart and compare the Channel and the Fork:
1. Price reaches the Centerline about 80% of the time
2. HAGOPIAN → price goes farther in the opposite direction than where it came from
3. HAGOPIAN’s rule fulfilled
4. Price reaches the Centerline again
5. Price reaches the other extreme
6. Price reaches the Centerline about 80% of the time
You’ll see the same behavior inside the Fork!
That’s beautiful, isn’t it? §8-)
And here’s a little Joker in your pocket — if you know the difference between the Channel and the Forks!
Do you know what it is?
Yep! You’d automatically know the direction to trade — giving you another 10% edge right out of the box — LONG TRADES ONLY. Because the Fork projects the most probable path of price to the upside, not down.
That's all folks §8-)
Like this lesson?
With a simple boost and/or a little comment, you load my Battery so I can continue my next step on the trail with you.
Thank you for spending your time with me §8-)
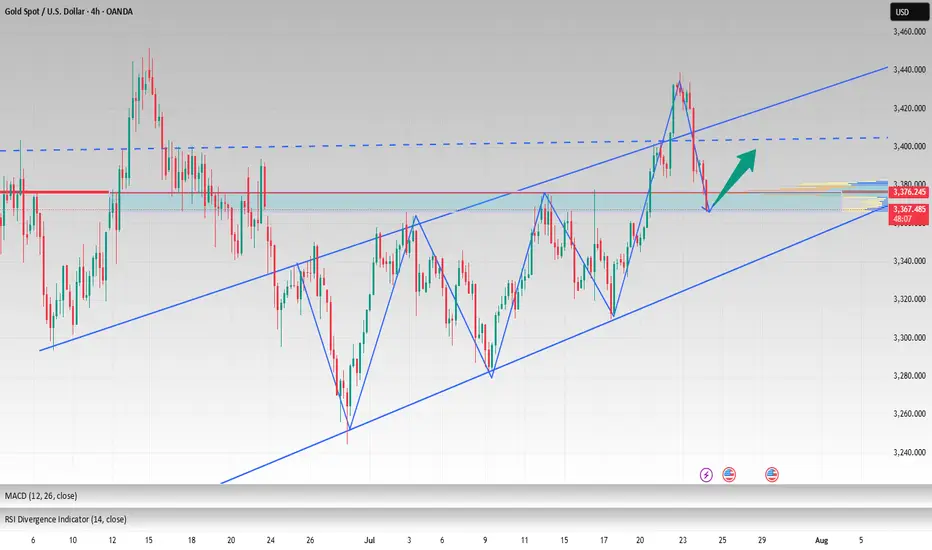
Gold sets sights on 3,500 USD – will the rally continue?Hello traders, do you think gold will keep rising?
Today, OANDA:XAUUSD is trading around 3,380 USD after a slight pullback from the 5-week high of 3,438 USD reached on Tuesday. Despite this short-term dip, the overall trend remains bullish, supported by both technical structures and market expectations.
On the news front, the US Dollar Index (DXY) has dropped to 97.4 – its lowest level in weeks. This reflects growing expectations that the Federal Reserve may cut interest rates by the end of the year, as recent data points to slowing inflation and weakening consumer spending. A softer dollar typically strengthens gold’s appeal.
From a technical perspective, the daily chart reveals a clear bullish structure supported by the rising trendline and the EMA34 and EMA89. Price is consolidating just above the trendline, forming a potential bullish continuation pattern. The resistance zone near 3,440 USD is being repeatedly tested – and if gold breaks out with strong volume, the path toward 3,500 USD could open up quickly.
From my perspective, I expect gold to make new highs above this level soon. What’s your take? Drop your thoughts in the comments!

Gold’s Next Move: Bounce or Breakdown?Gold is pulling back after breaking the 3,360 USD resistance on the 6-hour chart. Price is currently testing the nearest fair value gap (3,370–3,380), but upside momentum is stalling, partly due to unfilled supply zones above.
A retest of the lower FVG near 3,340 will be key. Holding above this level could trigger renewed buying, while a break below may invalidate the bullish structure.
Traders should closely monitor whether downside gaps continue to fill and how price behaves near support zones. Lack of strong liquidity could lead to a false breakout.

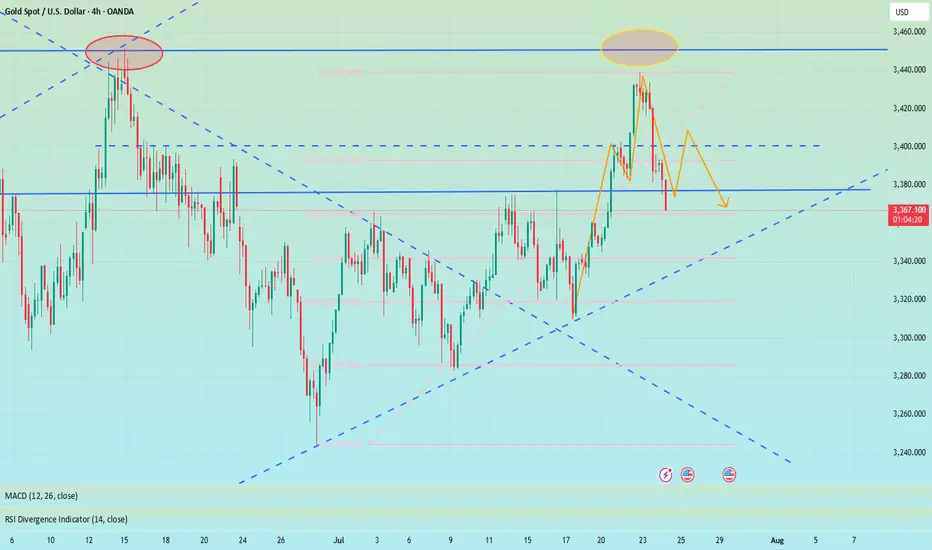
GOLD (XAUUSD): Important Demand Zone Ahead
Gold is currently retracing from a key daily horizontal resistance.
Here are important structures to watch.
Horizontal Structures
Support 1: 3350 - 3377 area
Support 2: 3310 - 3324 area
Support 3: 3282 - 3301 area
Support 4: 3245 - 3374 area
Resistance 1: 3431 - 3451 area
Resistance 2: 3493 - 3500 area
Vertical Structures
Vertical Support 1: rising trend line
Vertical and Horizontal Supports 1 compose a contracting demand zone.
Probabilities are high the price will pull back from that.
❤️Please, support my work with like, thank you!❤️
I am part of Trade Nation's Influencer program and receive a monthly fee for using their TradingView charts in my analysis.

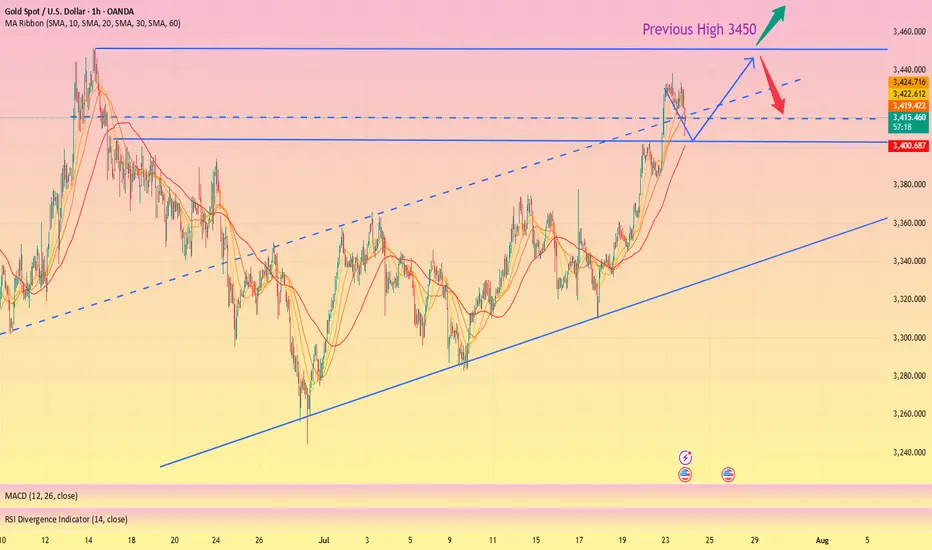
Correction is not bearish, buy on rebound at low levelToday is critical. Yesterday, gold fell under the pressure of 3396. The next 3396 area is very critical, and it will be relatively weak below it. If it goes up, the market rebound will expand. Pay attention to 3405 or 3420 area, with the focus on 3420. As long as it is below here, it will be mainly bearish. Breaking through 3420, the market is expected to continue to rise and break yesterday's high to test the 3450 area, and then seek to fall again. On the downside, pay proper attention to the 3380 area, which is short-term support; the focus is on the 3370~3365 area, which is the next bull-bear watershed.
The daily line fell yesterday and included the previous day's big positive rise, which represents the current high-level fluctuation of the price. At present, we need to pay attention to the lower moving average support corresponding to SMA10 at 3367, while the moving average SMA30 is around 3351-53, the middle track is at 3344, and the moving average SMA60 is at 3330.
From the daily level: today's decline will not fall below 3351-53, and it is likely to be around 3367-70. We have the opportunity to participate in long orders near 3370.
Therefore, if the price touches 3370-3365 for the first time during the day, you can consider going long, with the target at 3390-3400; if the downward trend of gold continues during the day, you can go long again at 3355-3353, defend 3345, and exit the market after earning a difference of $10-20.
OANDA:XAUUSD
Gold fell as expected, can it reverse?📰 News information:
1. Initial unemployment claims data
📈 Technical Analysis:
Gold has made a profit retracement correction as expected. The two-day rising market has led to an overly bullish sentiment in the market. Under this pattern, it is very easy to trigger an unexpected reversal trend, which is often a key opportunity to break the psychological defense line of retail investors in the market.
From the bottom of gold at 3244 to the high of 3439 this week, it can be found that the current 38.2% support position is near 3364. Moreover, the current daily SMA10 moving average position is also near 3364, SMA30 and the middle track of the Bollinger Band are near 3343, and SMA60 is near 3330.
From the daily line, if the daily line can stand above 3364, then there is still a possibility of refreshing the high of 3438 in the future. On the other hand, if the daily line falls below 3364, then 3438 may become the high point in July.
If there is a rebound in the morning, then 3384 in the white session will be the bottom support, and short positions must be participated in the European and American sessions. If the downward trend continues in the morning, there will be an opportunity to participate in long orders around 3370. At the same time, the possibility of further decline and reaching the middle line of 3343 cannot be ruled out. At the same time, if the 4H chart can form a head and shoulders top pattern, then the intraday long rebound point will not exceed 3410.
Therefore, on the whole, if it falls directly, it can be considered to go long when it first touches 3375-3365, and the target is 3390-3400; if the intraday decline is strong, the second trading opportunity is below 3355-3345, and the target is $10-20 before exiting.
🎯 Trading Points:
BUY 3375-3365
TP 3390-3400
In addition to investment, life also includes poetry, distant places, and Allen. Facing the market is actually facing yourself, correcting your shortcomings, facing your mistakes, and exercising strict self-discipline. I share free trading strategies and analysis ideas every day for reference by brothers. I hope my analysis can help you.
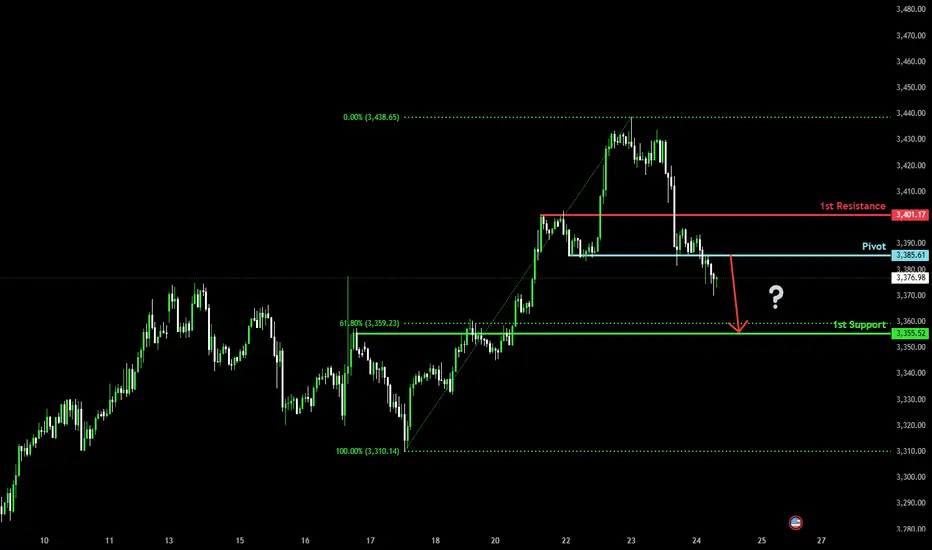
Bearish drop?The Gold (XAU/USD) has reacted off the pivot and could potentially drop to the 1st support, which is a pullback support that is slightly below the 61.8% Fibonacci retracement.
Pivot: 3,385.61
1st Support: 3,355.52
1st Resistance: 3,401.17
Risk Warning:
Trading Forex and CFDs carries a high level of risk to your capital and you should only trade with money you can afford to lose. Trading Forex and CFDs may not be suitable for all investors, so please ensure that you fully understand the risks involved and seek independent advice if necessary.
Disclaimer:
The above opinions given constitute general market commentary, and do not constitute the opinion or advice of IC Markets or any form of personal or investment advice.
Any opinions, news, research, analyses, prices, other information, or links to third-party sites contained on this website are provided on an "as-is" basis, are intended only to be informative, is not an advice nor a recommendation, nor research, or a record of our trading prices, or an offer of, or solicitation for a transaction in any financial instrument and thus should not be treated as such. The information provided does not involve any specific investment objectives, financial situation and needs of any specific person who may receive it. Please be aware, that past performance is not a reliable indicator of future performance and/or results. Past Performance or Forward-looking scenarios based upon the reasonable beliefs of the third-party provider are not a guarantee of future performance. Actual results may differ materially from those anticipated in forward-looking or past performance statements. IC Markets makes no representation or warranty and assumes no liability as to the accuracy or completeness of the information provided, nor any loss arising from any investment based on a recommendation, forecast or any information supplied by any third-party.
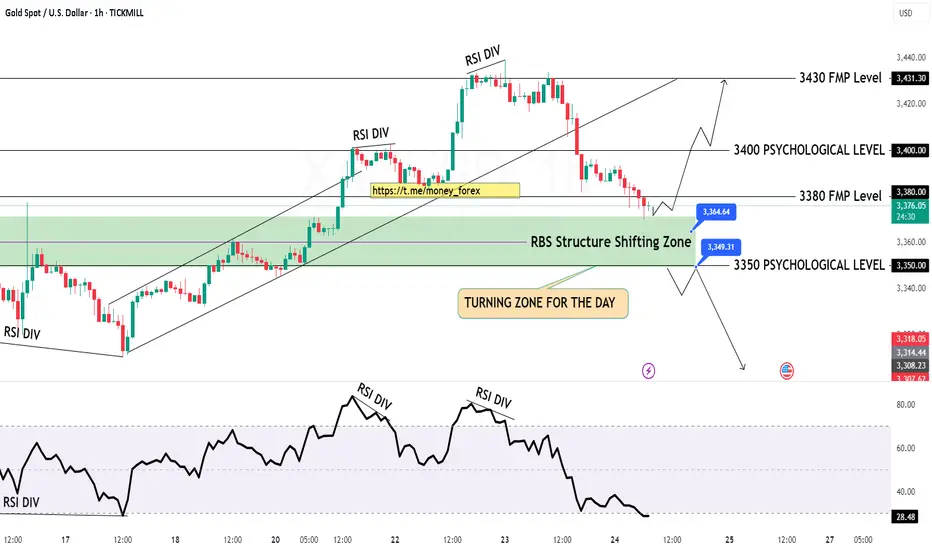
GOLD H1 Chart Update for 24 July 2025Hello Traders,
we got fall yesterday on RSI DIV and right now all eyes on 3350 Psychological level breakout if market successfully breaks that level then it will move towards 3330 or even 3315 level
some retracements remains pending around 3400-3412 zone GOLD will might retrace that zone before going further down
Reminder: PMI's day in the market
Disclaimer: Forex is Risky
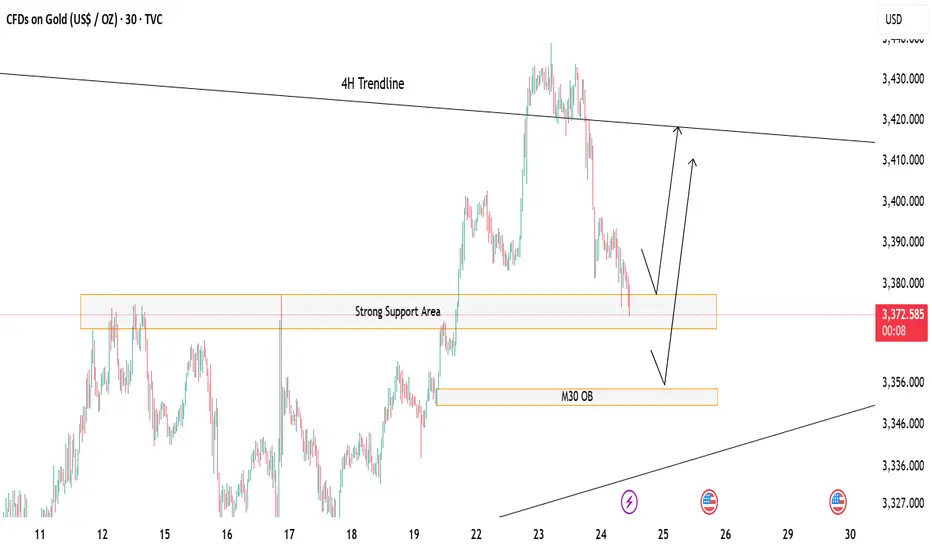
Gold at Key Decision Zone – Bounce or Break?Price is currently hovering above a strong support zone, showing potential for a short-term bounce. 🔁
If this zone holds, we could see a bullish reaction toward the 4H trendline resistance above. 📈
However, a break below may lead price to drop and tap into the M30 Order Block (OB) for a deeper mitigation before any move up. ⚠️
If this happen we could look for potential sell till the OB test otherwise the buying opportunity should focused more
🎯 Watch these key zones carefully – market is at a decision point!
Both buy and sell setups possible depending on how price reacts at these levels.
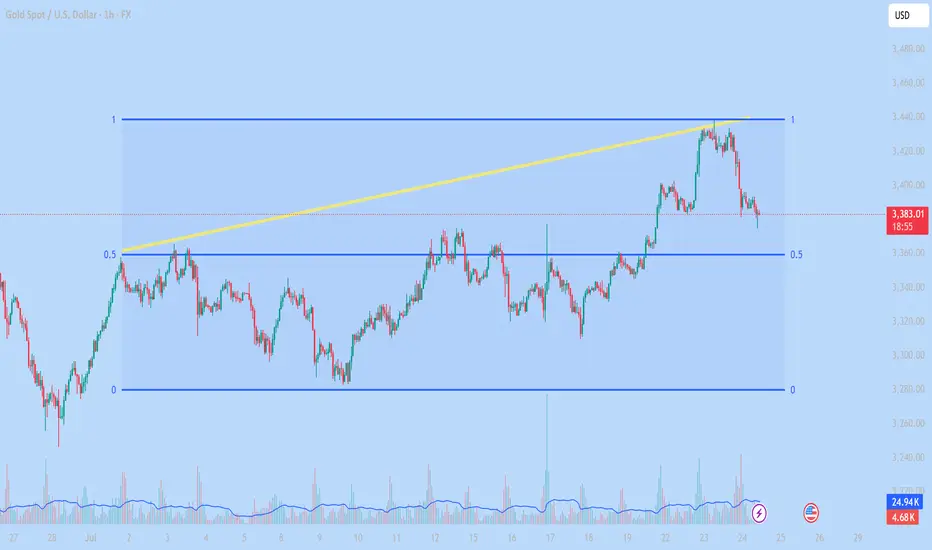
Technical Analysis of XAUUSD – 1H July 24, 20251. Fibonacci Levels
The chart uses a Fibonacci range from 0 to 1, likely drawn from a significant low to a recent high.
The 0.5 Fibonacci level (around $3,360) is acting as a major support zone and price is currently testing this level.
2. Short-term Trend
Price broke above the previous high and formed a new high near $3,440, but then reversed sharply.
Now it’s pulling back toward a key support zone between $3,360 – $3,380.
3. Volume Analysis
Volume spiked at the top near $3,440, suggesting strong selling pressure or profit-taking.
Volume slightly increases again as price reaches support → possible buying interest at the current level.
4. Trendline (Yellow Line)
The ascending yellow trendline has been broken to the downside, signaling a break in short-term bullish momentum.
Possible Scenarios
Scenario 1 – Bullish Rebound from Support:
If price holds above the $3,360 zone and forms bullish candles, we could see a recovery toward $3,400–$3,420.
That area can act as a short-term profit-taking zone.
Scenario 2 – Bearish Breakdown Below 0.5 Level:
If price breaks below the $3,360 support with strong bearish candles, it may drop further toward the Fibonacci 0 level (~$3,280).
Conclusion
Gold is at a critical decision point. Holding the $3,360 support could lead to a bullish bounce. Breaking it would likely confirm a short-term downtrend. Monitor the next few candles closely for confirmation.
Would you like a trade plan or entry/exit suggestion based on this chart?
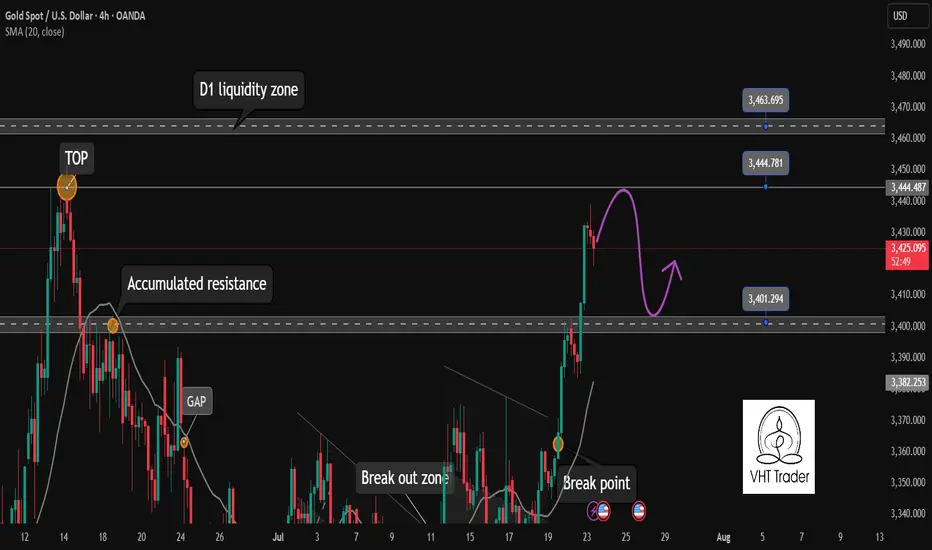
Gold will pause its rally today. Be cautious✏️ OANDA:XAUUSD continues to hit new highs this week. As the daily candle closes above the 3430 area, gold is creating a wide trading range of about 50 prices today. The uptrend may face a slight slowdown due to profit-taking psychology of some investors.
📉 Key Levels
Sell trigger: Rejection from 3445
Sell zone: 3463
Target: 3405
BUY trigger: 3402 (Price retests breakout zone and buyers react)
Leave your comments on the idea. I am happy to read your views.
Gold 1H Intra-Day Chart 23.07.2025Option 1: Gold rejects from $3,430 zone & drops towards $3,260.
Option 2: Gold buyers hold around $3,260 & push price back up.
Which scenario do you find more likely?

silver seems goes to $40.15 very soonDXY still down-treding.
silver position looks well-aligned with a bullish trend, thanks to technical strength and macro tailwinds. Keep an eye on the $39 support zone— Next upside target $40.15
www.tradingview.com

GOLD Rebound Ahead! Buy!
Hello,Traders!
GOLD is falling down now
But will soon hit a horizontal
Support level of 3375$
And as we are bullish biased
We will be expecting a rebound
And a local bullish correction
Buy!
Comment and subscribe to help us grow!
Check out other forecasts below too!
Disclosure: I am part of Trade Nation's Influencer program and receive a monthly fee for using their TradingView charts in my analysis.

XAU/USD – Ranging Market Prepping for Breakout?Gold has been ranging for the next couple months and usually I am out of the market during the months of April Through July because historically these are not my best months trading XAU/USD. However you will see me posting a lot more in the coming months because my best months historically are August - December where the market really cranks up with some bigger moves.
So in a summarized version below you will find what it is that i am looking at with gold.
Gold (XAU/USD) has remained locked in a defined consolidation range between 3,250 (support) and 3,450–3,502 (resistance) since early April. Price has printed multiple internal falling wedge formations within this zone, indicating compression before potential expansion.
🔍 Technical Overview
Range Duration: ~3.5 months
Key Range:
Support: 3,250
Resistance: 3,450–3,502
Compression Patterns: Multiple falling wedges breaking upwards inside the range, hinting at bullish pressure.
Touch Confirmations: Both range boundaries have been tested multiple times, reinforcing validity (per Multi-Touch Confirmation).
Contextual Bias: Seasonally, August–December tends to be a high-volatility trending period for Gold.
🎯 Trade Plan
Inside Range:
Maintain neutral bias.
Execute range-to-range scalps/swing setups with clear invalidation zones.
Avoid trading mid-range.
Breakout Scenario (Bullish):
A clean close above 3,502 triggers breakout watch.
Ideal setup: Retest + 15-min flag → long continuation.
Potential upside target: ~3,700 (range height extension).
Breakdown Scenario (Bearish):
Loss of 3,250 opens door to bearish continuation.
Look for clean liquidity sweep or structure flip before committing.
Initial downside target: 3,100 zone.
🛡️ Risk Notes
Avoid third-touch entries in aggressive momentum unless followed by flag formation.
Remain disciplined with the 80/20 confluence rule — don't let perfectionism delay entries.
Always execute with pre-trade checklist and defined R:R profile.
✅ Summary
Gold is at a pivotal point. The confluence of a tight multi-month range, internal compression patterns, historical breakout timing, and validated levels builds a compelling case for an imminent expansion move. Remain patient, avoid anticipation, and react to confirmed structure and price behavior.

SILVER WILL KEEP GROWING|LONG|
✅SILVER is trading in an
Uptrend and the price made
A retest of the horizontal support
Level of 39.10$ and we are already
Seeing a bullish reaction so we
Are bullish biased and we will be
Expecting a further bullish move up
LONG🚀
✅Like and subscribe to never miss a new idea!✅
Disclosure: I am part of Trade Nation's Influencer program and receive a monthly fee for using their TradingView charts in my analysis.

GOLD LOCAL LONG|
✅GOLD went down from
The resistance just as I predicted
But a strong support level is ahead at 3380$
Thus I am expecting a rebound
And a move up towards the target of 3400$
LONG🚀
✅Like and subscribe to never miss a new idea!✅
Disclosure: I am part of Trade Nation's Influencer program and receive a monthly fee for using their TradingView charts in my analysis.

Gold Next Move According To My Analysis (READ DESCRIPTION).Hellow Traders, I'm here with new idea.
The Previous Major Highs and Lows
price (3125) Major Low
Price (3449) Major High
Price (3253) Major Low
Price (3432) Major High
The market rejects four times at the price (3436) according to D1 TF. when the market touches the area (3436) then falling again and again so it couldn't break.
Now the price respects the demand zone M30, It will give you few pips, after a little pump gold will drop if price respects the bearish engulfing H1 at 3420-3432. Now the trend is bullish it will change if price breaks the Trendline and 3253 area then our target will be 3129.
If price breaks the area 3432 then we will change our gear into buy because when the price breaks the supply zone it will be {BOS} and RBS.
STAY TUNE FOR UPDATE
KINDLY SHARE YOUR IDEAS HERE AND LEAVE POSSITIVE COMMENTS, THANKS EVERYBODY.

Daily Orderflow on $ES $NQ $GC. 23.07.2025, WednesdayOutlining the orderflow along with the examples of todays trades. Outlined PM session expansion as well

Perfect profit on short position, long TP 3450#XAUUSD
Gold is in an upward trend from the daily chart. From the technical indicators, the SMA5-SMA10 moving averages are golden crosses, BOLL opens upward, the K line runs on the upper track of the daily Bollinger Band, and the MACD continues to increase, indicating that the bullish trend remains unchanged📈.
The approaching August 1st tariff deadline, coupled with uncertainties such as the Federal Reserve, provide short-term support for gold🔍.
📊The current lower support is at 3410-3400. If it falls back to this level during the day, you can consider going long. Gradually check 3430 and 3440 on the upside, and pay close attention to the breakthrough of the 3450 level🏅. If it effectively breaks through 3450, gold is expected to break through the historical high. If it encounters resistance near 3450 as in the previous trend, you can consider shorting📉.
🚀BUY 3410-3400
🚀TP 3430-3440