Meta - The breakout in question?🪓Meta ( NASDAQ:META ) is retesting major structure:
🔎Analysis summary:
After Meta perfectly retested a major previous support trendline in 2022, the trend shifted bullish. We have been witnessing an incredible rally of about +700% with a current retest of the previous all time highs. Time will tell but a bullish breakout remains quite likely.
📝Levels to watch:
$750
🙏🏻#LONGTERMVISION
Philip - Swing Trader
Metaplatformssignals

META Platforms Long Setup – Ready for the Next Move?💣 META Masterplan: Bullish Break-In Activated! 💼📈
🌟Hi! Hola! Ola! Bonjour! Hallo!🌟
Dear Money Makers & Silent Strategists, 🤑💰💸✈️
We’ve locked in on our next high-value digital vault: META Platforms Inc.
Built on our signature Thief Trading Style™ — where fundamentals meet stealth technical precision — this is your map to the bullish jackpot.
📍 ENTRY PLAN – Door’s Unlocked!
✅ Enter at any level — this heist is already in motion.
OR
🎯 Set your Buy Limit on a 15m/30m swing low or high — classic pullback infiltration.
🛑 STOP LOSS – Your Exit Route
Before breakout? Hold the line.
After breakout? Drop your SL at the recent 4H swing low – and size it to your risk appetite.
This isn’t luck — it’s calculated theft. 🔐
🎯 TARGET ZONE – Grab & Vanish
🎯 Aim: 770.00
But if the cops (aka sellers) show up early, get out with your loot — no shame in a clean getaway.
“Profit is the win. Perfection is fantasy.”
⚡ SCALPERS' TIPS – Quick In & Out
💵 Big wallet? Enter now.
💳 Tight budget? Follow the swing team.
Either way — longs only, and trailing SL is your safety rope.
📊 WHY META? – Intel Behind the Mission
🔍 This plan is reinforced by:
🔥 Strong Fundamentals
📈 Sentiment Signals
🧠 Quantitative + Macro Flow
💼 COT Data
🌐 Intermarket Correlations
It’s all aligning — the pressure’s building, and the breakout door is creaking open...
🚨 TRADING ALERT – Stay Outta Trouble
💥 Avoid placing new trades during major news drops.
🎯 Use trailing SL to protect and lock profits — your getaway vehicle must be ready.
💖 Support the Heist? Smash Boost!
Fuel the mission — every Boost empowers the crew.
This is Thief Trading Style — we don’t chase, we plan, strike, and vanish with the win. 🏆💪🐱👤
📡 Another breakout mission incoming. Stay hidden. Stay profitable. 🤑🚀

Meta Platforms (NASDAQ: META) Receives Analyst UpgradeMeta Platforms (NASDAQ: META) is set to report first-quarter 2025 results on April 30. Ahead of the release, the stock is trading at $532.16, down over 18% year-to-date. Concerns about a pullback in ad spending and rising AI infrastructure costs had weighed heavily on investor sentiment. However, robust engagement trends and a notably cheaper 16x EV/EBIT valuation have prompted a shift in outlook. The stock has been upgraded from Sell to Hold.
Despite macroeconomic challenges and regulatory fines from the EU, analysts maintain a positive long-term view. Benchmark’s Mark Zgutowicz cut his price target to $640 from $820 but reaffirmed a Buy rating. He highlighted Meta’s long-term strength in U.S. digital ad markets and its disciplined capital allocation.
Similarly, Stifel’s Mark Kelley reduced his target to $628, citing cautiousness in the e-commerce and subscriptions space. He acknowledged market discomfort reminiscent of the COVID-19 era.
Meanwhile, Monness’s Brian White maintained a Buy rating with a $775 target, projecting Q1 revenue of $41.73 billion and earnings of $5.54 per share. Analysts, on average, expect EPS of $5.24 and revenue of $41.3 billion, suggesting double-digit growth. The stock holds a Strong Buy consensus from Wall Street. Out of 46 analysts, 42 rate it Buy, three Hold, and one Sell. The average price target of $705 implies a potential 35.5% upside from current levels.
Technical Analysis
META has rebounded sharply off a key ascending trendline support that dates back to April 2024. The recent recovery from around $475 coincided with the ascending trendline. The price has been bullish overall, as seen from the 200-day moving average at $408.64.
Price is now about to reclaim both the 100-day ($549.11) and 50-day ($601.58) moving averages. The chart indicates a possible near-term pullback followed by a push toward the $740.91 high. Volume is currently at 44.25 million shares, suggesting rising interest.

META priced the new Channel Up bottom. Eyes $800 next.Meta Platforms (META) hit yesterday its 1D MA50 (blue trend-line) for the first time since January 02, while reaching the bottom of the short-term (dashed) Channel Up and the 1D RSI the November 15 2024 Low.
Since the 2-year pattern is also a Channel Up, this pull-back is a natural technical correction before the next Bullish Leg. Both previous rallies that started after long-term Accumulation Phases, then rallied by at least +45.10%.
As a result, we treat this correction as the most optimal medium-term buy opportunity to target $800 (top of dashed Channel Up and +45.10% from the Accumulation Phase bottom).
-------------------------------------------------------------------------------
** Please LIKE 👍, FOLLOW ✅, SHARE 🙌 and COMMENT ✍ if you enjoy this idea! Also share your ideas and charts in the comments section below! This is best way to keep it relevant, support us, keep the content here free and allow the idea to reach as many people as possible. **
-------------------------------------------------------------------------------
💸💸💸💸💸💸
👇 👇 👇 👇 👇 👇

META Technical Analysis and Trade Idea#META has experienced a remarkable bullish surge. However, the 1D timeframe indicates potential weakness as we see the trend ranging sidweays creating lower highs. We are considering a possible retracement towards the 50-61.8% Fibonacci zone potentiall trading through the gap evidenced on the chart. This area typically attracts increased liquidity due to sell stops, potentially encouraging long positions from institutional traders.
Trading Considerations Meta Platforms:
Counter-Trend Short: Explore a short entry near the current price level, strategically placing a stop-loss above the recent highs. Maintain a 1:1 risk-reward ratio for this trade.
Fibonacci Buy: Target a potential buy opportunity close to the 61.8% Fibonacci retracement level. This aligns with the possible accumulation of long positions by larger market players. Utilize a stop-loss below the recent swing low, and define target levels as shown on the screenshot.
Disclaimer: This analysis offers my personal market interpretation for educational purposes and should not be considered direct financial advice. Always prioritize your own independent research and thorough risk assessment before making any trading decisions.

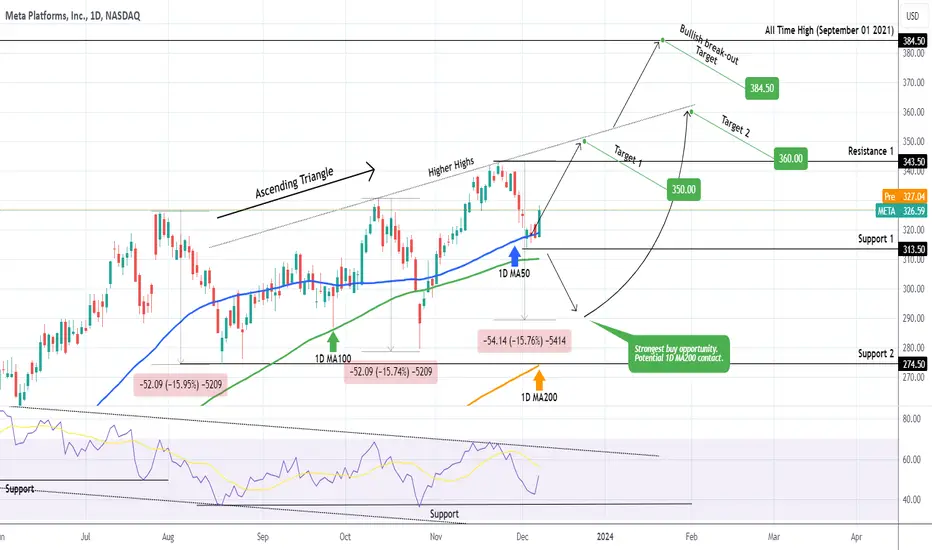
META Is it a BUY again?Meta Platforms (META) hit our $320.00 target after our most recent November 19 call (see char below) following a clear rejection on the Higher Highs trend-line:
The stock has since held the 1D MA50 (blue trend-line) as its short-term Support and turned into a buy again. The short-term target is still limited to the Higher Highs trendline and in that sphere of logic, we will target $350 (Target 1).
If however Support 1 (313.50) breaks, we might see another almost -16% decline, similar to the previous two bearish legs since July 28, which can test the 1D MA200 (orange trend-line). That will be the strongest buy opportunity on the medium-term and we will target again the Higher Highs trend-line at $360 (Target 2).
Any candle closing above the Higher Highs trend-line will be an automatic bullish break-out signal, targeting straight the All Time High at $384.50.
-------------------------------------------------------------------------------
** Please LIKE 👍, FOLLOW ✅, SHARE 🙌 and COMMENT ✍ if you enjoy this idea! Also share your ideas and charts in the comments section below! This is best way to keep it relevant, support us, keep the content here free and allow the idea to reach as many people as possible. **
-------------------------------------------------------------------------------
💸💸💸💸💸💸
👇 👇 👇 👇 👇 👇