Don’t Sleep on META Buy the Fear, Ride the AI Wave After an impressive run, META is taking a breather around $700. But let’s not forget—this stock was trading at $530 just a few months ago. With aggressive AI bets like the $14.8B stake in Scale AI and plans to develop superintelligent models, Meta isn’t just following the AI trend—it wants to lead it.
Now here's the setup:
We could see a healthy pullback before the next leg higher. The $620–$650 zone looks like a magnet if broader tech cools off short-term.
🔽 Entry Points (Dip Buy Zone)
⚡ $700 (speculative starter)
⚡ $665–650 (ideal swing entry)
⚡ $620 (major opportunity zone if fear takes over)
📈 Targets
🎯 TP1: $725
🎯 TP2: $805 – breakout into blue-sky territory
🎯 TP3: $850+ – long-term growth if AI hype turns into revenue reality
🧠
META’s AI investments and platform dominance are building real momentum. Volatility may offer the perfect second chance. Risk is real but so is the upside.
⚠️ Disclaimer: This is not financial advice. Do your own research before making any investment decisions. Markets are risky, trade responsibly.
Metasignals

META PUTS IN THE MORNINGHere is META currently rejecting the supply zone around 660.60. If price returns anywhere within the RED Zone tomorrow I will entering. If it Wicks at OPEN ill be entering heavy.

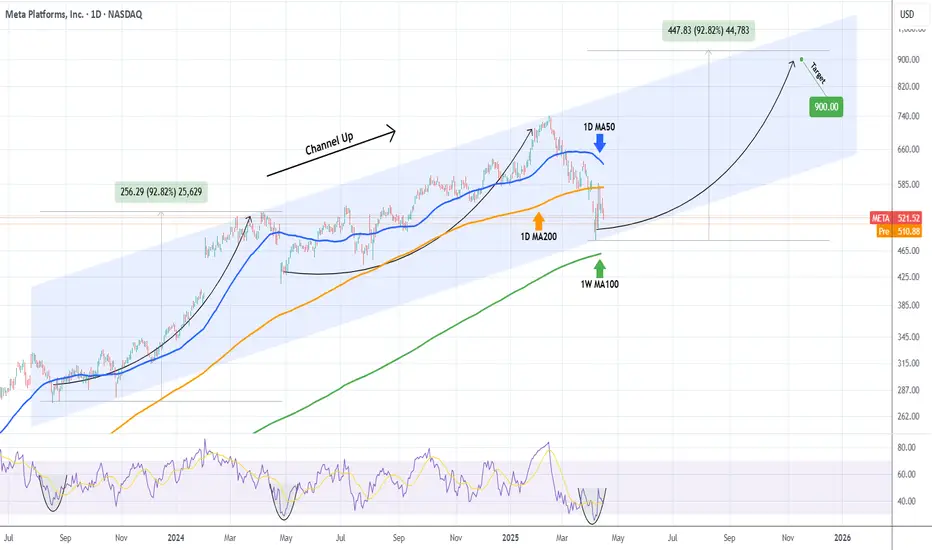
META Slow recovery but $900 possible this yearMeta Platforms (META) had a strong -35% correction in the past two months, dipping even below its 1D MA200 (orange trend-line). By doing so, it reached the bottom (Higher Lows trend-line) of the 2-year Channel Up and rebounded instantly.
The rebound has stopped so far on the 1D MA200 where it got rejected. This keeps the market neutral and the long-term bullish sentiment can only be resumed if the market breaks and closes above its 1D MA50 (blue trend-line). Until then we are neutral but only as long as the 1W MA100 (green trend-line) holds, below it the bearish trend is resumed and the correction can potentially reach -50% to -70%.
If however we close above the 1D MA50, expect a +90% rally, similar to the first Bullish Leg of the Channel Up, slow at start but aggressive after half point. Target $900.
-------------------------------------------------------------------------------
** Please LIKE 👍, FOLLOW ✅, SHARE 🙌 and COMMENT ✍ if you enjoy this idea! Also share your ideas and charts in the comments section below! This is best way to keep it relevant, support us, keep the content here free and allow the idea to reach as many people as possible. **
-------------------------------------------------------------------------------
💸💸💸💸💸💸
👇 👇 👇 👇 👇 👇
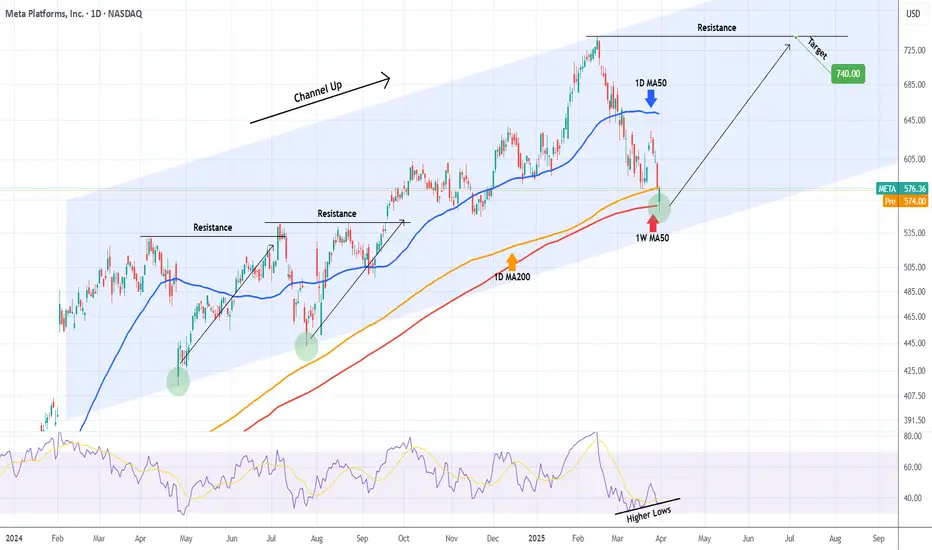
META Can it hold its 1W MA50?Meta Platforms (META) has been trading within a 1-year Channel Up and yesterday it hit its 1W MA50 (red trend-line), breaching the 1D MA200 (orange trend-line) which held the correction last week.
Even though the bottom of the Channel Up is currently $40 lower, holding he 1W MA50 is critical because it has been kept intact since the February 02 2023 bullish break-out.
The first signs are encouraging as the 1D RSI is on Higher Lows, despite the stock's Lower Lows, which is a Bullish Divergence. So as long as this Channel Up bottom Zone holds, we expect META to initiate its new Bullish Leg and test initially its previous Resistance (ATH) as it did on July 05 2024 and August 22 2024. Our Target is $740.
-------------------------------------------------------------------------------
** Please LIKE 👍, FOLLOW ✅, SHARE 🙌 and COMMENT ✍ if you enjoy this idea! Also share your ideas and charts in the comments section below! This is best way to keep it relevant, support us, keep the content here free and allow the idea to reach as many people as possible. **
-------------------------------------------------------------------------------
💸💸💸💸💸💸
👇 👇 👇 👇 👇 👇
META priced the new Channel Up bottom. Eyes $800 next.Meta Platforms (META) hit yesterday its 1D MA50 (blue trend-line) for the first time since January 02, while reaching the bottom of the short-term (dashed) Channel Up and the 1D RSI the November 15 2024 Low.
Since the 2-year pattern is also a Channel Up, this pull-back is a natural technical correction before the next Bullish Leg. Both previous rallies that started after long-term Accumulation Phases, then rallied by at least +45.10%.
As a result, we treat this correction as the most optimal medium-term buy opportunity to target $800 (top of dashed Channel Up and +45.10% from the Accumulation Phase bottom).
-------------------------------------------------------------------------------
** Please LIKE 👍, FOLLOW ✅, SHARE 🙌 and COMMENT ✍ if you enjoy this idea! Also share your ideas and charts in the comments section below! This is best way to keep it relevant, support us, keep the content here free and allow the idea to reach as many people as possible. **
-------------------------------------------------------------------------------
💸💸💸💸💸💸
👇 👇 👇 👇 👇 👇

META can turn bearish if it fails to break this Channel.Our previous call on Meta Platforms (META) was on July 26 (see chart below), almost 4 months ago when we gave a strong long-term buy signal on the 1D MA200 (orange trend-line):
Despite the excellent timing of the call, we has seen in the past 30 days that the price action has diverged from the model and the current Bullish Leg of the Channel Up isn't as strong as the previous two inside a 2 year span that each rose by +95%.
The price has instead turned sideways, mimicking the price action of the two Accumulation Phases that emerged after each of the Bullish Legs topped. The 1D RSI being on a Bearish Divergence (Channel Down already) technically agrees with that, so if you followed our July buy call, it might be best to book the handsome profit now and wait.
What to wait for? Well it all depends on a new pattern that has emerged, a Diverging Channel Up (dashed trend-lines). As long as the price is trading inside it, there is greater probability to give us a lower buy entry near the 1D MA200 (orange trend-line) again. In that case we will take it and target the top of the Diverging Channel Up at $660.
In the event that the price breaks above the Diverging Channel Up, we will buy the bullish break-out and pursuit the previous $800 Target as that would mean that the original 2-year Channel Up remains the underlying pattern dictating the long-term movement of the stock.
-------------------------------------------------------------------------------
** Please LIKE 👍, FOLLOW ✅, SHARE 🙌 and COMMENT ✍ if you enjoy this idea! Also share your ideas and charts in the comments section below! This is best way to keep it relevant, support us, keep the content here free and allow the idea to reach as many people as possible. **
-------------------------------------------------------------------------------
💸💸💸💸💸💸
👇 👇 👇 👇 👇 👇

META History repeating Double Bottom leading to $800.Meta Platforms (META) almost hit its 1D MA200 (orange trend-line) yesterday, a Support level that has been holding since February 01 2023. With the long-term pattern being a Channel Up since the November 04 2022 market bottom, yesterday's Low is similar to the Double Bottom on Meta's previous Accumulation phase on October 26 2023.
That day's Low started the 2nd Bullish Leg of the Channel Up that peaked on April 08 2024 after a +95.14% rise. This is the exact same % rise as the Feb 24 2023 - July 28 2023 Bullish Leg, which was the 1st of the Channel Up.
As a result, this is technically the most optimal buy opportunity on a long-term basis for META, with a technical Target at $800.00 (+95.14% as the previous 2 Bullish Legs).
-------------------------------------------------------------------------------
** Please LIKE 👍, FOLLOW ✅, SHARE 🙌 and COMMENT ✍ if you enjoy this idea! Also share your ideas and charts in the comments section below! This is best way to keep it relevant, support us, keep the content here free and allow the idea to reach as many people as possible. **
-------------------------------------------------------------------------------
💸💸💸💸💸💸
👇 👇 👇 👇 👇 👇

Meta stock for Short in Strong Up Trend.meta stock is currently in strong up trend but in shorter duration is will likely to consolidate and show down trend towards 520-510 . weekly duration we can see little downside in meta stock.

META New rally to $800 started.Meta Platforms (META) is consolidating within the 1D MA50 (blue trend-line) and 1D MA100 (green trend-line) only 3 weeks after it touched the bottom (Higher Lows trend-line) of the 1-year Channel Up.
This is the start of the new Bullish Leg of the pattern, half-way through the accumulation process. Once the 1D RSI breaks above its Lower Highs trend-line, we will have a bullish confirmation signal similar to October 06 2023. Our Target is $800.00, which represents a +95% rise, similar to both previous Bullish Legs of the Channel Up.
-------------------------------------------------------------------------------
** Please LIKE 👍, FOLLOW ✅, SHARE 🙌 and COMMENT ✍ if you enjoy this idea! Also share your ideas and charts in the comments section below! This is best way to keep it relevant, support us, keep the content here free and allow the idea to reach as many people as possible. **
-------------------------------------------------------------------------------
💸💸💸💸💸💸
👇 👇 👇 👇 👇 👇

TESLA lays off more than 10% staff. Is this its 'META moment'?It was reported this morning that Tesla (TSLA) "will lay off more than 10% of its global workforce, an internal memo seen by Reuters on Monday shows, as it grapples with falling sales and an intensifying price war for electric vehicles".
The market has so far reacted with strong selling of more than -3% in early trading. But is this really bad news?
Not so long ago (November 09 2022), another high tech giant that was heavily decimated at the time, Meta Platforms (META), announced lay offs of around 13% of the company (more than 11000 employees). This was just 5 days after the November 04 2022 market bottom. The result (chart on the right) was an aggressive recovery above the 1D MA50 (blue trend-line), which turned into a Support for 240 days straight.
Of course the fundamental difference is that the 2022 Low for Meta was the Bear Cycle bottom of the Inflation Crisis while Tesla's Channel Down has been the picture of its underperformance for almost a year relative to the rest of the market (and the Magnificent 7 in particular).
However it shouldn't be overlooked that such cost driven news are fundamentals capable of turning the profitability of a company around and Meta's case is such a representative example. Meta was massively oversold in November 2022 (-75% from ATH) and similarly Tesla is massively oversold now (-60% from ATH). Meta managed to completely recover and smash through to new All Time Highs (+38% from previous ATH). In November 2022 it was all doom and gloom for the social media giant and it is worth searching for news headlines at the time to see the similarities with Tesla's situation today.
Time will tell of course, but we wanted to bring this comparison to you and help you draw your own conclusions.
-------------------------------------------------------------------------------
** Please LIKE 👍, FOLLOW ✅, SHARE 🙌 and COMMENT ✍ if you enjoy this idea! Also share your ideas and charts in the comments section below! This is best way to keep it relevant, support us, keep the content here free and allow the idea to reach as many people as possible. **
-------------------------------------------------------------------------------
💸💸💸💸💸💸
👇 👇 👇 👇 👇 👇

META Is it finally time to correct?Meta Platforms (META) has been among the biggest winners in 2023 and of course is having a great start to 2024 as well. Those who follow us know that we have been big bulls on META even right on its 2022 bottom (see charts below), when most of the market had lost faith in the company's operations, business model and its ability to generate profit.
We even mapped to perfections its V-shaped recovery to new All Time Highs (ATH)
As the company had one of its best 1W candles in history last week following the dividends announcement, we are starting to consider a short/ medium-term pull-back for the stock. This is also justified by historic price action. Since the current large Megaphone pattern started in mid 2018, META has corrected to or below its 0.236 Fibonacci retracement level within a -16.00% to -19.77% decline range, 5 times. On all cases except for the initial 2023 recovery, the 1W RSI was overbought above the 70.00 mark. Right now the 1W RSI is on its most overbought state in history.
As a result, we have a growing belief that it is time for the social media giant to start correcting again. A minimum of -16.00% decline will deliver a $410.00 Target level for META, just below the 0.236 Fibonacci level. Note that during all such declines, the 1W MA5 (blue trend-line) provided support, closing all candles above it.
Do you think it is time for a 4 - 6 week correction?
-------------------------------------------------------------------------------
** Please LIKE 👍, FOLLOW ✅, SHARE 🙌 and COMMENT ✍ if you enjoy this idea! Also share your ideas and charts in the comments section below! This is best way to keep it relevant, support us, keep the content here free and allow the idea to reach as many people as possible. **
-------------------------------------------------------------------------------
💸💸💸💸💸💸
👇 👇 👇 👇 👇 👇

META One more rally before correction.Meta Platforms (META) gave us an excellent bottom buy opportunity last time we looked at it (December 08 2023, see chart below) having hit already Target 1 (350.00) and currently going for Target 2 (384.50) following the Higher Highs break-out:
As long the Higher Highs trend-line holds, we expect a technical rejection at or slightly above the 384.50 All Time High (ATH) target and subsequent correction towards at least the 1D MA50 (blue trend-line). The last medium-term correction has been -8.70%, which gives us a minimum target of 351.00 on the downside.
If the decline extends, we can see a maximum (from a technical perspective) decline of around -15.75% (similar to October 26 and August 18 2023) that could test the 1D MA200 (orange trend-line) and will be the strongest long-term buy opportunity.
-------------------------------------------------------------------------------
** Please LIKE 👍, FOLLOW ✅, SHARE 🙌 and COMMENT ✍ if you enjoy this idea! Also share your ideas and charts in the comments section below! This is best way to keep it relevant, support us, keep the content here free and allow the idea to reach as many people as possible. **
-------------------------------------------------------------------------------
💸💸💸💸💸💸
👇 👇 👇 👇 👇 👇

META Is it a BUY again?Meta Platforms (META) hit our $320.00 target after our most recent November 19 call (see char below) following a clear rejection on the Higher Highs trend-line:
The stock has since held the 1D MA50 (blue trend-line) as its short-term Support and turned into a buy again. The short-term target is still limited to the Higher Highs trendline and in that sphere of logic, we will target $350 (Target 1).
If however Support 1 (313.50) breaks, we might see another almost -16% decline, similar to the previous two bearish legs since July 28, which can test the 1D MA200 (orange trend-line). That will be the strongest buy opportunity on the medium-term and we will target again the Higher Highs trend-line at $360 (Target 2).
Any candle closing above the Higher Highs trend-line will be an automatic bullish break-out signal, targeting straight the All Time High at $384.50.
-------------------------------------------------------------------------------
** Please LIKE 👍, FOLLOW ✅, SHARE 🙌 and COMMENT ✍ if you enjoy this idea! Also share your ideas and charts in the comments section below! This is best way to keep it relevant, support us, keep the content here free and allow the idea to reach as many people as possible. **
-------------------------------------------------------------------------------
💸💸💸💸💸💸
👇 👇 👇 👇 👇 👇
META Buy only if this trend-line breaks.Meta Platforms (META) hit last week the top (Higher Highs trend-line) of the Ascending Triangle pattern after breaking the previous High (Resistance 1 at 330.00). This is so far the peak of the technical rally and we will buy only after 1D MA50 (blue trend-line) pull-back (1D RSI ideally on the Support Zone) or if the price closes a 1D candle above the Higher Highs trend-line first. In both cases, the bullish target will be 384.50. Until though the Higher Highs trend-line breaks, we will be selling, targeting 320.00.
-------------------------------------------------------------------------------
** Please LIKE 👍, FOLLOW ✅, SHARE 🙌 and COMMENT ✍ if you enjoy this idea! Also share your ideas and charts in the comments section below! This is best way to keep it relevant, support us, keep the content here free and allow the idea to reach as many people as possible. **
-------------------------------------------------------------------------------
💸💸💸💸💸💸
👇 👇 👇 👇 👇 👇

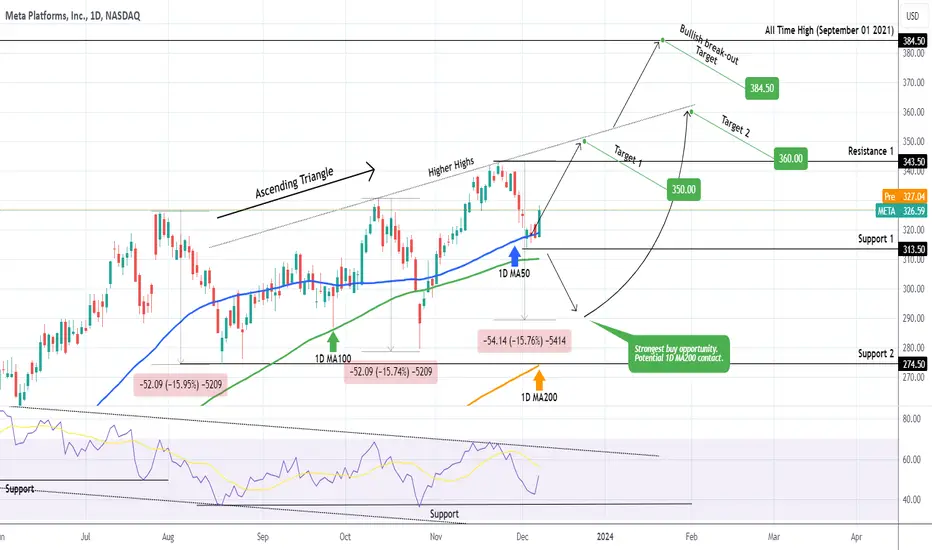
META Is it a buy again?Two months since we gave a successful buy signal (see chart below) on Meta Platforms (META) and the stock is yet again found after an aggressive selling sequence:
The (almost) 12-month long Bullish Megaphone may be still intact but this time the price dropped below both the 1D MA50 (blue trend-line) and the 1D MA100 (green trend-line). It is however approaching not just the bottom (Higher Lows trend-line) of the Bullish Megaphone, but also Support 1 (274.50).
What makes Meta a strong buy already is that the 1D RSI entered the Buy Zone, which is the area within the bottom of its Channel Down and the Support. As long as the 1D MA200 (orange trend-line) holds, buying some here and the rest at the bottom of the Bullish Megaphone is the most optimal approach for the medium-term.
As you can see, the price action follows very distinct time Cycles (dashed curves) and right now the new one is about to begin. Our target is the $384.50 All Time High of September 01 2021.
-------------------------------------------------------------------------------
** Please LIKE 👍, FOLLOW ✅, SHARE 🙌 and COMMENT ✍ if you enjoy this idea! Also share your ideas and charts in the comments section below! This is best way to keep it relevant, support us, keep the content here free and allow the idea to reach as many people as possible. **
-------------------------------------------------------------------------------
💸💸💸💸💸💸
👇 👇 👇 👇 👇 👇

META First Buy signal in a month.We have been issuing strong buy signals on Meta Platforms (META) since November last year. A perfect example was our February 02 (see chart below) analysis that came with a huge final bullish warning while the price was still at $189.00:
Following the recent -15% pull-back, the strongest correction basically since the November 03 2022 market bottom, the stock price is flashing again the first buy signal on the medium-term as it is testing the 1D MA50 (blue trend-line) as a Resistance after a rebound near the 1D MA100 (green trend-line), which has been intact since January 10.
On top of that, the 1D MACD is on course to form the first Bullish Cross below 0.0, since November 09 2022, which was essentially the bottom of the Bear Cycle. As long as the 1D MA100 is intact, we will buy the 1D MA50 (candle) closing and target 326.25 (Resistance 1). If it closes a 1D candle below the 1D MA100 instead, we will wait and add a 2nd buy position at 260.00, near the Higher Lows trend-line and keep it as long as the 1D MA200. The target for that position will be even higher, as it will be a long-term buy signal, aiming at the All Time High of 384.50.
-------------------------------------------------------------------------------
** Please LIKE 👍, FOLLOW ✅, SHARE 🙌 and COMMENT ✍ if you enjoy this idea! Also share your ideas and charts in the comments section below! **
-------------------------------------------------------------------------------
💸💸💸💸💸💸
👇 👇 👇 👇 👇 👇

META Is this the start of a significant correction?Since November last year we have been issuing a strong buy signal on Meta Platforms (META) and our most recent analysis on February 02 (see chart below) came with a huge final bullish warning while the price was still at $189.00:
The stock hit $320.00 last week, almost filling the gap with the 1W candle of January 31 2022 (practically META's start of collapse) and pulled-back. The big question on the market this week is, can that be the start of a greater correction?
Well technically it is testing today the first key support level, the Higher Lows trend-line (bottom) of the 6 month Channel Up pattern that started in late February. If broken, it is unlikely to see the 1D MA50 (red trend-line) hold.
The key (technical) reason behind it, is the massive Bearish Cross that got formed this week on the 1W MACD. This is a major development as it is a rare event that always initiated a rather notable pull-back. More specifically, in the past five (5) years, we have had another six (6) 1W MACD Bearish Crosses, all making a Lower Lows after it. The minimum correction was -17.33% while the maximum -43.50%. Practically META made its large corrections (-43.50%, -38.60%) when it faced legal action and during the pandemic. The rest standard (technical) pull-backs ranged from -17.33% to -19.70% (also -28.15% on the last Bearish Cross but fundamentals were also present).
This is the reason we expect a pull-back below the 1D MA50 if the Higher Lows of the Channel Up fail (to close 1D candles above it). The minimum projected correction range of -17.33% would give us a pull-back to $265.00. A -19.70% would give $256.00.
That would start making META a technical buy again, where long term investors can start applying buying strategies with a tolerance level up to the 1W MA50 (blue trend-line).
-------------------------------------------------------------------------------
** Please LIKE 👍, FOLLOW ✅, SHARE 🙌 and COMMENT ✍ if you enjoy this idea! Also share your ideas and charts in the comments section below! **
-------------------------------------------------------------------------------
💸💸💸💸💸💸
👇 👇 👇 👇 👇 👇

META suppressed by the 0.786 level of the golden section! META suppressed by the 0.786 level of the golden section!
This chart shows the weekly candle chart of META stocks over the past two years. The graph overlays the top to bottom golden section of 2021. As shown in the figure, the high point of META stock in the past two weeks has been suppressed by the 0.786 level of the golden section in the figure, and it has now returned to below the 1.000 level of the golden section! In the next few weeks, the META stock is likely to step back at the 1.382 position in the golden section of the chart, and then choose a direction to break through!

Meta waiting for selling a stop order !according to my chart analysis Meta Facebook will go down if price reached entry level .

META You were warned. This is a V-shaped recovery.Meta Platforms (META) stock is surging through the roof following the encouraging Fed outlook on future rate hikes and Zuckerberg's promises on stock buy-backs, cost cutting and focus on profitability.
We warned META was an excellent buy last month after closing two straight green monthly candles as well as back in November when we advised to buy at the bottom, an article that naturally made the Editor's Pick of TradingView:
Now that our $173 target got hit, which was calculated on the Inverse Head and Shoulders dynamics, we will again look at the even wider picture on the 1M time-frame:
The price has smashed through the 1W MA50 (blue trend-line) and the 0.5 Fibonacci retracement level and the next technical target is the 0.618 Fib, with the 1W MA200 (orange trend-line) right above it. We don't expect that to happen overnight but by the end of Q2 and of course there will be weekly pull-backs to take advantage of and the red 1W RSI overbought zone can really help estimating them as it has been extremely accurate since April 2019.
Then depending on whether or not the Fed pauses on its rate hike policy, we can see an end of the year rally above the 0.786 Fib, which by that time will have set in motion a complete gap fill on the $385 All Time High.
-------------------------------------------------------------------------------
** Please LIKE 👍, FOLLOW ✅, SHARE 🙌 and COMMENT ✍ if you enjoy this idea! Also share your ideas and charts in the comments section below! **
-------------------------------------------------------------------------------
💸💸💸💸💸💸
👇 👇 👇 👇 👇 👇

META The worst is history! 6 straight green weeks.Our update on The Meta Platforms (META) on the 1W time-frame.
What stands out is that the stock has completed six (6) straight weekly candles, for the first time since March 2017! This is one of the strongest bullish sequences in its history and while at it, it has established 2 weeks above the 1D MA100 (green trend-line) for the first time since its September 2021 All Time High!
The short-term target is the 1W MA50 (blue trend-line), which is within the technical target of the Inverse Head and Shoulders (IH&S) that we can argue formed the October 2022 market bottom. With the RSI hitting the top of a Higher Highs trend-line that started on March 28 2022, it is possible to see a minor pull-back now to test the 1D MA50 (red trend-line) as a Support, but that will be the best long-term buy opportunity before we hit the 1W MA50.
-------------------------------------------------------------------------------
** Please LIKE 👍, FOLLOW ✅, SHARE 🙌 and COMMENT ✍ if you enjoy this idea! Also share your ideas and charts in the comments section below! **
-------------------------------------------------------------------------------
💸💸💸💸💸💸
👇 👇 👇 👇 👇 👇

META Closed 2 straight green months, the first time since 2021!Meta Platforms (META) is on a strong January monthly candle (chart on the right) having closed in December two straight green months for the first time since August 2021, which was its All Time High. This alone is a huge bullish development, which along with the 1M RSI being on an Inverse Head and Shoulders pattern (IH&S), it can start staging its long-term bullish reversal.
On the more medium-term 1D time-frame (chart on the left), Meta also made a significant bullish development, as yesterday it clearly broke (but failed to close) above the 1D MA100 (green trend-line), for the first time in one whole year (since December 30 2021). Having turned the 1D MA50 (blue trend-line) into a Support this last month (since December 12), if it manages to close a daily candle above the 1D MA100, the stock's next aim would be the 1D MA200 (orange trend-line).
The 1W RSI also had a major bullish break-out as it broken above a Resistance Zone holding since August 15, that previously had rejected the price a total of three times (Triple Top). In our view we can claim that Meta has a sustainable bullish reversal only if it breaks above the 1D MA200.
-------------------------------------------------------------------------------
** Please LIKE 👍, FOLLOW ✅, SHARE 🙌 and COMMENT ✍ if you enjoy this idea! Also share your ideas and charts in the comments section below! **
-------------------------------------------------------------------------------
💸💸💸💸💸💸
👇 👇 👇 👇 👇 👇

META tradeplanHello Birdies,
As we see alot of resistance on chart in form of channel retest and pivot circles.
Get ready for shorting this stock.
We are seeing bounce area on 78 and on 58
