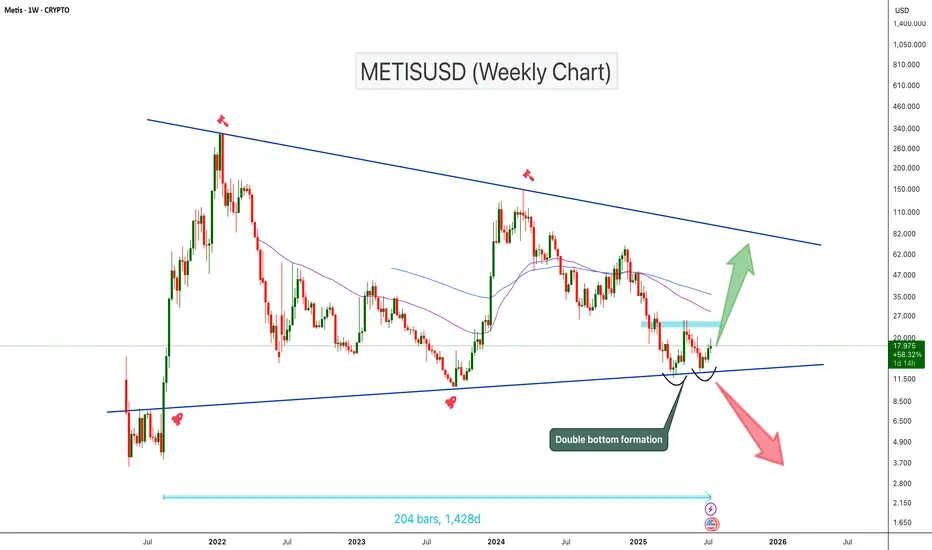
METISUSD Double Bottom at Triangle Support!METISUSD has been trading inside a symmetrical triangle for the past 1,400 days. The price is currently sitting at the triangle support and forming a potential double bottom pattern. The double bottom can be confirmed once the price breaks the neckline resistance zone. If the price breaks this key resistance zone, we could expect a 100%–250% bullish move toward the triangle’s upper resistance
Cheers
Hexa🧘♀️
BINANCE:METISUSDT SEED_DONKEYDAN_MARKET_CAP:METIS
Metis
METISUSDT 1W AnalysisMETIS ~ 1W Analysis
#METIS Buy back gradually from here if you still have confidence in this coin with a short term target of at least 20%+ from here.

#METIS/USDT#METIS
The price is moving within a descending channel on the 1-hour frame, adhering well to it, and is heading for a strong breakout and retest.
We are seeing a bounce from the lower boundary of the descending channel, this support at 14.73.
We have a downtrend on the RSI indicator that is about to be broken and retested, supporting the upward trend.
We are looking for stability above the 100 moving average.
Entry price: 18
First target: 19.78
Second target: 22
Third target: 25

METISUSDT 1WMETIS ~ 1W Analysis
#METIS Buy gradually from here with a short -term target of at least 20%+. This is the lowest support for now.

METIS Rebuy Setup (2D)The METIS token, after experiencing significant drops, is approaching a strong support level.
We are looking for buy/long positions within the green zone.
A daily candle closing below the invalidation level will invalidate this analysis.
Do not enter the position without capital management and stop setting
Comment if you have any questions
thank you

METISUSDT 4DMETIS ~ 4D
#METIS So far it still maintains this support block,. If you still have Conviction on this coin,. Buy from here with a minimum target of 20%+

SasanSeifi| Will the Price Move Towards $60?Hey there,✌On the daily timeframe BINANCE:METISUSDT , as you can see, the price encountered a correction after reaching the supply zone. After this correction, the price faced an increase in demand around the $35 level and is now trading within the important supply zone at $46.
The mid-term analysis suggests that the market trend is more likely to move upwards. If the price successfully breaks through the supply zone and stabilizes above the $48 level, it is expected that the price will move towards higher levels, such as $53. After this move, there might be a negative reaction and the formation of a range zone, followed by a pullback, after which the price could reach higher levels such as $60 and even $66.
From a mid-term perspective, if the price reaches the $60 level, observing the price reaction at this level can help us gain a better understanding of the future trend. If we see demand at this level, it is likely that in the long term, the price could reach its long-term target of $75, experiencing significant growth. The short-term support zone for the price is currently between $43 and $40, which can be considered.
💢 Please remember that this is just my personal viewpoint and should not be taken as investment advice. I’d love to hear your thoughts and share opinions!
Happy trading!✌😎
Sure, if you have any more questions or need further clarification, feel free to ask. I'm here to help!✌

METIS is a racket (3D)METIS now seems to be in wave c of C, which is a bullish wave.
The targets of this wave based on the big wave A and wave a of C can be very attractive.
The time frame is 3 days, which means that this analysis needs time to be realized.
The green area is our BUY area.
Closing a daily candle below the invalidation level will violate this analysis
invalidation level: 28.08$
For risk management, please don't forget stop loss and capital management
Comment if you have any questions
Thank You


SasanSeifi| Is a Bullish Breakout Around the Corner?Hey there, ✌ In the daily chart of BINANCE:METISUSDT , as shown, the price has been on a downtrend since reaching the $76 level. After this decline, the price reacted to the $25 level, entering a range between $25 and $42. During this period, the price experienced some fluctuations and relative growth.
Currently, after hitting the $42 level twice, the price has pulled back to the demand zone. In this area, we’re seeing some positive movement, with the price now trading near the downward trend line. It appears that a Double Bottom pattern has formed around the $31 level, which could signal a minor upward move.
If, in the daily timeframe, the downtrend line and the $37 to $38 price range are broken, and the price stabilizes above this level, there is a chance for an increase towards the $40 and $42.50 resistance zones. In such a scenario, it will be important to monitor how the price reacts to these higher targets. Should the price break through the $42 level and maintain its position above it, the next potential target could be the supply zone between $46 and $50.
For risk-tolerant traders, the $36 price range could serve as an entry point. Additionally, upon a breakout and stabilization above the downtrend line, more secure entry points may be identified.
The key support area for METIS lies between $33 and $31. Holding this support zone is crucial for a bullish scenario. If this level is lost, further price declines are likely.
Sure, if you have any more questions or need further clarification, feel free to ask. I'm here to help!
If you found my analysis helpful, I would appreciate it if you could show your support by liking and commenting. Thank you!🙌✌

METISUSDT Breaks Out of Descending Channel: Bullish Rally ExpectMETISUSDT technical analysis update
METIS has broken the descending channel resistance line on the daily chart and is now preparing to break the previous higher low. If the price successfully breaks the previous higher low, we can expect a strong bullish move. Additionally, the price is about to cross above the 100 EMA on the daily chart.
Regards,
Hexa

SasanSeifi|Metis Analysis: Potential Breakout Ahead?
In the 10-hour timeframe, as you can see, The price has touched the downward trend line four times and is now trading around the critical $32 level. Given the previous interactions with the trend line, a breakout seems possible.
If the trend line is broken, we can expect the price to rise towards targets around $35, followed by a potential further increase to the $37-$38 range after a minor correction. To understand the ongoing trend better, observe how the price reacts to the $35 level. Key support is at $29-$28.
This analysis is my personal viewpoint and not financial advice. If you found this helpful, please like and comment – I’d love to hear your thoughts! Happy trading! ✌😊

METISUSDTMETIS ~ 5D ✅
#METIS Make purchases gradually after successfully breaking through this descending pattern.

METIS/USDT LONG SCALP TRADE SETUP!!Hey everyone!
If you're enjoying this analysis, a thumbs up and follow would be greatly appreciated!
METIS Looks good here. Breaks out from the bull flag and a retest is also done. Long some here and add more in the dip.
Target1:- $52
Target2:- $54
Target3:- $56
SL- $48.5
Lev:- 10x-20x

METIS || Targets and PathsEverything you have to know about Metis is plotted on this chart.
We are still developing an AI Smart ( All in One ) indicator that will expertise your chart cleanly and effectively.

METISUSD 1WMATIS ~ 1W
#METIS We see price will Retest this Support Block, we will place a small buy here. with a long-term target of at least 25%.

METIS 2nd wave before a mega bullish 3rdThe bull run target is +1000$ in my opinion.
The stoploss/ cancelation is <12$

METIS || Targets and Paths || UpdateThe price path is going as we predicted in the previous idea,
Now, these are the updated targets and paths.
We are still developing an AI Smart ( All in One ) indicator that will expertise your chart cleanly and effectively.

Metisusdt.... Tecnicall analysis Metis is in a positive and bullish kinetic wave. I expect high growth based on Fibonacci and support and resistance points for Metis.

METIS is Very BullishIt looks like we have an ABC on the chart. Wave B has just ended and we are now entering Wave C. We are at the beginning of wave C.
Wave B looks like a triangle.
We have identified two short-term targets for METIS.
Closing a daily candle below the invalidation level will violate the analysis.
For risk management, please don't forget stop loss and capital management
When we reach the first target, save some profit and then change the stop to entry
Comment if you have any questions
Thank You

METIS || Bullish pattern & Candlesticks The Chart explains itself!
METIS >>
TP1 = 104
TP2 = 124
TP3 = 167
TP4 = 200
I hope it will do!


Bitcoin Update | Alt Coin Update | Crypto Update | 06 Feb 2024Hello Traders ,
Check the latest update on Bitcoin , Alt Coin and Crypto Market
