April 29 Bitcoin Bybit chart analysisHello
It's a Bitcoinguide.
If you have a "follower"
You can receive comment notifications on real-time travel routes and major sections.
If my analysis is helpful,
Please would like one booster button at the bottom.
This is the Nasdaq 30-minute chart.
There will be an indicator announcement at 11 o'clock in a little while.
After the 4-hour chart MACD dead cross was imprinted yesterday
Today, two things are clear
*Red finger strong rise or purple finger major rebound.
The main issue was whether the 6-hour chart MACD dead cross occurred
After writing the analysis, looking at the overall movement
The purple finger seems strong today.
Let's apply it to Bitcoin as it is.
This is a 30-minute Bitcoin chart.
At the bottom left, I connected the long position entry point of $93,046 that I entered in the analysis article on the 25th.
Bitcoin and Tether dominance are moving sideways.
Bitcoin is slightly more advantageous in terms of MACD signals or Ichimoku Kinko Hyo,
but it is not strange if one side skyrockets or plummets.
While moving sideways, I was watching Nasdaq,
and I paid attention to the Nasdaq movement.
*Red finger movement path
One-way long position strategy
1. 94242.4 dollar long position entry section / green support line breakaway stop loss price
2. 96005.1 dollar long position 1st target -> Top 2nd target -> Final Good
The 1st section at the top is the rising wave position
If you touch it first, the possibility of success of the strategy increases.
If the strategy is successful, it would be good to use it as the final long position re-entry.
Depending on the adjustment coming out of Nasdaq, it can be pushed up to section 2
Roughly, it is the support line of the Bollinger Band 6-hour chart.
If the rebound fails in Nasdaq
Bottom -> Please note that it can be pushed to section 3.
Up to this point, please use my analysis as a simple reference and use.
Thank you.
Mexc

April 25 Bitcoin Bybit chart analysisHello
It's a Bitcoinguide.
If you have a "follower"
You can receive comment notifications on real-time travel routes and major sections.
If my analysis is helpful,
Please would like one booster button at the bottom.
This is the Nasdaq 30-minute chart.
There is no separate indicator announcement.
I bet on a red finger upward sideways movement or a strong rebound.
If the green support line is maintained,
the short-term pattern will be maintained and it is a safe zone, so it seems that there will be no big effect on Bitcoin.
The short-term pattern is broken from the bottom 2,
and the bottom section is the 1+4 section, so if it succeeds in rebounding without breaking away from the true blue support line,
it is good for a long position.
I just applied it to Bitcoin.
This is a Bitcoin 30-minute chart.
The purple finger section on the lower left is the section where the long position was entered in the analysis article on the 23rd.
*When the red finger moves,
it is a one-way long position strategy.
1. $93,046 long position entry section / stop loss price when the green support line is broken
2. $95,562.5 long position 1st target -> Top 2nd -> Good 3rd section,
and when the Good section is broken, the possibility of a new high is high.
The 1st section at the top is the rising wave confirmation section
The green support line 2nd section that I marked is the safe section.
The final match was held in the 1+4 section
If the strategy is successful, the 1st section on the right is the long position re-entry and utilization section
I left a simulation with the pink finger.
From the bottom breakout, until the additional weekly candle is created next Monday,
I have sequentially displayed the main prices and support lines,
so please refer to them,
and please use my analysis articles only for reference and use,
and I hope you operate safely with the principle trading and stop loss price.
Thank you for your hard work this week.
Thank you.

April 23 Bitcoin Bybit chart analysisHello
It's a Bitcoinguide.
If you have a "follower"
You can receive comment notifications on real-time travel routes and major sections.
If my analysis is helpful,
Please would like one booster button at the bottom.
Yesterday, after a long time, the participation rate on TradingView was good, so
I will continue with a series of full-public analysis articles.
At the top is the Nasdaq 30-minute chart.
There will be an indicator announcement at 11 o'clock in a little while.
Based on the gap section created at the top and bottom,
I predicted the movement of the blue finger movement path.
This is the Bitcoin 30-minute chart.
Recently, Bitcoin has been moving autonomously,
and Tether dominance is in a vertical decline.
I won't tell you the reason for the Nasdaq decoupling separately.
The core of today's strategy is trend following.
I have never talked about all possibilities up and down without a single entry point.
*One-way long position strategy when the red finger moves
1. 93,068.9 dollar long position entry section / cut-off price when the purple support line is broken
2. 96,784 dollar long position 1st target -> Good 2nd target
Please note that the possibility of a new high is very high when the Good section is broken.
From 1 to Gap 8 at the top,
if coupled with Nasdaq, it is an upward wave. (After touching the top, wait for a long entry at the bottom)
Since the success rate can be high, please consider it as a long wait without operating a separate short position
Up to section 2 is the maximum long position waiting section.
Bottom->3 is a downward sideways movement.
The reason why I set the stop loss price when the purple support line breaks today is
Because it is the place where the previous low of the daily candle created today is broken
If it is pushed hard, it can fall to the bottom 89,597 dollars (1+4) section.
Up to this point, please use my analysis article only for reference and
I hope you operate safely with principle trading and stop loss prices.
Thank you.

April 22 Bitcoin Bybit chart analysisHello
It's a Bitcoinguide.
If you have a "follower"
You can receive comment notifications on real-time travel routes and major sections.
If my analysis is helpful,
Please would like one booster button at the bottom.
This is the Bitcoin 30-minute chart.
There is no Nasdaq indicator announcement.
Tether dominance is in a vertical decline.
First, I ignored Nasdaq and focused on Bitcoin based on my perspective on recent movements.
In the case of Bitcoin, I proceeded with a conservative strategy when the short-term pattern was broken.
*One-way long position strategy when the red finger moves
1. 88,211.9 dollars long position entry section / cut-off price when the green support line is broken
2. 90,418 dollars long position 1st target -> Top 2nd target
If the strategy is successful, the 1st section at the top
can be used as a long position re-entry section,
but from the Top section -> Good section, it is the center line of the weekly Bollinger Band chart,
so there is a possibility of a strong adjustment this week.
Section 1 at the top and section 2 at the bottom are extreme horizontal support sections.
If section 2 is broken, it is a section where the short-term pattern is broken,
and since the bottom touch at the bottom is the lowest point of the daily chart,
it is not good,
and since the support line is open, it can be directly connected to section 3.
Up to this point, I ask that you simply refer to and use my analysis,
and I hope that you operate safely with principle trading and loss cut prices.
Thank you.

April 17 Bitcoin Bybit chart analysisHello
It's a Bitcoinguide.
If you have a "follower"
You can receive comment notifications on real-time travel routes and major sections.
If my analysis is helpful,
Please would like one booster button at the bottom.
This is the Bitcoin 30-minute chart.
Nasdaq indicators will be announced at 9:30 in a little while.
The purple finger section on the left
is connected to the short->long switching section that was performed on the 16th.
* When the blue finger moves,
Bidirectional neutral
Short->long switching strategy or long waiting if it goes down right away.
1. 85,728.6 dollars short position switching / cut-off price when orange resistance line is broken
2. 84,595.8 dollars long position switching / cut-off price when green support line is broken
3. 86,871.5 dollars long position 1st target -> Good 2nd target
Today's 12-hour chart MACD dead cross is an ignoring strategy. Check if the purple support line deviates from the current position,
and from the 1st section of the green support line deviates,
even those who have been holding long positions since yesterday can operate at the same stop loss price.
If the short position entry section at the top comes down without touching,
the 2nd section at the bottom is the final long waiting section (6+12 pattern),
and if the rebound is not good in this section and it is pushed,
it may continue to fall to the 3rd section at the bottom due to the pressure of the 12-hour chart MACD dead cross.
Up to this point, please use my analysis article only for reference and use,
and I hope you operate safely with the principle trading and stop loss price.
Thank you.

April 14 Bitcoin Bybit chart analysisHello
It's a Bitcoinguide.
If you have a "follower"
You can receive comment notifications on real-time travel routes and major sections.
If my analysis is helpful,
Please would like one booster button at the bottom.
Here is the Bitcoin 30-minute chart.
There is no Nasdaq indicator announcement today.
I created a strategy based on the possibility of a strong decline in Tether dominance centered on the Gap section at the bottom of Nasdaq and Bitcoin.
*One-way long position strategy when the red finger moves
1. 83,690.8 dollars long position entry section / cut-off price when the green support line is broken
2. 85,772.3 dollars long position 1st target -> Top 2nd -> Good 3rd target.
If the strategy is successful, I have indicated the long position re-entry section.
Today, it is best to maintain the purple support line
because it maintains the mid-term pattern and the daily candle bottom section.
The mid-term pattern can be broken from the 1st section,
and it can be a sideways market until the 2nd section,
and it can decline step by step from the bottom -> 3rd section.
Up to this point, I ask that you simply use my analysis for reference and use only.
I hope that you operate safely with the principle of trading and cut-off price.
Thank you.

April 4 Bitcoin Bybit chart analysisHello
It's a Bitcoinguide.
If you have a "follower"
You can receive comment notifications on real-time travel routes and major sections.
If my analysis is helpful,
Please would like one booster button at the bottom.
Here is the Nasdaq 30-minute chart.
There are indicators released at 9:30 and 12:00.
First of all, Nasdaq reached a very important point on the chart
yesterday morning.
In a situation where there is no particular movement due to Trump's tariff policy,
it continues to flow downward.
As far as I remember, the US is a country with a lot of showmanship.
I've experienced it a lot while analyzing charts.
There are two indicators released today,
The Bollinger Band monthly central line touches on the chart + two indicators released,
so there is a very high possibility that Nasdaq will go up.
In the end, it's an action and a play on words to pick up and put down the ants,
and it won't be operated to the point where the US is destroyed.
Since there is a stop loss, we proceeded very aggressively.
As you can see, in the indicator announcement time zone,
the blue finger is short->long
or the red finger is long.
The rebound from the bottom is a condition for a sweep when looking at the chart upside down, so if successful, a surge can occur.
I just applied it to Bitcoin.
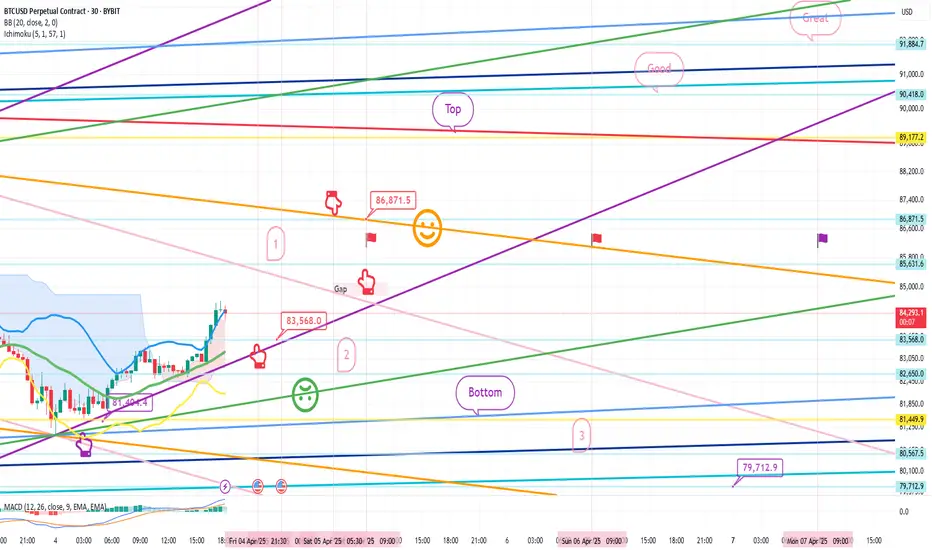
This is a 30-minute Bitcoin chart.
I marked the daily closing section for each flag,
and the purple flag on the far right is next Monday.
The purple finger on the lower left
is connected to the 81,404.4 dollar entry point yesterday, April 3.
Because it is touching the center line of the Bollinger Band 12-hour chart,
you need to hold on until 9 o'clock when additional candles are created to go up more.
*One-way long position strategy when the red finger moves
1. 83,568 dollar long position entry point / stop loss price when the green support line is broken
2. 86,871.5 dollar long position 1st target -> Top 2nd target
After that, target price in order.
If the strategy is successful, the 1st section that returns
You can use the long position re-entry section
The movement within the 1st section at the top and the 2nd section at the bottom is a sideways market.
If there is a crash in Nasdaq
It can drop below the bottom
And it can drop to 79.7K 3 times over the weekend, so please take note.
Up to this point, my analysis
Please just refer to and use it
I hope you operate safely with principle trading and stop loss prices.
You worked hard this week too.
Thank you.
March 26 Bitcoin Bybit chart analysisHello
It's a Bitcoinguide.
If you have a "follower"
You can receive comment notifications on real-time travel routes and major sections.
If my analysis is helpful,
Please would like one booster button at the bottom.
This is a 30-minute Bitcoin chart.
There is no Nasdaq indicator announcement today.
With the purple finger on the left,
I connected the long->short switching section in the existing strategy.
4-hour chart MACD dead cross imprint released.
The short-term pattern is broken and Nasdaq is moving sideways.
*Long position strategy when the red finger moves.
1. 87,141.5 dollars long position entry section / cut-off price when the green support line is broken
2. 89,177.2 dollars long position 1st target -> Top 2nd target
For those who are maintaining a short position,
Check if it breaks through the pink resistance line
The 1st section at the top and the 2nd section at the bottom are sideways sections. In particular, the first section at the top is the resistance line section of the Bollinger Band daily chart, and since it is pressed, adjustments can occur when touched.
Therefore, even if a rebound occurs at the red finger 87.1K,
if the daily candle is created tomorrow,
it should touch the first section 89.1K at the top to open the resistance line,
so that it can safely rise to the top section, right?
Since the mid-term pattern is broken from the green support line deviation,
it must unconditionally succeed in the rebound,
and it would be good to operate while watching the Nasdaq movement.
Up to this point, I ask that you simply refer to and use my analysis,
and I hope that you operate safely with principle trading and stop loss prices.
Thank you.

BTC once Again It is still bullish. we may see a pullback to 86, but in general, it is above a good support area
just an idea

March 24 Bitcoin Bybit chart analysisHello
It's a Bitcoinguide.
If you have a "follower"
You can receive comment notifications on real-time travel routes and major sections.
If my analysis is helpful,
Please would like one booster button at the bottom.
This is the Nasdaq 30-minute chart.
There is an indicator announcement at 10:35,
The Bollinger Band 12-hour chart is touching the resistance line,
But it has not reached the center line of the daily chart.
A gap section is created at the bottom.
The blue finger is a short->long switching strategy,
And I just applied it to Bitcoin.
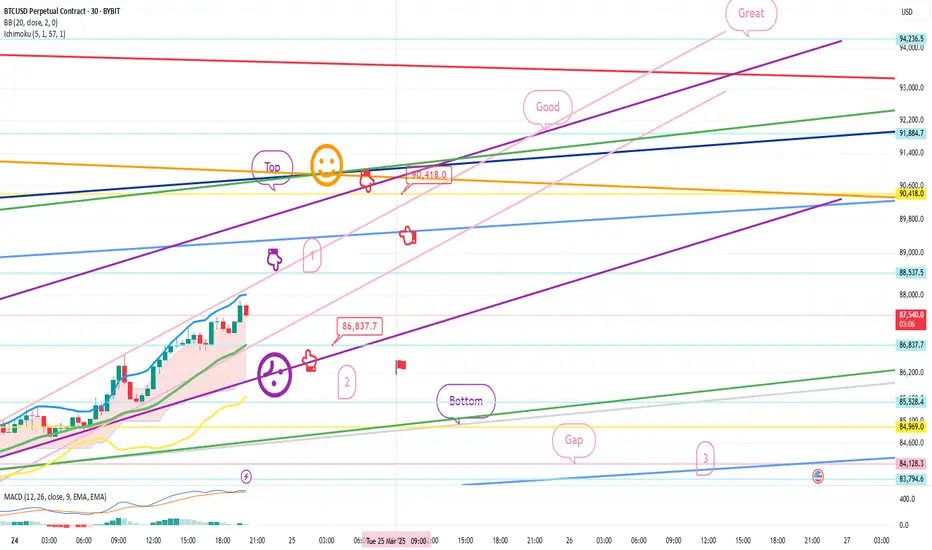
Bitcoin 30-minute chart.
*Red finger movement path
Long position strategy
1. $86,837.7 long position entry section / stop loss price when purple support line is broken
2. $90,418 long position 1st target -> Good 2nd target
The 1st section at the top
is the rising wave section for today's strategy to succeed
(Section for utilizing autonomous short section)
From the 1st section touch
The probability of the strategy succeeding increases.
Refer to Nasdaq movement.
The 2nd section at the bottom seems to be around 1+4 sections
The mid-term pattern is broken from the bottom touch.
After that, the possibility of the bottom gap reversal increases, so please note
Today, since it's been a while, I'll leave it as public
and go in.
Up to this point, I ask that you use my analysis as a reference only
I hope that you operate safely with principle trading and stop loss prices.
Thank you.
March 19 Bitcoin Bybit chart analysis
Hello
It's a Bitcoinguide.
If you have a "follower"
You can receive comment notifications on real-time travel routes and major sections.
If my analysis is helpful,
Please would like one booster button at the bottom.
Here is the Bitcoin 30-minute chart.
There will be a Nasdaq index announcement (FOMC interest rate announcement) at 3 AM soon.
I created today's strategy based on Nasdaq.
*When the red finger moves,
One-way long position strategy
1. 83,451.4 dollars long position entry point / green support line breakaway stop loss price
2. 85,233.8 dollars long position 1st target and after autonomous short -> Top autonomous long
-> Good to up to 94,179.7 dollars long position final target price
(You can check the price if you drag the chart.)
The purple finger section at the top
is the place where you should touch first to have a high chance of success in the strategy. This is a section for autonomous shorts and rising waves,
(If it comes down right away, the safe section in the short-term rising trend is number 2)
If it breaks the 3rd sky blue support line at the bottom,
the rising trend line may break,
and since the previous low is broken from the bottom,
you should open it up to $79,712.8 by the weekend.
(Major rebound section)
Please use my analysis articles for reference only,
and I hope you operate safely with principle trading and stop loss prices.
I will see you next Monday due to personal reasons.
Thank you.

BTC Idea Bitcoin is in an ascending channel now, so the best entry point will be 84 and 83... so we can cover the slight pullback

March 14 Bitcoin Bybit chart analysisHello
It's a Bitcoinguide.
If you have a "follower"
You can receive comment notifications on real-time travel routes and major sections.
If my analysis is helpful,
Please would like one booster button at the bottom.
This is the Bitcoin 30-minute chart.
There is no Nasdaq indicator announcement
It is not visible on the chart screen,
but in the analysis article on March 11,
I connected today's strategy while maintaining a long position of $79,188 at the long position entry point.
Also, there was a recent booster manipulation and the participation rate was low,
so I kept the analysis article private for the past few days,
but how was the difference compared to other analysis articles?
I wonder if you felt the gap in my analysis article.
It was not a mistake to make the analysis article public today,
but I think it would be good to see it as a small gesture of goodwill because new people supported me yesterday and today.
It is currently moving sideways after a slight upward touch,
and compared to Tether dominance, I created an aggressive strategy. The important part today is that NASDAQ only needs to move sideways
If it crashes or breaks the previous low
Be careful because Bitcoin will definitely follow
I'll summarize it very simply and briefly.
*When the red finger moves
Long position strategy
1. 82407.5 dollars long position entry section / cut-off price when the green support line breaks
(It can be pushed up to section 2 at most.)
2. 84965.5 dollars long position 1st target -> Top 2nd target
Currently, the top section is roughly the center line of the Bollinger Band daily chart.
Rather than touching this section and switching short positions
It would be better to try to re-enter after long liquidation. (The mid-term pattern is broken based on Tether Dominance)
Today, the second sky blue support line
is a safe zone where the upward rebound can be maintained
From the bottom section deviation, the next support line
is the previous low point section marked below, 77,611 dollars.
Up to this point, please use my analysis as a reference only
I hope you operate safely with principle trading and stop loss prices.
Thank you for your hard work this week.

TON Spot Idea TON looks in a good zone and may break the downtrend at any moment, a slight pullback to 2.85 may occur however it still looks bullish..
Keep in mind that the market is very boring on weekends.

March 11 Bitcoin Bybit chart analysisHello
It's a Bitcoinguide.
If you have a "follower"
You can receive comment notifications on real-time travel routes and major sections.
If my analysis is helpful,
Please would like one booster button at the bottom.
This is the Bitcoin 30-minute chart.
There will be a Nasdaq indicator announcement at 11 o'clock shortly.
As long as the Nasdaq doesn't crash,
it will continue to crash + forced coupling,
so it is not easy to analyze.
In this case, it is recommended to operate with a tight stop loss,
and since Bitcoin broke its previous low with yesterday's movement,
I created a strategy based on the major rebound section of 75,459.5 dollars at the bottom this week.
*When the blue finger moves,
it is a two-way neutral long->short switching strategy
The section from 1 to 83,529 dollars at the top is an autonomous short section.
You can operate based on the center line of the 4-hour chart that will be additionally created at 9 o'clock shortly.
For example, if a rebound is connected before 9 o'clock, it is the purple finger.
If a rebound occurs after 9 o'clock, it is the 1st section.
If it comes down immediately without touching, it is good to operate the long position waiting until the 2nd section at the bottom.
1. 80365 dollar long position entry section / stop loss price when the purple support line is broken
(If it comes down immediately without touching the short position entry section at the top, 83529 dollar long position 1st target -> short position autonomous section)
2. 84965 dollar long position target price -> 83529 dollar autonomous long position operation section
(Since it is the center line of the 6-hour chart, if it reaches this section, it is highly likely to continue to rise.)
After that, the target price is in the order of Gap9 -> Good -> Great,
but short position switching is done from the touch of the center line of the daily chart.
If it comes down right from the current position,
2 -> Look at Bottom
From Gap7, the previous low is broken again
It is good to operate it as a major rebound section up to $75,459.5 this week.
More than anything else, Nasdaq is the problem.
Since Bitcoin has a fast turnover rate
As long as Nasdaq doesn't crash/crash/crash, it's fine.
Please use my analysis up to this point as a reference only
I hope you operate safely with principle trading and stop loss prices.
Thank you.

March 10 Bitcoin Bybit chart analysisHello
It's a Bitcoinguide.
If you have a "follower"
You can receive comment notifications on real-time travel routes and major sections.
If my analysis is helpful,
Please would like one booster button at the bottom.
This is the Bitcoin 30-minute chart.
There is no Nasdaq indicator announcement today.
The trend has been brought forward by one hour due to the application of US Daylight Savings Time.
If only the Nasdaq low is not broken and
It moves sideways, there will be no crash in Bitcoin.
I created today's strategy based on the Gap9 section retracement at the top.
*When the blue finger moves,
It is a two-way neutral strategy.
1. 81826.5 dollars long position entry section / stop loss price when the blue support line is broken
2. 86234 dollars long position target price
After that, from section 1 -> 87428.5 dollars -> Great
As indicated, it would be good to use short->long switching.
Up to this section, it seems more advantageous to liquidate long and then re-enter long than short. (Tether Dominance 4+6+12 MACD Dead Cross Possibility)
The center line of the Bollinger Band daily chart
is the final short position switching point.
(Approximately $90,418)
If the Bottom section is broken today according to the movement of Nasdaq,
Bit will also break the previous low point
and it may fall strongly to 3 -> Gap7.
For those who can check the drawing section,
I have marked today's major rebound section near Gap7, so please refer to it.
Up to this point, please use my analysis as a reference only
Please operate safely with principle trading and stop loss price.
Thank you.

March 7 Bitcoin Bybit chart analysisHello
It's a Bitcoinguide.
If you have a "follower"
You can receive comment notifications on real-time travel routes and major sections.
If my analysis is helpful,
Please would like one booster button at the bottom.
Bitcoin 30-minute chart.
There will be a Nasdaq index announcement at 10:30 in a little while,
6-hour chart MACD dead cross is in progress.
*Red finger movement path
Long position strategy
1. 88,624 dollars long position entry section / cut-off price when purple support line is broken
2. 1st section at the top 1st target -> Top 2nd -> Target in order during the weekend
1st section at the top pink resistance line / green support line sideways to 3rd section
There is a possibility of additional decline from bottom breakout
Please check 4th section at the bottom -> 80,118.5 dollars
Thank you.
March 6 Bitcoin Bybit chart analysisHello
It's a Bitcoinguide.
If you have a "follower"
You can receive comment notifications on real-time travel routes and major sections.
If my analysis is helpful,
Please would like one booster button at the bottom.
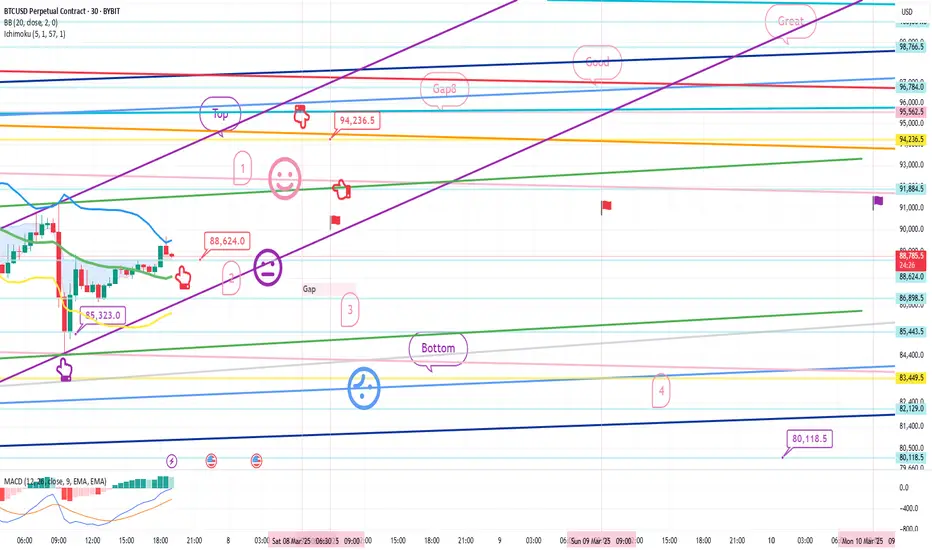
This is the Bitcoin 30-minute chart.
There will be a Nasdaq index announcement at 10:30 in a little while.
At the bottom left is the long position entry point on March 5th.
The purple finger is connected to $88,407.
*Red finger movement path
One-way long position strategy
First wave check in section 1 at the top
1. Long position entry section of $90,698 / Stop loss price when purple support line is broken
2. Long position 1st target of $94,236.5 -> Gap8 2nd target
(Today's 4-hour chart, 12-hour chart resistance line section is $94,236.5
Since we don't know how much the adjustment will come out, it's okay to use a short position.)
3. After long profit cut, section 1, $91,884.5 long position utilization section
After that, long position target price in order of Top -> Good section.
Section 1 at the top
If there is an adjustment after the touch, a short->long movement will occur in NASDAQ
and it is more advantageous to wait for a long than a short,
and Section 2 at the bottom is a safe long position entry section where a short-term pattern is maintained.
From Section 3, there may be an additional decline,
so it would be good to check Bottom -> $83449.5 as indicated.
My waist and shoulders are not so good
I will enter early here today
Please use my analysis article as a reference only
Don't forget the 6 principles of trading and the essential stop loss price
and operate safely
Thank you.

March 5 Bitcoin Bybit chart analysisHello
It's a Bitcoinguide.
If you have a "follower"
You can receive comment notifications on real-time travel routes and major sections.
If my analysis is helpful,
Please would like one booster button at the bottom.
This is the Bitcoin 30-minute chart.
There is an indicator announcement at 12 o'clock on Nasdaq.
Yesterday, based on Tether Dominance, the 4-hour chart was maintaining a thin line above the center line,
so it is rebounding strongly as expected, coupled with the Nasdaq rebound.
It is very difficult to make an entry point again today.
Yesterday, Nasdaq touched the Bollinger Band weekly chart support line, so I judged this week to be a major rebound section.
(It is good that the support line is supporting it.)
At least, Bitcoin followed the trend according to the possibility of a sideways movement without a plunge.
*Red finger movement path
Long position strategy
1. $88,407 long position entry section / cut-off price when purple support line is broken
2. $96,005 1st target -> Top section 2nd target
After liquidation, bottom section 1 long position re-entry section / cut-off price autonomous
Today's long position entry section is
30-minute support + 1-hour central pattern that returns.
(Today's first wave)
I explained most of the key points of the strategy yesterday.
The reason I focused on the long position today is
The daily chart MACD golden cross is in progress,
*In the case of Tether dominance, it is a daily central line + 12-hour chart support line pattern,
but since the mid-term pattern is broken and the daily chart central line is the second touch, I thought it was highly likely to be pushed by force.
Section 1 at the top and section 2 at the bottom are sideways.
Because the downward direction is open from the bottom section,
it can flow up to section 3.
Up to this point, I ask that you simply use my analysis for reference and use only,
and I hope that you operate safely with principle trading and stop loss prices.
Thank you.

March 4 Bitcoin Bybit chart analysisHello
It's a Bitcoinguide.
If you have a "follower"
You can receive comment notifications on real-time travel routes and major sections.
If my analysis is helpful,
Please would like one booster button at the bottom.
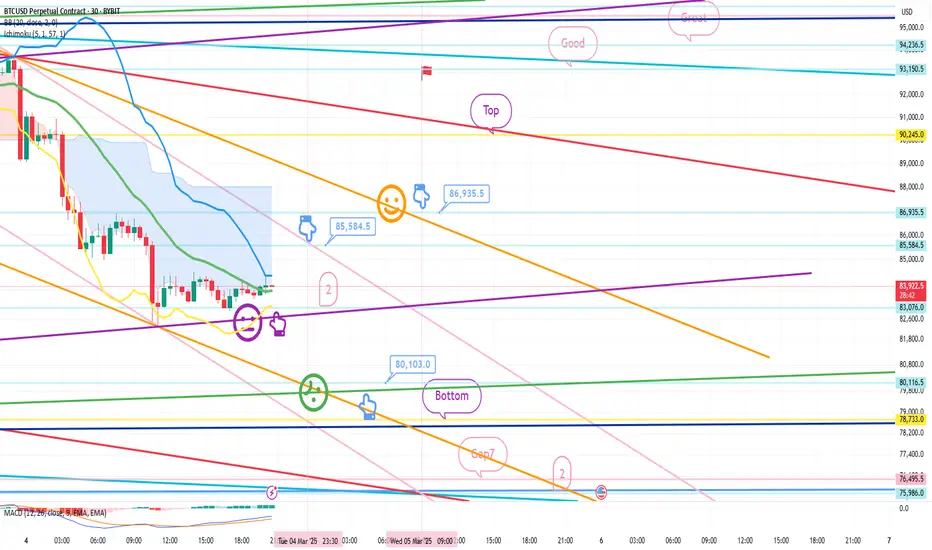
This is the Bitcoin 30-minute chart.
There is no Nasdaq indicator announcement.
In the analysis I left today,
I would be grateful if it moves sideways without breaking the green support line.
Today's two main points of view are
Whether the 12-hour chart MACD dead cross is in progress
and
The Tether Dominance 4-hour chart center line is above
The thin section of the cloud (possibility of a crash).
I thought it would be complicated if I explained it in both directions,
so I approached it very simply.
It is an ambiguous position before the decline in Tether Dominance (tail section when taking a short position in a plunge)
Bitcoin also touched the support line of the 2-hour Bollinger Band chart today
(additional downtrend or sideways section)
Since there was no short position entry position today,
we proceeded with the final sweep (plunge) of Tether Dominance in line with the 12-hour chart MACD dead cross imprint from 9 PM to 9 AM when the 12-hour candle is created.
If you don't understand, please read it repeatedly.
*When the blue finger moves,
it is a short position strategy
short->long switching strategy.
1. $85,584.5 short position entry section / stop loss price when breaking through the pink resistance line
(The pink resistance line section is the center line of the 4-hour Bollinger Band chart based on Tether Dominance,
but since it is the order of the 4-hour chart MACD dead cross and the positive cloud is maintaining thin,
you should be careful because it can rise strongly when breaking through this section.)
2. $80,103 long position switching section / stop loss price when breaking through the blue support line
(A strong rebound before and after breaking through the blue support line is sweeping through Tether Dominance -> a crash condition.)
3. $86,935.5 long position 1st target
-> After the 12-hour chart MACD dead cross is imprinted, the 2nd target price is the top section
Currently, in Tether Dominance, the 6+12 pattern has touched the daily center line, so the mid-term pattern It's broken.
From reaching the top section, continue to maintain a long position
If the condition is Tether Dominance
Based on the recovery of the 12+ daily pattern
You can see the resistance line of the Bollinger Band 12-hour chart -> near the daily central line.
(Here, take profit and final short switching depending on the situation)
If there is no rebound in the bottom section today
You should look at the 2nd section from Gap7 at the bottom
And if it continues to fall, this week's major rebound section
I will organize it again later.
Please use my analysis article for reference and use only
I hope you operate safely with principle trading and stop loss prices.
Thank you.

AnalysisAnalysis 🚨
NASDAQ:AVL is testing the red resistance zone 🔴. If the breakout is successful, the first target will be the green line level 🟩.
🎯 Target:
🔵 1️⃣ First Target: Green line level

Cup and Handle pattern!Analysis 🚨
NYSE:VET is forming a Cup and Handle pattern! ☕ If it breaks out of the red resistance zone 🔴, the next targets will be:
🎯 First Target: Green line level 🟩
🎯 Second Target: Blue line level 🔵
