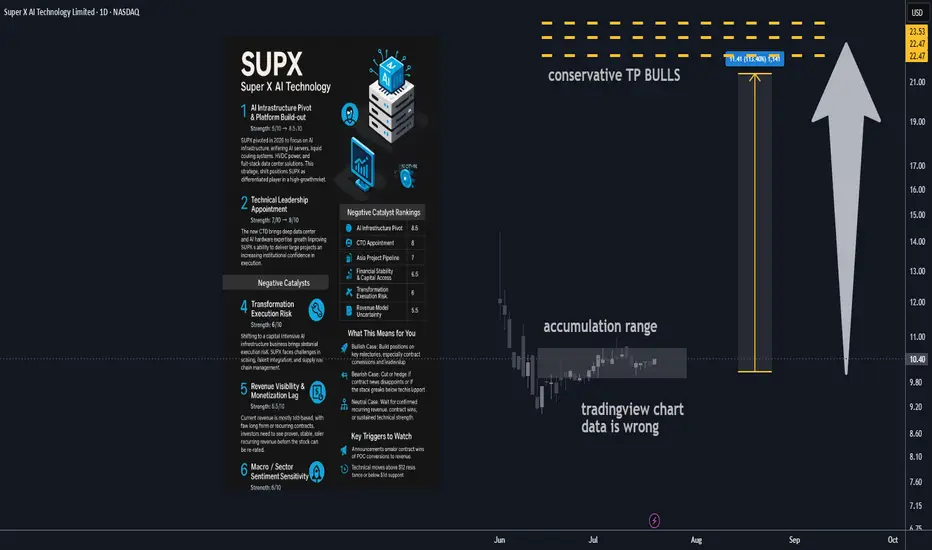
Super X AI Technology Ltd AI Infrastructure Stock 100% upside🔋 1. AI Infrastructure Pivot & Platform Build-out
Strength: 8/10 → 8.5/10
SUPX has made a major pivot in 2025, transitioning from a legacy business into next-gen AI infrastructure. The new focus includes AI servers, liquid cooling systems, HVDC power, and full-stack data center offerings targeting the rapidly growing demand for AI compute in Asia. This shift positions SUPX as a differentiated player in a high-growth market, opening doors to larger contract values and broader verticals.
________________________________________
🤖 2. Technical Leadership Appointment
Strength: 7/10 → 8/10
A major recent step forward is the hiring of a seasoned CTO with deep data center and AI hardware experience. This upgrade significantly enhances SUPX’s execution ability and credibility in enterprise infrastructure. Institutional investors and potential partners will see this as a sign SUPX can deliver on its technical roadmap and close major deals.
________________________________________
📈 3. Asia Institutional Partnerships Pipeline
Strength: 6.5/10 → 7/10
SUPX is developing a solid pipeline of institutional AI infrastructure projects across Asia, especially with established banks and tech companies. While many projects are still in proof-of-concept or pilot stages, these early relationships can drive high-margin, recurring business if successfully converted to long-term contracts.
________________________________________
💰 4. Capital Structure & Financial Health
Strength: 6/10 → 6.5/10
The company’s cash position has improved after new equity raises, giving SUPX a runway for continued R&D and expansion. While the business is still operating at a loss and share dilution remains a factor, debt levels are manageable and financial flexibility should support continued transformation and growth.
________________________________________
________________________________________
⚠️ Negative Catalysts
🛠️ 5. Transformation Execution Risk
Strength: 6/10 → 6/10
Transitioning from a legacy model to a complex, capital-intensive AI infrastructure business brings substantial execution risk. SUPX must navigate operational scale-up, talent integration, and supply chain challenges, with no guarantee of seamless delivery. Any delays or setbacks could erode investor confidence.
________________________________________
🌐 6. Revenue Visibility & Monetization Lag
Strength: 5.5/10 → 5.5/10
Most current revenue is still pilot-based, with few long-term or recurring contracts secured. The business model relies on successful conversion of its pipeline and faster ramp-up in recognized sales. Investors will need to see evidence of stable, recurring revenue before the stock is re-rated.
________________________________________
🔁 7. Macro / Sector Sentiment Sensitivity
Strength: 5/10 → 5/10
As a small-cap AI/infra play, SUPX is highly exposed to swings in broader market sentiment. Any downturn in tech or risk-off moves in global markets could lead to outsized stock volatility, regardless of execution progress.
________________________________________
________________________________________
🚀 Refreshed Catalyst Rankings
Rank Driver Score
1 AI Infrastructure Pivot 8.5
2 CTO Appointment (Execution) 8
3 Asia Project Pipeline 7
4 Financial Stability & Capital Access 6.5
5 Transformation Execution Risk 6
6 Revenue Model Uncertainty 5.5
7 Macro / Sector Volatility 5
________________________________________
📊 Analyst Ratings & Price Outlook
• No major Wall Street coverage; visibility remains driven by news flow and early institutional/retail adoption.
• Technicals: The stock has established higher lows since its business model pivot. Resistance sits near $11.50–12, with support at $9.80–10.00.
• Price target: A $20 target remains plausible if SUPX delivers on growth milestones and secures new capital or contracts, representing a potential doubling from current levels.
________________________________________
🗞️ Recent Developments
• Hired a proven CTO to drive the new AI/data center focus.
• Company rebranded and fully pivoted its business model in 2025, shifting all resources to AI infrastructure.
• Implemented a new equity incentive plan to attract and retain top tech talent.
• Announced a robust pipeline of institutional projects across Asia, although most are not yet recognized as revenue.
________________________________________
🔍 Summary Outlook
SUPX is an emerging transformation play, now fully aligned with surging demand for AI infrastructure. Its success depends on management’s ability to scale, close institutional contracts, and prove out recurring revenue. While the story is compelling and early traction is positive, the company remains high-risk and execution-dependent at this stage.
Bull Case:
If SUPX converts pilots into revenue, delivers operationally, and continues to attract top talent, the stock could re-rate to the $15–20+ range as its business model is validated.
Bear Case:
Stumbles in execution, monetization, or funding could send the stock back to $7–8 support.
Neutral:
Many investors may choose to wait for confirmation of contract wins, recurring revenue, or sustained technical strength before committing.
Technical Levels to Watch:
• Bullish breakout if it clears and holds $11.50–12.00.
• Bearish risk if it fails to hold $9.80–10.00, with possible drop toward $8.
________________________________________
✅ What This Means for You
• Bullish: Build positions into execution milestones, focusing on contract conversions and leadership updates. Upside potential to $20 if catalysts align.
• Bearish: Cut or hedge exposure on failed contract news or technical breakdown.
• Neutral: Stay on the sidelines until more evidence of recurring revenue, confirmed contract wins, or positive sector momentum.
MGK
Vanguard Mega Cap Growth ETF (MGK): FAQ guide before investing🚀 Vanguard Mega Cap Growth ETF (MGK): A Deep Dive into Holdings and Hypothetical Returns
🌟 The Vanguard Mega Cap Growth ETF (MGK) is a popular exchange-traded fund offering investors access to some of the largest and most dynamic growth-oriented companies in the U.S. market. MGK closely tracks the CRSP US Mega Cap Growth Index, emphasizing mega-cap stocks.
🎯 Key Features of MGK
💰 Expense Ratio: 0.07%, a cost-effective choice for investors.
📊 Assets Under Management: Around $25.42 billion.
💵 Dividend Yield: 0.44%, distributed quarterly.
🏆 Top Holdings:
🍎 Apple Inc. (AAPL): 14.34%
🖥️ Microsoft Corp. (MSFT): 11.93%
🎮 NVIDIA Corp. (NVDA): 10.70%
📦 Amazon.com Inc. (AMZN): 7.63%
📱 Meta Platforms Inc. (META): 4.33%
🔌 Broadcom Inc. (AVGO): 3.54%
🚗 Tesla Inc. (TSLA): 3.22%
💊 Eli Lilly and Co. (LLY): 3.20%
💳 Visa Inc. (V): 2.76%
🔍 Alphabet Inc. (GOOGL): 2.31%
📌 Sector Allocation:
💻 Technology: ~52.8%
🛒 Consumer Discretionary: 15.9%
📡 Communication Services: 11.0%
📈 Performance Overview
MGK has consistently demonstrated strong returns:
🗓️ Year-to-Date (YTD): 0.96%
📅 1-Year Return: ~21.09%
📆 3-Year Return: ~23.26%
📊 5-Year Return: ~19.26%
💸 Hypothetical Investment Scenarios
Assuming an average annual return of 19.26%, here's how various investments might grow over five years:
💲 $10,000 Investment:
Year 1: $11,926
Year 2: $14,219
Year 3: $16,951
Year 4: $20,207
Year 5: $24,070
💲 $100,000 Investment:
Year 1: $119,260
Year 2: $142,190
Year 3: $169,510
Year 4: $202,070
Year 5: $240,700
💲 $1,000,000 Investment:
Year 1: $1,192,600
Year 2: $1,421,900
Year 3: $1,695,100
Year 4: $2,020,700
Year 5: $2,407,000
⚠️ Note: These returns are hypothetical and assume consistent annual performance, which may not reflect actual market volatility.
🔑 Considerations for Investors
🎯 Concentration Risk: MGK heavily invests in technology and a few major stocks, tying its success closely to these specific companies.
📉 Market Volatility: Although historically strong, MGK can be highly volatile, particularly during tech-sector downturns.
📈 Long-Term Growth: Ideal for investors seeking significant long-term capital appreciation through prominent U.S. growth firms.
📌 In Summary: MGK provides focused exposure to U.S. mega-cap growth stocks with a strong track record. Investors should consider portfolio diversification carefully due to its sector concentration.

Can Mega Cap Growth Make A Comeback?One of the most important, yet consistently underappreciated, aspects of technical analysis is the concept of relative strength.
As a portfolio manager, one must be held accountable to some type of benchmark. And thus, if we want to outperform said benchmark, we most own things that are outperforming the benchmark! Participating in trends and capturing profitable trades is the goal that every trader and investor envisions when they enter a position. And of course, this is what indeed what we want in the end...profits. But those profits need to be greater than your benchmark, or else, what is the point?
This is a concept that we at Adaptiv are constantly applying across any stock (or asset) when considering it for a position for clients. We are always looking to be involved in the strongest areas of the market. If we know that major indices, for all intents and purposes, are just the average return of a basket of stocks, then we also know that some stocks must be doing better than the average and some must be doing worse. It seems like common sense to participate in the stocks and trends that are indeed stronger than the average stock, or in our case, the benchmark. Sometimes the rotation between leading areas happens slowly as strength can stay within certain sectors and sub-industries for many months or even years. In other environments, the rotation can be quick and less-sticky, much like we saw in 2021. While we as market participants do not get to choose the pace of rotation, it is still a practice that must be constantly applied, in order to consistently create alpha.
One area that is very important to the broad market is the Growth/Tech theme, and more specifically the largest capitalized stocks within that area. We know that these stocks have a very large influence on the market as a whole. When they are leading, the market usually finds itself in an easier uptrend, like we saw more recently in 2017, the first half of 2018, and 2020, following the 'Covid lows'.
The relative relationship between these mega cap stocks and the S&P 500, as mentioned above, has been trendless for nearly two years. And over the last twelve-plus months, I think it's fair to say the 'average' stock has been quite a mess. And the lack of trending leadership from these important stocks certainly hasn't helped. But could a turn around be under way? We recently saw a failed breakdown (black line) in this relationship, following a well-anticipated bullish RSI divergence (not pictured). As any well-studied technician knows, the old adage "from failed moves come fast moves" can be a very important one. Given this new information, we should not be surprised if Mega Cap Growth stocks substantially outperforming in the coming weeks,
What about the most important names within this area? What stocks could we look at for clues as to where the broader relationship could potentially go? I think Apple gives a great insight as to what other large Growth names could do on a relative basis over the short- to intermediate-term. And it just so happens that the relationship between Apple and the S&P 500 is currently sitting at a very important inflection point. Should this ratio break higher (above the purple line), I think it bodes well for Apple's peer group as well.
Lastly, we know that a big chunk of the Mega Cap Growth arena consists of Tech stocks. Almost 40% to be exact. So, we would also want to look at this sector as well for any information that this theme, and thus stocks similar to Apple, are indeed moving into a period of outperformance. Similar to the first two relationships, this one has also been range bound for many, many months. However, broad Tech seems to have a little bit more short-term resistance than Mega Cap Growth. In order to increase the confidence of alpha generation from this area, I think technicians want to see this relationship rise above the blue line.
If we can get all three of these relationship to confirm new relative uptrends in the coming weeks/months, I think that bodes very well not just for this subset of names, but the market as a whole.
Ian McMillan, CMT
Adaptiv
Shared content and posted charts are intended to be used for informational and educational purposes only. The CMT Association does not offer, and this information shall not be understood or construed as, financial advice or investment recommendations. The information provided is not a substitute for advice from an investment professional. The CMT Association does not accept liability for any financial loss or damage our audience may incur.

$MGK Pullback Buyers Hunting For The Entry$MGK has had a great run higher doubling in value from the lows. This move higher did get quite overextended creating an overshoot on the highs. When a market blows through a level (in this case the channel highs) and overshoots it, the response is very important. In this case, the response was immediate bear pressure which caused the bulls to fail hard. Now that we have seen the overshot high failure, it is expected to see an overshot on the lows too to equalize. Buyers are lying in wait for the best dip opportunity to jump back in this monster.

Low Cost ETFs That Beat The Market Low cost ETF's that beat the market:
(Note these lean Growth, Tech, & Large-Cap Heavy)
Add slow and steady now; Add heavy when we retest the black trend-line
-------------------------------------------------------------------------------------
Ticker: SPYG
Name: SPDR Portfolio S&P500 Growth ETF
Last Close: 44.85
Net Assets ($M): 7596
Expense Ratio: 0.04%
Dividend Yield: 1.3%
5-Yr Average Dividend Yield Growth: 10.5%
YTD Returns Vs S&P500: 10.6%
2-yr Annualized Returns Vs S&P500: 5.2%
3-yr Annualized Returns Vs S&P500: 5.7%
5-yr Annualized Returns Vs S&P500: 3.8%
-------------------------------------------------------------------------------------
Ticker: FDIS
Name: Fidelity MSCI Consumer Discretionary Index ETF
Last Close: 51.71
Net Assets ($M): 688
Expense Ratio: 0.08%
Dividend Yield: 1.2%
5-Yr Average Dividend Yield Growth: 13.8%
YTD Returns Vs S&P500: 10.5%
2-yr Annualized Returns Vs S&P500: 1.9%
3-yr Annualized Returns Vs S&P500: 3.9%
5-yr Annualized Returns Vs S&P500: 1.7%
-------------------------------------------------------------------------------------
Ticker: FTEC
Name: Fidelity MSCI Information Technology Index ETF
Last Close: 81.06
Net Assets ($M): 3745
Expense Ratio: 0.08%
Dividend Yield: 1.4%
5-Yr Average Dividend Yield Growth: 23.0%
YTD Returns Vs S&P500: 15.0%
2-yr Annualized Returns Vs S&P500: 12.0%
3-yr Annualized Returns Vs S&P500: 14.1%
5-yr Annualized Returns Vs S&P500: 10.7%
-------------------------------------------------------------------------------------
Ticker: SCHG
Name: Schwab U.S. Large-Cap Growth ETF
Last Close: 101.1
Net Assets ($M): 9831
Expense Ratio: 0.04%
Dividend Yield: 0.7%
5-Yr Average Dividend Yield Growth: 5.2%
YTD Returns Vs S&P500: 12.1%
2-yr Annualized Returns Vs S&P500: 7.3%
3-yr Annualized Returns Vs S&P500: 7.5%
5-yr Annualized Returns Vs S&P500: 4.0%
-------------------------------------------------------------------------------------
Ticker: MGK
Name: Vanguard Mega Cap Growth Index Fund ETF Shares
Last Close: 162.36
Net Assets ($M): 7347
Expense Ratio: 0.07
Dividend Yield: 0.9%
5-Yr Average Dividend Yield Growth: 5.2%
YTD Returns Vs S&P500: 14.8%
2-yr Annualized Returns Vs S&P500: 8.6%
3-yr Annualized Returns Vs S&P500: 7.9%
5-yr Annualized Returns Vs S&P500: 5.0%
-------------------------------------------------------------------------------------
Ticker: VOOG
Name: Vanguard S&P500 Growth Index Fund ETF Shares
Last Close: 186.68
Net Assets ($M): 3565
Expense Ratio: 0.10%
Dividend Yield: 1.2%
5-Yr Average Dividend Yield Growth: 1.5%
YTD Returns Vs S&P500: 10.5%
2-yr Annualized Returns Vs S&P500: 5.1%
3-yr Annualized Returns Vs S&P500: 5.7%
5-yr Annualized Returns Vs S&P500: 3.6%
-------------------------------------------------------------------------------------
Ticker: VONG
Name: Vanguard Russell 1000 Growth Index Fund ETF Shares
Last Close: 196.53
Net Assets ($M): 7002
Expense Ratio: 0.08%
Dividend Yield: 1.0%
5-Yr Average Dividend Yield Growth: 7.3%
YTD Returns Vs S&P500: 12.2%
2-yr Annualized Returns Vs S&P500: 7.4%
3-yr Annualized Returns Vs S&P500: 7.9%
5-yr Annualized Returns Vs S&P500: 4.9%
-------------------------------------------------------------------------------------
Ticker: EDV
Name: Vanguard Extended Duration Treasury Index Fund ETF Shares
Last Close: 163.82
Net Assets ($M): 3286
Expense Ratio: 0.07%
Dividend Yield: 2.1%
5-Yr Average Dividend Yield Growth: 2.3%
YTD Returns Vs S&P500: 30.8%
2-yr Annualized Returns Vs S&P500: 16.5%
3-yr Annualized Returns Vs S&P500: 4.2%
5-yr Annualized Returns Vs S&P500: 2.1%
-------------------------------------------------------------------------------------
