Bearish breakdown for MSFT on the Fibonacci Bollinger BandThe monthly chart for Microsoft (MSFT) shows a breakdown below the upper band (red line) of the Fibonacci Bollinger Bands (FBB) indicator. While it is likely that MSFT will bounce for the time being, as inflation worries cool and tech stocks attempt a rally, the upper band will likely act as resistance. If the price rebounds it might be hard to sustain a breakout above $300. While I like MSFT as much as anyone else, the charts do not lie. The chart is showing that there is a long-term mean reversion occurring in the price of MSFT. The white line is the standard deviation basis for the monthly chart which reflects the downside potential. It's quite steep and the yearly oscillators are saying MSFT is primed to correct down to this level. All of this will unfold slowly (months to years) and fakeouts might trap some bulls. Is your MSFT position prepared for a worst-case scenario reversion to the mean? Trade wisely.
Not financial advice.
Microsoft

VMW: Merger Arbitrage !?VMware
Intraday - We look to Buy at 110.32 (stop at 100.60)
This stock has recently been in the news headlines. Broadcom agreed to buy the company for $61B USD. Trading volume is increasing. We look for a temporary move lower. Bespoke support is located at 110.00. Dip buying offers good risk/reward.
Our profit targets will be 139.88 and 150.00
Resistance: 140.00 / 150.00 / 167.00
Support: 110.00 / 92.50 / 85.50
Please be advised that the information presented on TradingView is provided to Vantage (‘Vantage Global Limited’, ‘we’) by a third-party provider (‘Signal Centre’). Please be reminded that you are solely responsible for the trading decisions on your account. There is a very high degree of risk involved in trading. Any information and/or content is intended entirely for research, educational and informational purposes only and does not constitute investment or consultation advice or investment strategy. The information is not tailored to the investment needs of any specific person and therefore does not involve a consideration of any of the investment objectives, financial situation or needs of any viewer that may receive it. Kindly also note that past performance is not a reliable indicator of future results. Actual results may differ materially from those anticipated in forward-looking or past performance statements. We assume no liability as to the accuracy or completeness of any of the information and/or content provided herein and the Company cannot be held responsible for any omission, mistake nor for any loss or damage including without limitation to any loss of profit which may arise from reliance on any information supplied by Signal Centre.

Daily US Stocks Volatility 26 May 22 APPL, TSLA, MSFT, AMAZApple 26 May 2022
The current volatility is expected with close to 85% chance to be below 3.96%
In this case, our channel for today is going to be
TOP 146
BOT 135
--------------------------------------------------------------------------------------------------------------------
Microsoft 26 May 2022
The current volatility is expected with close to 85% chance to be below 3.96%
In this case, our channel for today is going to be
TOP 272
BOT 253
--------------------------------------------------------------------------------------------------------------------
TESLA 26 May 2022
The current volatility is expected with close to 85% chance to be below 3.96%
In this case, our channel for today is going to be
TOP 716
BOT 602
--------------------------------------------------------------------------------------------------------------------
AMAZON 26 May 2022
The current volatility is expected with close to 85% chance to be below 3.96%
In this case, our channel for today is going to be
TOP 2255
BOT 2010
--------------------------------------------------------------------------------------------------------------------

Daily US Stocks Volatility Forecast 23 May 22 APPL, TSLA, MSFTApple 23 May 2022
For today, based on the last 30 days, the current implied volatility is around 2.63% movement.
So with a more than 78% chance we can estimate that the current daily channel made with 138 open candle value, is going to be:
TOP 138 + 3.6 -> aprox 141.6
BOT 138 - 3.6 -> aprox 134.4
At the same time, if we want to increase our probability, we can go for a IV of 3.94%
With this we can achieve over the last 5000+ daily candles, a 90% probability.
So in this case , our daily channel is going to be compressed within
TOP 138 + 5.4 -> aprox 143.4
BOT 138 - 5.4 -> aprox 132.6
----------------------------------------------------------------------------------------------------------------------
Microsoft 23 May 2022
For today, based on the last 30 days, the current implied volatility is around 2.63% movement.
So with a more than 78% chance we can estimate that the current daily channel made with 253 open candle value, is going to be:
TOP 253 + 6.6 -> aprox 259,6
BOT 253 - 6.6 -> aprox 246,4
At the same time, if we want to increase our probability, we can go for a IV of 3.75%
With this we can achieve over the last 5000+ daily candles, a 92% probability.
So in this case , our daily channel is going to be compressed within
TOP 253 + 9.5 -> aprox 262,5
BOT 253 - 9.5 -> aprox 243,5
----------------------------------------------------------------------------------------------------------------------
TSLA 23 May 2022
For today, based on the last 30 days, the current implied volatility is around 5.44% movement.
So with a more than 78% chance we can estimate that the current daily channel made with 665 open candle value, is going to be:
TOP 665 + 36 -> aprox 701
BOT 665 - 36 -> aprox 629
At the same time, if we want to increase our probability, we can go for a IV of 5.44%
With this we can achieve over the last 5000+ daily candles, a 90% probability.
So in this case , our daily channel is going to be compressed within
TOP 665 + 55 -> aprox 720
BOT 665 - 55 -> aprox 610
----------------------------------------------------------------------------------------------------------------------
Google 23 May 2022
For today, based on the last 30 days, the current implied volatility is around 2.7% movement.
So with a more than 78% chance we can estimate that the current daily channel made with 2180 open candle value, is going to be:
TOP 2180 + 60 -> aprox 2240
BOT 2180 - 60 -> aprox 2120
At the same time, if we want to increase our probability, we can go for a IV of 3.6%
With this we can achieve over the last 4000+daily candles, a 90% probability.
So in this case , our daily channel is going to be compressed within
TOP 2180 + 80 -> aprox 2260
BOT 2180 - 80 -> aprox 2100
----------------------------------------------------------------------------------------------------------------------

Weekly Volatility Forecast 23-29 May 2022 APPL, AMAZ, MSFTAPPLE 23-29 May 2022
We can based on the last month analysis, that the current volatility is around 8%
This is translated into 11$ from the current point.
So lets imagine that APPLE is going open Monday candle around 138
With that in mind, with close to 86% probability of pointing correctly the top and bottom places we are going to have:
TOP 138 + 11 -> aprox 149
BOT 138 - 11 -> aprox 127
If we want at the same time to narrow a bit this channel, we can go for close to 76% probability.
In this case the volatility would be around 6% => 8$
TOP 138 + 8 -> aprox 146
BOT 138 - 8 -> aprox 130
--------------------------------------------------------------------------------------------------------------------
MICROSOFT 23-29 May 2022
We can based on the last month analysis, that the current volatility is around 7.4%
This is translated into 18$ from the current point.
So lets imagine that MICROSOFT is going open Monday candle around 250
With that in mind, with close to 87% probability of pointing correctly the top and bottom places we are going to have:
TOP 250 + 19 -> aprox 269
BOT 250 - 19 -> aprox 231
If we want at the same time to narrow a bit this channel, we can go for close to 78% probability.
In this case the volatility would be around 5.57% => 14$
TOP 250 + 14 -> aprox 264
BOT 250 - 14 -> aprox 236
--------------------------------------------------------------------------------------------------------------------
AMAZON 23-29 May 2022
We can based on the last month analysis, that the current volatility is around 12.25%
This is translated into 260$ from the current point.
So lets imagine that AMAZON is going open Monday candle around 2150
With that in mind, with close to 87% probability of pointing correctly the top and bottom places we are going to have:
TOP 2150 + 260 -> aprox 2410
BOT 2150 - 260 -> aprox 1890
If we want at the same time to narrow a bit this channel, we can go for close to 77% probability.
In this case the volatility would be around 9.2% => 200$
TOP 2150 + 200-> aprox 2350
BOT 2150 - 200 -> aprox 1950
--------------------------------------------------------------------------------------------------------------------

Microsoft Two Levels To Watch For Position TradingIn this uodate we review the recent price action in Microsoft and identify the next high probability trade locations for position trading opportunities

Microsoft - Long PositionThere's A Lot To Like About Microsoft's Upcoming US$0.62 Dividend. The company's next dividend payment will be US$0.62 per share, and in the last 12 months, the company paid a total of US$2.48 per share. Last year's total dividend payments show that Microsoft has a trailing yield of 0.9% on the current share price of $261.12. Dividends are an important source of income to many shareholders, but the health of the business is crucial to maintaining those dividends. That's why we should always check whether the dividend payments appear sustainable, and if the company is growing.

Microsoft Stocks will be BullishMicrosoft's Stocks is in a Descending Channel and Now the Price is at the Bottom of that Channel. The Price Will Start to Increase to the Top of the Channel Pretty Soon because the Fact that It is at the Bottom of the channel, makes it enough Reason to Increase and also we have a Regular Bullish Divergence on MACD Indicator as well Which is also another Reason for Us to Think about Bullish Stuff!
_ _ _ _ _ _ _ _ _ _ _ _ _ _ _ _ _ _ _ _ _ _ _ _ _ _ _ _ _ _ _ _ _
Thank you for seeing idea .
Have a nice day and Good luck

Trading Idea - #MicrosoftMy Trading Idea on Microsoft - Sell/Short
Target: 208.00 USD
Stop: 298.00 USD
Breakout at the lower trend channel

Microsoft crashing? Microsoft
Short Term - We look to Sell at 274.00 (stop at 287.00)
Preferred trade is to sell into rallies. Broken out of the Head and Shoulders formation to the downside. Previous support at 275.00 now becomes resistance. The trend of lower highs is located at 290.00. Expect trading to remain mixed and volatile.
Our profit targets will be 232.00 and 221.00
Resistance: 275.00 / 300.00 / 320.00
Support: 250.00 / 220.00 / 200.00
Disclaimer – Saxo Bank Group. Please be reminded – you alone are responsible for your trading – both gains and losses. There is a very high degree of risk involved in trading. The technical analysis, like any and all indicators, strategies, columns, articles and other features accessible on/though this site (including those from Signal Centre) are for informational purposes only and should not be construed as investment advice by you. Such technical analysis are believed to be obtained from sources believed to be reliable, but not warrant their respective completeness or accuracy, or warrant any results from the use of the information. Your use of the technical analysis, as would also your use of any and all mentioned indicators, strategies, columns, articles and all other features, is entirely at your own risk and it is your sole responsibility to evaluate the accuracy, completeness and usefulness (including suitability) of the information. You should assess the risk of any trade with your financial adviser and make your own independent decision(s) regarding any tradable products which may be the subject matter of the technical analysis or any of the said indicators, strategies, columns, articles and all other features.
Please also be reminded that if despite the above, any of the said technical analysis (or any of the said indicators, strategies, columns, articles and other features accessible on/through this site) is found to be advisory or a recommendation; and not merely informational in nature, the same is in any event provided with the intention of being for general circulation and availability only. As such it is not intended to and does not form part of any offer or recommendation directed at you specifically, or have any regard to the investment objectives, financial situation or needs of yourself or any other specific person. Before committing to a trade or investment therefore, please seek advice from a financial or other professional adviser regarding the suitability of the product for you and (where available) read the relevant product offer/description documents, including the risk disclosures. If you do not wish to seek such financial advice, please still exercise your mind and consider carefully whether the product is suitable for you because you alone remain responsible for your trading – both gains and losses.

Microsoft - Time to Buy the Dip? Still the undefeated software giant Microsoft , top 3 company of the world has corrected for 25%, nearly as much as we have seen in March 2020.
Is it time to buy?
Fundamental indicators:
Revenue and Profits - consistent strong growth for the past 10 years
Profit margin - impressive 35% in 2021
P/E - although still above the norms with 27x ratio it can be considered by many very much acceptable for this highly effective company
Liabilities - no problems with debt
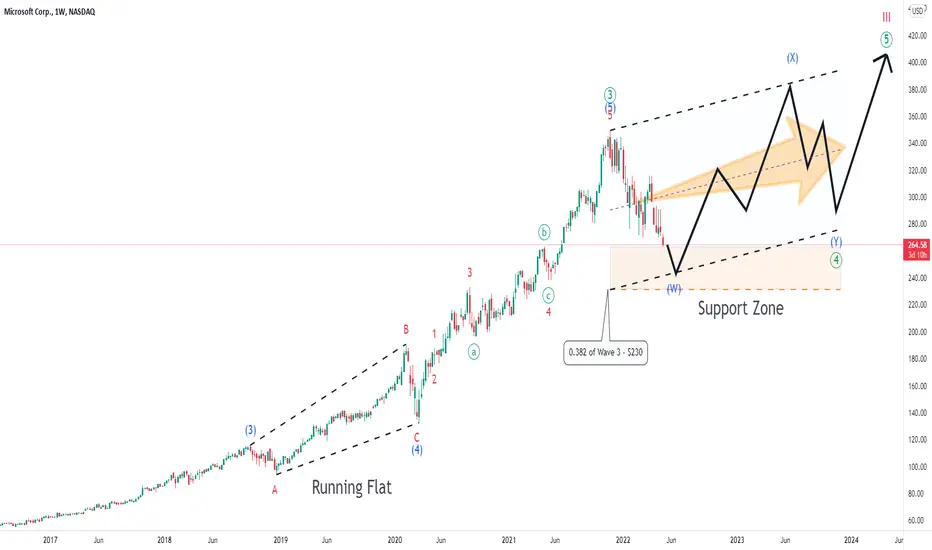
Technical Analysis (Elliott Waves):
The rapid drop in March 2020 has completed correction that has been observed for nearly year and a half and formed by a Running Flat
Since then Microsoft has enjoyed an explosive growth with over 150% increase in an impulse movement
And having peaked at $350 there is another correction developing now
Given the rank of this highly sought after stock it is possible to assume that this correction is going to be similar to the previous one and the depth is not going to exceed 0.382 Fibonacci retracement of wave 3, i.e. not lower than $230, and it will also be shaped as a Running Flat
Duration of this running correction is likely to be longer than the previous one lasting at least till end of 2023 followed by another rocket-like movement to the moon
What do you think about the prospects for Microsoft ?
Please share your thoughts in the comments and like this idea if you would like to see more stocks analysed using Elliott Waves.
Thanks
Will Microsoft let itself be affected by negative events? ⚔️We tend to see triangles everywhere, we realize that this may be redundant for some, but all modes of chartist analysis are good to go.
We also realize that the triangle Microsoft is forming is not the prettiest, but if it is truly a compression triangle, then we could be looking at an upside breakout.
Only time will tell, I must admit that taking positions in these complicated times for everyone is a risky bet, which may or may not be taken for a good performance.
Only two paths are possible, but which one will Microsoft choose?

Microsoft looks like good shortMicrosoft is under a lot of pressure right now and it looks like the bears are more likely to take control. Next possible downside could be 10% down from here. Buckle up! - HH

5/4/22 MSFTMicrosoft Corp. ( NASDAQ:MSFT )
Sector: Technology Services (Packaged Software)
Market Capitalization: $2.174T
Current Price: $289.98
Breakout price: $290.85
Buy Zone (Top/Bottom Range): $288.70-$277.00
Price Target: $303.20-$307.00 (3rd), $320.70-$323.50 (4th)
Estimated Duration to Target: 25-27d (3rd), 55-57d (4th)
Contract of Interest: $MSFT 6/17/22 290c, $MSFT 7/15/22 295c
Trade price as of publish date: $11.65/contract, $11.60/contract

Microsoft lHi Traders
Microsoft here @ demand Zone
if it breaks out it can reach 315 area.
drive safe

IS MSFT OVERVALUED?Microsoft Corporation develops, licenses, and supports software, services, devices, and solutions worldwide. Its Productivity and Business Processes segment offers Office, Exchange, SharePoint, Microsoft Teams, Office 365
Security and Compliance, and Skype for Business, as well as related Client Access Licenses (CAL); Skype, Outlook.com, OneDrive, and LinkedIn; and Dynamics 365, a set of cloud-based and on-premises business solutions for
organizations and enterprise divisions. Its Intelligent Cloud segment licenses SQL, Windows Servers, Visual Studio, System Center, and related CALs; GitHub that provides a collaboration platform and code hosting service for
developers; and Azure, a cloud platform. It also offers support services and Microsoft consulting services to assist customers in developing, deploying, and managing Microsoft server and desktop solutions.
Microsoft is a rock. No doubt. But i feel like that the stock is priced for perfection and if earnings do not constantly surprise investors, then we could see a strong move downward. Especially when we think FED will increase rates and decrease money supply.
MSFT p/e is only 29 which is pretty low for a tech company but its market cap 2.1 trillion dollars. It is %10 of US GDP and around %2,5 of worlds GDP.
How much more can it grow? Where is the line for a company to be too big?
Right now FED is increasing rates and decreasing money supply which is not good for stock market.
This year we can experience that big techs, such as Google, MSFT, Apple is overvalued for this kind of economic policies.
Lets take a look at important price levels.
Support levels
280
266
241
If we cant keep 280 levels as support, fast downward movement to 266 and 241 is possible.
Resistance leves
299
On the upside if we can breakout of 299 level, it is possible for more increase.
Price targets are
310
320
350
Thanks
Follow for more charts and ideas.

MSFT - MONTHLY ANALYSISFollowing the trend, I'd buy Microsoft if breaks the latest high
Stop Loss - Below the latest low
1st Target - R/R = 1,00 - 1/3 Position
2nd Target - R/R = 2,00 - 1/3 Position
3rd Target - R/R = 3,00 - 1/3 Position

Why We Must Use Stop Loss ?! And What The Stop Loss Mean What Is a Stop-Loss Order?
A stop-loss order is an order placed with a broker to buy or sell a specific stock once the stock reaches a certain price. A stop-loss is designed to limit an investor's loss on a security position. For example, setting a stop-loss order for 10% below the price at which you bought the stock will limit your loss to 10%. Suppose you just purchased Microsoft (MSFT) at $20 per share. Right after buying the stock, you enter a stop-loss order for $18. If the stock falls below $18, your shares will then be sold at the prevailing market price.
Stop-limit orders are similar to stop-loss orders. However, as their name states, there is a limit on the price at which they will execute. There are then two prices specified in a stop-limit order: the stop price, which will convert the order to a sell order, and the limit price. Instead of the order becoming a market order to sell, the sell order becomes a limit order that will only execute at the limit price (or better).
Stop-Loss Orders Are Also a Way to Lock In Profits
Stop-loss orders are traditionally thought of as a way to prevent losses. However, another use of this tool is to lock in profits. In this case, sometimes stop-loss orders are referred to as a "trailing stop." Here, the stop-loss order is set at a percentage level below the current market price (not the price at which you bought it). The price of the stop-loss adjusts as the stock price fluctuates. It's important to keep in mind that if a stock goes up, you have an unrealized gain; you don't have the cash in hand until you sell. Using a trailing stop allows you to let profits run, while, at the same time, guaranteeing at least some realized capital gain.
Continuing with our Microsoft example from above, suppose you set a trailing stop order for 10% below the current price, and the stock skyrockets to $30 within a month. Your trailing-stop order would then lock in at $27 per share ($30 - (10% x $30) = $27). Because this is the worst price you would receive, even if the stock takes an unexpected dip, you won't be in the red. Of course, keep in mind the stop-loss order is still a market order—it simply stays dormant and is activated only when the trigger price is reached. So, the price your sale actually trades at may be slightly different than the specified trigger price.

Microsoft Struggling?Microsoft
Short Term - We look to Sell at 306.08 (stop at 317.41)
We look to sell rallies. We look to set shorts in early trade for a further test of the fragile looking support. Levels close to the 50% pullback level of 309.47 found sellers. The trend of lower highs is located at 315.00. Expect trading to remain mixed and volatile.
Our profit targets will be 272.25 and 254.00
Resistance: 300.00 / 310.00 / 320.00
Support: 270.00 / 260.00 / 240.00
Disclaimer – Saxo Bank Group. Please be reminded – you alone are responsible for your trading – both gains and losses. There is a very high degree of risk involved in trading. The technical analysis, like any and all indicators, strategies, columns, articles and other features accessible on/though this site (including those from Signal Centre) are for informational purposes only and should not be construed as investment advice by you. Such technical analysis are believed to be obtained from sources believed to be reliable, but not warrant their respective completeness or accuracy, or warrant any results from the use of the information. Your use of the technical analysis, as would also your use of any and all mentioned indicators, strategies, columns, articles and all other features, is entirely at your own risk and it is your sole responsibility to evaluate the accuracy, completeness and usefulness (including suitability) of the information. You should assess the risk of any trade with your financial adviser and make your own independent decision(s) regarding any tradable products which may be the subject matter of the technical analysis or any of the said indicators, strategies, columns, articles and all other features.
Please also be reminded that if despite the above, any of the said technical analysis (or any of the said indicators, strategies, columns, articles and other features accessible on/through this site) is found to be advisory or a recommendation; and not merely informational in nature, the same is in any event provided with the intention of being for general circulation and availability only. As such it is not intended to and does not form part of any offer or recommendation directed at you specifically, or have any regard to the investment objectives, financial situation or needs of yourself or any other specific person. Before committing to a trade or investment therefore, please seek advice from a financial or other professional adviser regarding the suitability of the product for you and (where available) read the relevant product offer/description documents, including the risk disclosures. If you do not wish to seek such financial advice, please still exercise your mind and consider carefully whether the product is suitable for you because you alone remain responsible for your trading – both gains and losses.


Below Support & Rejected Multiple Times.Extra bullish pump with the purchase that happened but with interest rates still affecting the market, I can see this falling down to retest the previous levels before the pump.
Love it or hate it, hit that thumbs up and share your thoughts below!
Don't trade with what you're not willing to lose. Safe Trading, Calculate Your Risk/Reward & Collect!
This is not financial advice. This is for educational purposes only

Microsoft (NASDAQ: $MSFT): One Of Strongest Stocks In Dow 30! 💪Microsoft Corporation develops, licenses, and supports software, services, devices, and solutions worldwide. Its Productivity and Business Processes segment offers Office, Exchange, SharePoint, Microsoft Teams, Office 365 Security and Compliance, and Skype for Business, as well as related Client Access Licenses (CAL); Skype, Outlook.com, OneDrive, and LinkedIn; and Dynamics 365, a set of cloud-based and on-premises business solutions for organizations and enterprise divisions. Its Intelligent Cloud segment licenses SQL, Windows Servers, Visual Studio, System Center, and related CALs; GitHub that provides a collaboration platform and code hosting service for developers; and Azure, a cloud platform. It also offers support services and Microsoft consulting services to assist customers in developing, deploying, and managing Microsoft server and desktop solutions; and training and certification on Microsoft products. Its More Personal Computing segment provides Windows original equipment manufacturer (OEM) licensing and other non-volume licensing of the Windows operating system; Windows Commercial, such as volume licensing of the Windows operating system, Windows cloud services, and other Windows commercial offerings; patent licensing; Windows Internet of Things; and MSN advertising. It also offers Surface, PC accessories, PCs, tablets, gaming and entertainment consoles, and other devices; Gaming, including Xbox hardware, and Xbox content and services; video games and third-party video game royalties; and Search, including Bing and Microsoft advertising. It sells its products through OEMs, distributors, and resellers; and directly through digital marketplaces, online stores, and retail stores. It has collaborations with Dynatrace, Inc., Morgan Stanley, Micro Focus, WPP plc, ACI Worldwide, Inc., and iCIMS, Inc., as well as strategic relationships with Avaya Holdings Corp. and wejo Limited. Microsoft Corporation was founded in 1975 and is based in Redmond, Washington.

MSFT beating analysts' expectationsAdj EPS: $2.22 vs $2.19 expected
Revenue: $49.4 billion vs $49 billion expected
Cloud: $19.05 billion vs $18.9 billion expected
Revenues for Azure, its flagship cloud offering, rose 46% from last year.
My price target fo MSFT this year is $307.
Looking forward to read your opinion about it.
