Microsoft share going to cross their limitsBuy Microsoft shares because it going to over 500 USD in the coming months. Microsoft purchased many game studios for its metaverse.
Advise by Anshu Sharma (follow me: @anshusharmavats
Microsoft

MSFT Microsoft W-shaped recoveryDan Ives from Wedbush Securities said that investors should focus on “oversold” tech stocks including Microsoft, Apple, Oracle, Adobe and Salesforce, “as well as core chip names ” and cybersecurity companies after Russia invaded Ukraine.
My target for MSFT is $312 for a W-shaped recovery.
Looking forward to read your opinion about it.

MSFT | SHORTOverall market sentiment is bearish, sellers showing up in the zone, price rejection of the simple moving averages on a lower time frame. Recently posted analysis on NASDAQ and I believe a crash is coming. If so, MSFT can head down to the bottom zone at $239-$246.

sell MSFT tradeHigh probability trade for NASDAQ:MSFT stock. I recommend opening 2 positions . 1st Position with Stop loss and take profit as shown here .the 2nd position has the same stop loss but with 261 take profit , when the first position closes and hits the take profit , move the Stop loss to entry price for the second position and wait for it to hit 261 or wait for a take profit update in this post .
This is a high probability trade with a great potential risk reward superior to 5 . In the markets There is never a 100% win probability .The idea is to have the odds in our favor and to be much more right than wrong .

Microsoft: Buy at Crucial Support Microsoft - Short Term - We look to Buy at 279.24 (stop at 272.73)
Preferred trade is to buy on dips. A higher correction is expected. Previous support located at 280.00. 280.00 continues to hold back the bears. The bias is still for higher levels and we look for any dips to be limited.
Our profit targets will be 299.23 and 309.50
Resistance: 300.00 / 315.00 / 350.00
Support: 280.00 / 260.00 / 250.00
Disclaimer – Saxo Bank Group. Please be reminded – you alone are responsible for your trading – both gains and losses. There is a very high degree of risk involved in trading. The technical analysis, like any and all indicators, strategies, columns, articles and other features accessible on/though this site (including those from Signal Centre) are for informational purposes only and should not be construed as investment advice by you. Such technical analysis are believed to be obtained from sources believed to be reliable, but not warrant their respective completeness or accuracy, or warrant any results from the use of the information. Your use of the technical analysis, as would also your use of any and all mentioned indicators, strategies, columns, articles and all other features, is entirely at your own risk and it is your sole responsibility to evaluate the accuracy, completeness and usefulness (including suitability) of the information. You should assess the risk of any trade with your financial adviser and make your own independent decision(s) regarding any tradable products which may be the subject matter of the technical analysis or any of the said indicators, strategies, columns, articles and all other features.
Please also be reminded that if despite the above, any of the said technical analysis (or any of the said indicators, strategies, columns, articles and other features accessible on/through this site) is found to be advisory or a recommendation; and not merely informational in nature, the same is in any event provided with the intention of being for general circulation and availability only. As such it is not intended to and does not form part of any offer or recommendation directed at you specifically, or have any regard to the investment objectives, financial situation or needs of yourself or any other specific person. Before committing to a trade or investment therefore, please seek advice from a financial or other professional adviser regarding the suitability of the product for you and (where available) read the relevant product offer/description documents, including the risk disclosures. If you do not wish to seek such financial advice, please still exercise your mind and consider carefully whether the product is suitable for you because you alone remain responsible for your trading – both gains and losses.

BIG POST! Technical Analysis of 75 Stocks From The S&P 500 List!Hi followers and other TradingView users,
Baron Rothschild, a British banker and politician from a wealthy family, once said that the best time to buy is “when there is blood in the streets.” In simple words, when everyone else is selling, it's a great time to fill your portfolio.
At the moment, there have been quite scary times considering the current situation around Ukraine, plus S&P500 futures made a small break below 4300 , which might open the doors to lower prices. Actually, it is great because it can also open the doors to lower price levels for individual stocks as well.
Considering the potential "threat" to decline, I took over the entire SP500 list and analyzed all of them!! Those that caught my eye did a technical analysis to find the optimal entry points. Quite a lot of work, but I thought to share it with you guys as well, maybe you may find something useful here.
"Buy when there’s blood in the streets, even if the blood is your own."
The best stocks to invest in are the ones already existing in your portfolio. Maybe they are trading at lower prices, and your portfolio is in red. However, they are still the best options available to you. Why? If your's and your company's thesis are the same then you have already analyzed those stocks, and they are still in your portfolio only because you’re confident that they will perform well in the future. Then why not invest more in such stocks when they are down. As I have said previously take it as "SALE" in the mall. Look into your portfolio and find out those stocks which are currently trading at a cheaper price, hopefully, you find something from here as well.
Now, to talk about my given stocks below. These are just technical analyses, I can give the optimal entry prices for each one but you have to do your own fundamental analysis for them. One of my favorite "quote" about both analysis: Fundamental analysis tells you WHAT to buy, technical analysis tells you WHEN to buy. So, I share some ideas from where you can buy certain stocks but do your homework and do the fundamental analysis, do not follow them blindly!
In this post, you can find breakout opportunities to buy the strength after certain price levels have broken. Here are buying zones after corrections and some bigger names I have pointed out some price levels from where you can buy every dip to build up your long-term portfolio.
Use partial entries, long-term position builders can enter into certain stocks after it has reached inside the shown box and buy more if they should fall lower from the initial entry to average the entry price. Mid-term investors should start to build their positions somewhere in the middle of boxes.
Love it or hate it but here they are...
1) Apple (AAPL) - Buy the dip.
2) Adobe (ADBE)
3) Advanced Micro Devices (AMD)
4) Amazone (AMZN)
5) Arista Network (ANET)
6) Aptiv PLC (APTV)
7) American Express (AXP) - Buy the dip.
8) Bio-Rad Laboratories (BIO)
9) BlackRock (BLK)
10) Ball Corporation (BLL)
11) Berkshire Hathaway (BRK.B) - Buy the dip.
12) Cardinal Health (CAH)
13) Ceridian HCM Holding (CDAY)
14) Charter Communications (CHTR)
15) Comcast Corp. (CMCSA)
16) Cummins (CMI)
17) Salesforce.com (CRM)
18) Cisco Systems (CSCO)
19) Caesars Entertainment (CZR)
20) Devon Energy (DVN)
21) Electric Arts (EA)
22) eBay (EBAY)
23) Enphase Energy (ENPH)
24) Expeditors International of Washington (EXPD)
25) Meta Platforms (FB)
26) FedEx (FDX)
27) First Republic Bank (FRC)
28) General Motors (GM)
29) Alphabet (GOOG)
30) Genuine Parts (GPC)
31) Goldman Sachs (GS)
32) Hormel Foods (HRL)
33) Intel (INTC)
34) Ingersoll Rand (IR)
35) Intuitive Surgical (ISRG)
36) Johnson Controls International (JCI)
37) Johnson & Johnson (JNJ) - Buy the dip.
38) CarMax (KMX)
39) Kroger Company (KR)
40) Lennar Corp. (LEN)
41) LKQ Corp. (LKQ)
42) Southwest Airlines (LUV)
43) Las Vegas Sands (LVS)
44) Microchip Technology Incorporated (MCHP)
45) Altria Group (MO)
46) Moderna (MRNA)
47) Morgan Stanley (MS)
48) Microsoft (MSFT) - Load it up ;)
49) Match Group (MTCH)
50) Netflix (NFLX)
51) NRG Energy (NRG)
52) NVIDIA (NVDA)
53) NXP Semiconductors (NXPI)
54) Pfizer (PFE)
55) PerkinElmer
56) Pentair (PNR)
57) Public Storage (PSA)
58) PayPal (PYPL)
59) Qorvo (QRVO)
60) Rockwell Automation (ROK)
61) Rollins (ROL)
62) Snap-On Incorporated (SNA)
63) Seagate Technology (STX)
64) Skyworks Solutions (SWKS)
65) TE Connectivity (TEL)
66) Thermo Fisher Scientific (TMO)
67) Trimble (TRMB)
68) Tesla (TSLA) - You can buy it now but save some ammo for lower prices!
69) Train Technologies (TT)
70) Take-Two Interactive Software (TTWO)
71) United Rentals (URI)
72) Waters Corp. (WAT)
73) Exxon Mobil Corp. (XOM)
74) Xylem (XYL)
75) Autodesk (ADSK)
And that's all. Some may say and think that some of the given prices will never reach these zones. I would like to tell them - whatever! At least we are prepared, and if something bigger could happen with to the stock market, those who are prepared will win, because in March 2020 the bottom was made in just a few days.
Prepare, wait, aim, and shoot!
Do your homework!!
Regards,
Vaido

Buy Microsoft (MSFT) at 274$-276$ to target 291$-294$Buy Microsoft at market (probably 274$-276$ range) than w8 some days to sell at 291$-294$

possible HS on EFII love EFI token, will it moon? no idea
but Microsoft just bough the worlds second biggest game company,
Microsoft work with ENJIN
ENJIN launched EFI efinity
and it's a gaming NFT blockchain..
I'm buying loads of it
DYOR

MICROSOFT-MSFT STOCKS WILL FALL (Bearish flag)MICROSOFT STOCKS WILL FALL -9.72% (Bearish flag) NASDAQ:MSFT

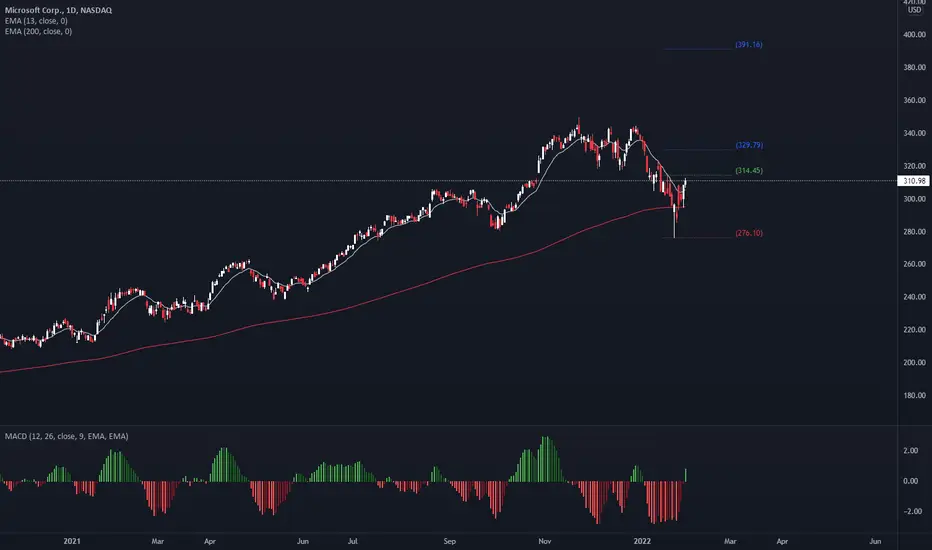
Microsoft (MSFT) | The safest target to climb📍Hello traders, Microsoft in daily timeframe , this analysis has been prepared in daily timeframe but has been published for a better view in 2 day timeframe.
The general structure of this counted wave is unclear and we need more waves to detect it.
Now, according to the count, the main waves 1 and 2 have been formed and now we are inside wave 3.
This wave 3 has formed its wave 4 in such a way that it can not be said that it is complete or this ascent that we are considering is part of wave 4.
In terms of time, wave 4 is normal compared to wave 3.
We are currently waiting for an uptrend that this trend may take place before the 270 range and possibly after this price at which the correction structure will change and possibly end in a leading triangle.
If the canal roof is broken upwards, it is a confirmation to start the upward movement.
🙏If you have an idea that helps me provide a better analysis, I will be happy to write in the comments🙏
❤️Please, support this idea with a like and comment!❤️

FAANG Dead? The NEW Tech Stock Leaders!With the disasterous earnings of Netflix NASDAQ:NFLX and Facebook NASDAQ:FB this past month it may be time to call for a new acronym of the still bullish and strong Tech Stock leaders of the market: Micosoft NASDAQ:MSFT - Apple NASDAQ:AAPL - Google NASDAQ:GOOG - Amazon NASDAQ:AMZN

Microsoft (MSFT) | The safest target to climb📍Hello traders, Microsoft in daily timeframe , this analysis has been prepared in daily timeframe but has been published for a better view in 2 day timeframe.
The overall identity of this counted wave is unclear and we need more waves to detect it
Now, according to the count, the main waves 1 and 2 have been formed and now we are inside wave 3
This wave 3 has formed its wave 4 in such a way that it can not be said that it is complete or this ascent that we are considering is part of wave 4.
However, according to our calculations, the trend has an upward phase that may go to the end of wave 3
If the 278 range is broken down, the correction structure is changed and the ascending phase is performed in the lower range.
🙏If you have an idea that helps me provide a better analysis, I will be happy to write in the comments🙏
❤️Please, support this idea with a like and comment!❤️

Microsoft Step UpThe R:R favors a LONG.Hold on until above 297 on close.Targeting 333 for the upcoming week or two.

Hold MSFT an Prepare for Buy opportunitiesDay Time Frame markup of MSFT as of 2/2/2020. Microsoft has been moving in an up-trending fashion since about May 2021. The ATH is $349.67 which was achieved on 11/22/2021.

Apple and Microsoft make 23% of the qqq and large % many fundsHere is just apple and microsft added together.
I cant predict the future, but i can draw pretty lines to help observe.
Will these 2 giants continue to grow and go up in 2022?

MICROSOFT - Long PositionStrong corporate earnings from Microsoft. Software giant Microsoft reported record quarterly revenue above $50 billion for the first time, beating expectations, and offered a rosy outlook for the current quarter last Tuesday. That helped boost stock market futures for the next day, though the gains were given back by volatility driven by an announcement from the Fed The Dow Drops as Powell Talks — and What Else Is Happening in the Stock Market Today The market sank as Chairman Jerome Powell signaled the possibility of many more rate increases than the stock market had been expecting.
MONDAY LIVE: USA Index and Forex OverviewHi Traders,
This is my view for this week on:
- SPX500
- NASDAQ
- APPLE
- MICROSOFT
- EURGBP
- USDJPY
- USDCAD
I remind you that this is only a forecast based on what current data are.
Therefore the following signal will be activated only if specific rules are strictly respected.
If you follow my strategy you will be able to identify the right filters and triggers to enter correctly the market and avoid fake signals.
I really hope you liked this video and I would like to know what do you think about this analysis, so please use the comment section below this video to give me your point of view.
Thank You
Pit

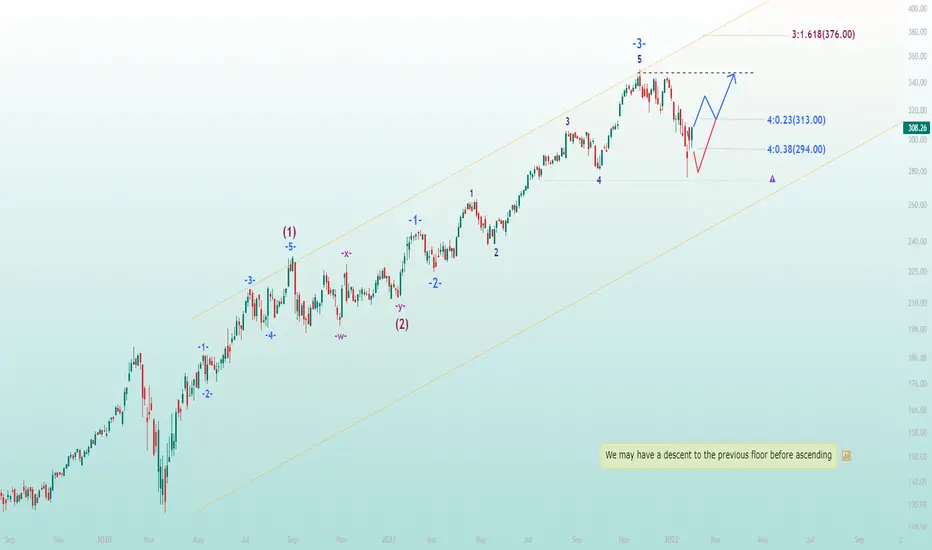
Microsoft (MSFT) | The safest target to climb📍Hello traders, Microsoft in daily timeframe , this analysis has been prepared in daily timeframe but has been published for a better view in 2 day timeframe.
It is better for Rajab not to talk about the general nature of this wave and to explain only the counted part.
Based on the counting of the first wave 1 and 2, it has ended in a very normal state and now we are inside the third wave.
From wave 3, waves 1, 2 and 3 are completed and now wave 4 is taking place.
We thought that wave 4 was flat, but considering its current motion, which has a steep slope, this motion is part of a flat, in fact, wave a is this flat and the next ascending motion is for wave b, and this motion is done until the beginning of wave a.
We may have a descent to the previous floor before ascending.
🙏If you have an idea that helps me provide a better analysis, I will be happy to write in the comments🙏
❤️Please, support this idea with a like and comment!❤️
Microsoft Analysis 26.01.2022Hello Traders,
welcome to this free and educational analysis.
I am going to explain where I think this asset is going to go over the next few days and weeks and where I would look for trading opportunities.
If you have any questions or suggestions which asset I should analyse tomorrow, please leave a comment below.
I will personally reply to every single comment!
If you enjoyed this analysis, I would definitely appreciate it, if you smash that like button and maybe consider following my channel.
Thank you for watching and I will see you tomorrow!

MSFT | Swinging it longBought into MSFT today and this is my play, 11% potential upside with a 3% downside risk. Additionally, potential bullish reversal spotted on the NASDAQ.

MSFT earnings and long term predictionI am going to long MSFT for these reasons
~We have officially touched the 0.786 fib retracement which is a great sign to go long again
~MSFT earnings on Tuesday. MSFT bought out Activation Blizzard, so it will be interesting to see how they announce their plans.
~ALSO A while back, Mojang merged Minecraft launchers with Microsoft. SO now all minecraft java users use Microsoft login instead of mojang login.
~On the 4 hour chart there is VERY CLEAR BULLISH DIVERGENCE
~From the last ATH MSFT has pulled back 15 percent, which is a really big pullback.
~We are also on the bottom of the downward wedge, meaning that this will be a good zone to set enter with a SL below the support. As it is a very small loss. With downward wedges, it most likely will break on the up.

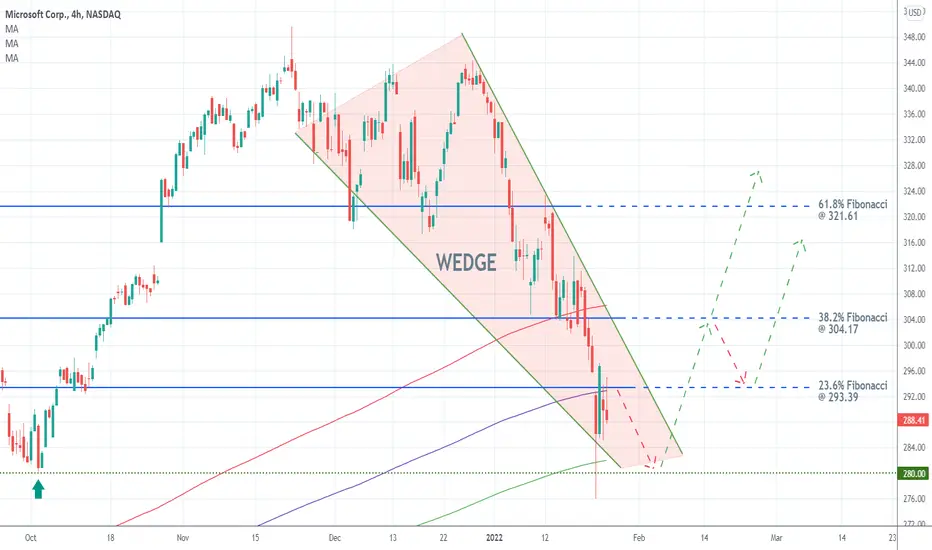
Microsoft's Descending Wedge Yesterday, Microsoft posted better-than-expected earnings for Q4, which is likely to help the reeling stock rebound. The correction is likely to be terminated around the previous swing low at 280.00 where a descending wedge is expected to be completed.
The first obstacle for the eventual rebound would be the 23.6 per cent Fibonacci retracement level at 293.39, which is currently converging with the 400-day MA (in purple). The next target would be the 38.2 per cent Fibonacci at 304.17.
In addition to the fact that it was recently crossed by the 300-day MA (in red), the resistance is positioned just above the psychologically significant threshold at 300.00. All of this implies the probable accumulation of strong selling pressure just above the 38.2 per cent Fibonacci.
MSFT Tech Bubble BurstBubble burst mode engaged.
It'll be back to reality for most equities. Speculative garbage and big tech has the most air to be let out of the balloon.
MSFT is a great large growth company but a price/revenue ratio of 12+ is insane, it has to fall quite a bit to be a good buy.
