Swing trade on ABMLIm following the price,the price is falling while the volume rises, it could indicate a volume divergence that brings a strong break of the descending wedge that is being formed, wait for the wedge to break, stop loss below the last low, good upward movement
Microsoft

#Microsoft resistance break waiting pullback for entrywww.tradingview.com
Following the break of the support, a great entry point will be the pullback to resistance line at 305 $

Microsoft bullish longThese are my thoughts on MSFT. They are meant to give you an idea, not trading advice.
My targets on Microsoft. Can't say much more than that.
Hope it can help you.
Please be careful, as the market never gives you certainties, only probabilities!
ALWAYS REMEMBER THIS WHEN YOU TRADE

msft analysemsft now is in the résistance area in the range and there is no volume that give an opportunity for a break . so i think it will go down

$QFIN biggest Buy of your life $25 Call for .05 cents make moneyMake tons of money by trading $QFIN a very strong fundamental finance tech company. It will make you over 20% in the next 2 months. Good trade before Expiration date!

MS : Consolidation phaseMicrososft in daily is in consoidation phase and incertitude.
to buy we need to wait the break of the superior limit of the range.

Microsoft: It ain’t over! 🙌🙌🙌In our current analysis of the Microsoft stock, we have identified a turnaround area around $272.26. After reaching a low there, the stock should soar to new heights around $330.
Happy weekend!

Microsoft getting ready for the next move higher$MSFT is a powerhouse.
Trend following, moving into ascending triangle formation, looking for the next break.
Buildup under res, RSI back above 50, MACD crossed, volume rising.
Been holding for a long time, but the chart is still great.

MSFT Microsoft Price TargetMicrosoft Plans $60 Billion Share-Buyback Program and raised its quarterly dividend to 62 cents a share from 56 cents a share.
Based on the news and the bullish characteristics of the chart, my price target is 325usd before a pullback.

MSFTMicrosoft board approved a plan to buy back as much as $60 billion of its stock today.
Trade Idea: 9/17 307.5C

MICROSOFT Daily TIMEFRAMESNIPER STRATEGY
This magical strategy works like a clock on almost any charts
Although I have to say it can’t predict pullbacks, so I do not suggest this strategy for leverage trading.
It will not give you the whole wave like any other strategy out there but it will give you huge part of the wave.
The best timeframe for this strategy is Daily, Weekly and Monthly however it can work any timeframe above three minutes.
Start believing in this strategy because it will reward believers with huge profit.
There is a lot more about this strategy.
It can predict and also it can give you almost exact buy or sell time on the spot.
I am developing it even more so stay tuned and start to follow me for more signals and forecasts.

Drawn trendline + LR on QuisCharts are an amazing tool. Been an amazing 1.5 years having control of my money to learn about technical analysis. I have been meaning to take a look at quis technically on this uptrend, Linear Regression I find is a great tool to price gain further context on longer time frames.
I started this chart by inputting my own support and resistance trend lines. It follows that as you map out a line acting as resistance and one as support, you are going to find alot of the stocks price action in between. This price action acts as data to be inputted into a Linear Regression model. Utilizing 3 regression lines set from Standard Deviations -3 to +3, we capture 99.7% of data-price, for Quis.
Quis over the past week has again started tightening up. Trading well below its daily average today into last weeks session. I have to admit I was off on the last tighten up around earnings. stock slipped up and went the other way for a week. these weeks candles and volume will be very telling to me on Quis being ready to go.
Catalysts on the near term horizon include Visa end point certification for LedgerPay. LedgerPay is the first payment processing solution that is built on cloud technology, Microsofts Azure Cloud to be specific. You may have seen news out that Amazon is looking to build its own payment platform for retail business. Its to be able to take in all the data on AWS network and make AWS more valuable. Microsoft in a battle forever now on cloud with Amazon got here first by working with Quisitive, a premier partner of microsoft. Microsoft expects to punch back here with Quis as its boxer, this is due to the product offering and funcationality of Ledgerpay and its data intelligence arm and those capabilities.
Further to certification, I think a contract being landed (guidance given on last earnings call Q&A that customers for Ledgerpay would likely be signing contracts before or shortly after LP is fully commercialized with Visa end point cert. It is on news of these contracts I feel the stock can push up to an area in the +2-+3 SD Channel. CEO Mike Reinhart represented Quis on an gateway investor webinar last week and guided that an uplist in Canada to the TSX was foundationally in place, and that US uplist was near as well. $QUISF currently trade on the pinks OTC. Quis also just filed an updated and amended SBP, as i note in my DD pieces, dilution is part of the game here and a risk to upside movement. Given the last two raises made by quis came after moves up, I think it follows that this will will too, but that may not align with acquisition opportunity forcing it to come earlier.
In any case please always do your DD, feel free to check out my substack lebellechart for my own DD, and follow your own trading & investing rules.
Cheers,
Luke

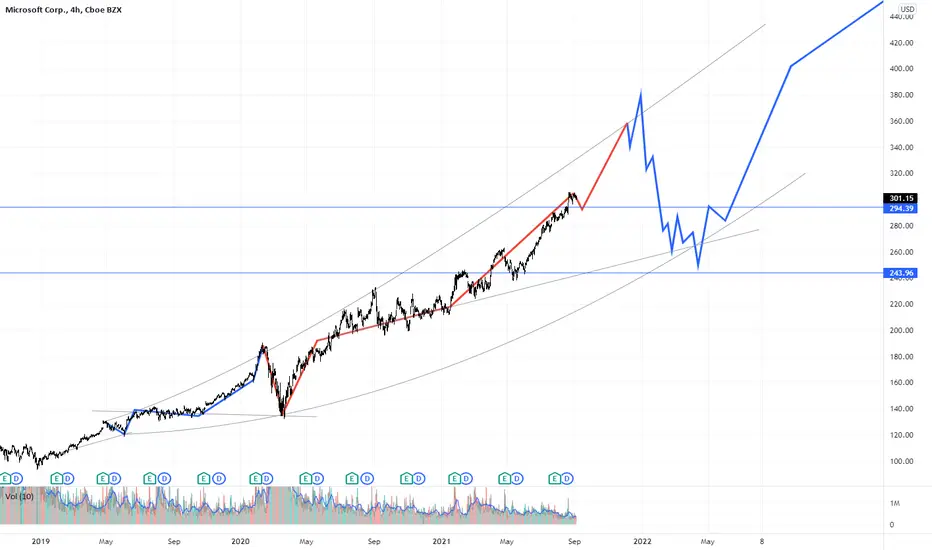
Winter is coming // $MSFT idea based on fractalsTrying to predict $MSFT correction using fractals, many expect a correction this year and its all about timings, I bet on this winter, will see..
The Apple Index is approaching its channel ceilingAccording to the data in the chart and the condition of the candlesticks, we are expected to see a negative reaction again when hitting the roof of the canal.
Microsoft - $400 2021 Price TargetAt the time of this post:
$AMZN | $3,479
$GOOG | $2,916
$TEAM | $371
$MSFT | $301

MSFT Short position Microsoft Corporation is an American multinational technology corporation which produces computer software, consumer electronics, personal computers, and related services.
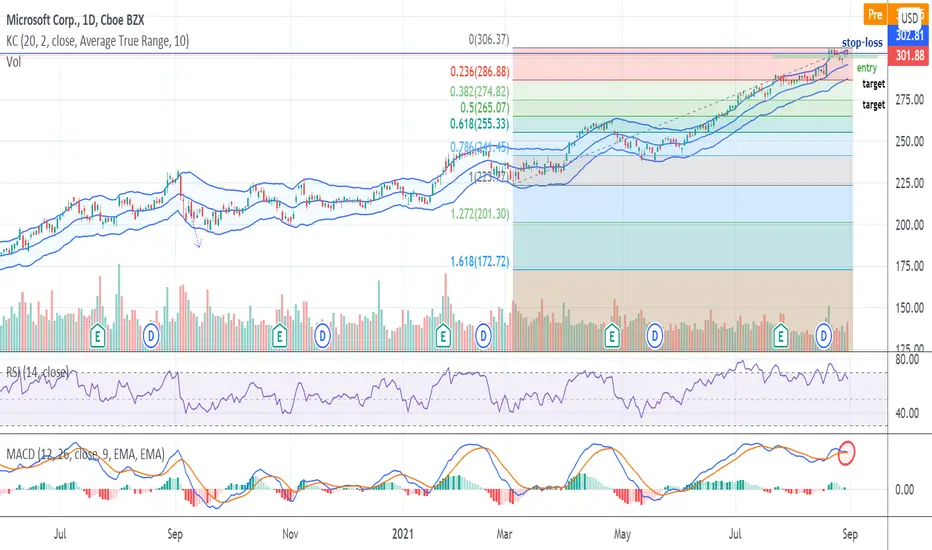
From mid-May, we can see an increasing trend of the Microsoft Corporation. However, according to the MACD indicator that shows a bearish confirmation, we expect a decrease in the stock price. Also, RSI recently reached 70 and is showing a decrease these days. Moreover, the price hit an upper boundary of the Keltner channel.
Position: SHORT
Stop-loss $302.81
Entry range: $299.93-$302.81
Target I: $286.88
Target II: $274.82
As soon as target I is reached, we recommend repeating the test again and deciding whether to continue with a short position hence, to target II, or to go a long position.
$msft ready for new ATH my pt is $320 #microsoft Microsoft is ready for new ATH , V shape at highs and now is the beginning for the second wave
i am long to $320
medium PT from analysts are $330 ..
a safe bet like Apple and PayPal
check out Visa V ...
disclaimer

ETH: $3,300 to $14,000 and $35,000 RoadmapBitcoin Investors see Ethereum 2.0 as the gateway to new economies

MSFT - MicrosoftMy bias on Microsoft remains bullish with lower side shorts between.
Please share your opinion in the comments below and thank you for the support

MICROSOFT:FUNDAMENTAL ANALYSIS+PRICE ACTION & NEXT TARGET|LONG🔔Microsoft released its fourth-quarter results on July 27. The company's revenue rose 21% year over year to $46.2 billion, beating forecasts by $1.9 billion, and earnings rose 49% to $2.17 per share, beating expectations by $0.25. Commercial cloud revenue - which comes primarily from Microsoft 365 (formerly Office 365), LinkedIn, Dynamics CRM, and the Azure cloud infrastructure platform - rose 36% from a year ago to $19.5 billion.
That represents an acceleration from the 33% growth in the commercial cloud segment in Q3, but Azure's 45% year-over-year revenue growth in constant currency slowed down from the 46% growth in the third quarter. However, Azure revenue still grew 51% in the period, compared to 50% growth in the previous quarter, so it profited from favorable currency factors.
Azure's growth rate still looks strong, but Microsoft's unwillingness to disclose any further numbers on the cloud platform is discouraging. Let's look at three reasons why Microsoft should finally open the curtain.
First, it is one of Microsoft's most significant businesses.
Azure is the main growth engine of the commercial cloud division. It has consistently grown faster than Microsoft/Office 365 and Dynamics 365 and remains the second-largest cloud infrastructure platform in the world after Amazon Web Services (AWS).
According to Canalys, Azure controlled 22 percent of the global cloud infrastructure market in the second quarter of 2021. It is behind AWS at 31%, but well ahead of Alphabet's Google Cloud, which is in third place with an 8% share.
Disclosing the exact amount of Azure's revenues and profits would let investors know whether Microsoft has pricing power in this competitive market, or whether it is simply trading margins for market share.
Second, consider that Amazon and Google don't hide their cloud metrics.
In 2015, Amazon began reporting accurate data on AWS revenue and operating profits. Google followed suit, reporting accurate Google Cloud revenues in 2019 and then disclosing the division's operating losses in 2020.
Last year, Amazon's AWS revenue grew 30% to $45.4 billion, or 12% of total revenue. Segment operating income rose 47% to $13.5 billion and accounted for 59% of operating income. In other words, Amazon can support the development of its low-margin retail business at the expense of its higher-margin cloud business, giving it an advantage over other online and offline retailers.
Revenues at Alphabet's Google Cloud unit rose 46% to $13.1 billion in 2020, a 7% increase. The division's operating loss increased from $4.6 billion to $5.6 billion, but Alphabet's total operating income still rose 20% to $41.2 billion. These numbers suggest that Google Cloud is offering lower prices than AWS to expand its market share, but the company can afford to stick with this losing strategy since it can compensate its losses from cloud computing with higher advertising revenue.
As for Azure, investors still don't know how much the cloud platform boosts Microsoft's revenues and how much it reduces profit growth.
Finally, no more vague hints about Azure's margins.
Microsoft executives mention Azure dozens of times during every conference call, but only hint a few times at the platform's actual gross margin. During Microsoft's third-quarter conference call in April, CFO Amy Hood said Azure's gross margin is growing, but the "shift in sales mix toward Azure" is still reducing the overall gross margin of the commercial cloud segment.
In the fourth quarter, Microsoft said that commercial cloud gross margins "increased 4 points to 70% despite the shift in revenue mix toward Azure," and the 14% year-over-year increase in operating expenses was mostly "driven by investments in Azure" - but we don't know exactly how much was spent.
These indefinite comments tell us three things about Azure: it makes far less profit than Microsoft's other commercial cloud businesses, it offers customers lower rates to keep up with AWS and Google Cloud, and it is constantly expanding with new investments and services.
Giving accurate revenue and operating profit data would clarify things and show investors how much money Microsoft is losing (or perhaps making) on one of its fastest-growing businesses.
Former Microsoft CEO Steve Ballmer recommended the management to reveal cloud revenue, margins, and profits six years ago, but his successor, Satya Nadella, did not follow the advice. Nadella's position made sense then, as Microsoft was just beginning its transition, but today it doesn't make much sense-particularly after Amazon and Google have laid all their cards on the table.

$MSFT Going Red?! $285 Retest!I have linked the $QQQ Video below
watching Volume and price action we have found ourselves at a major stopping resistance. With QQQ at the top of a well respected channel and $MSFT struggling to stay up we could see a pullback in the weeks to come.

Microsoft Up 1739 Points!Microsoft has progressed nicely since the last post a week ago, moving up 1739 points
at the time of posting and still moving strong.
Price has not made contact with the weekly 50 simple moving average since March 2020,
but it has been using the daily 20 & 50 simple moving averages as support.
We have been seeing deep pullbacks since 2020, but from June 2021 the behaviour
of price has changed and we are seeing more of a linear clean move.
Earnings came out on July 27th, which didn’t disrupt the flow of price. A mini
consolidation has followed earnings and we now await a breakout above the current
all-time high at $290.
A break and close above the recent high will confirm a trend continuation and a move
towards the $300 round number.
How will price react to the $300 round number? This is anyone’s guess, but the
momentum should take price higher over the long term.
See below for more information on our trading techniques.
As always, keep it simple, keep it Sublime.

Microsoft short (simple analysis)Possible presence of a channel where the price fluctuates. Key point for trend relaxation to occur.
