Buy MSFT (Microsoft) 1/7/2020The stock is moving up on the daily chart.
Prices tested the MA 13 and rose again.
So we can start buying it.
Microsoft

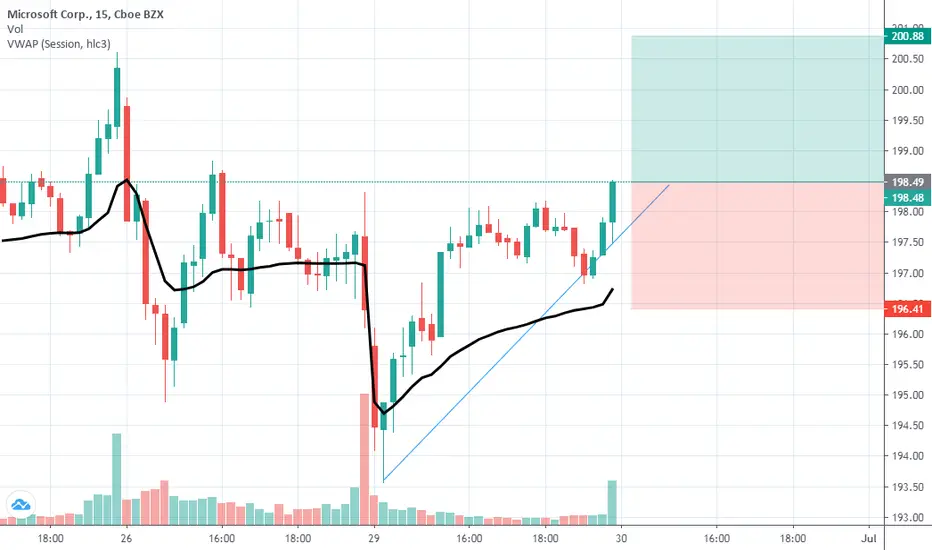
microsoft analysis in 15 min (BUY SIGNAL)dont sell in microsoft the chart will go up again its for buy


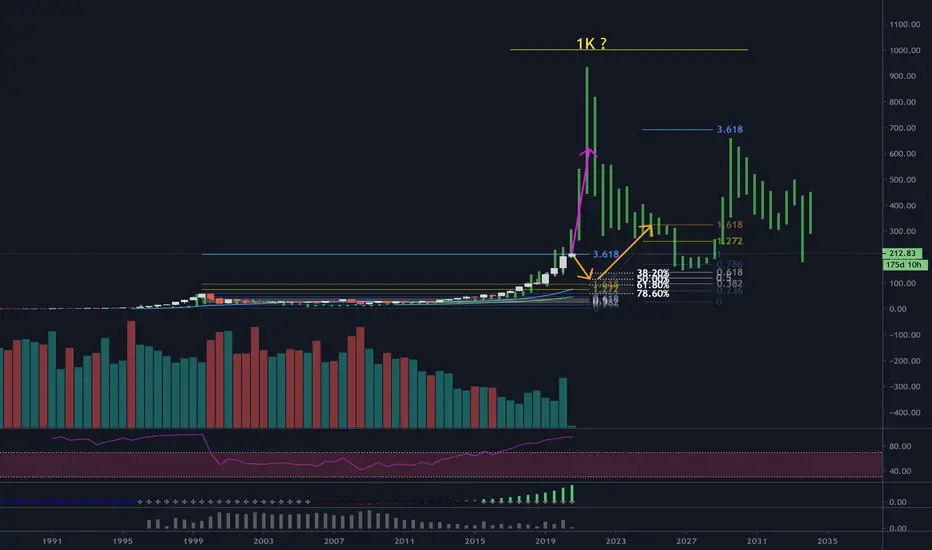
MICROSOFTThese are my thoughts on MSFT. They are meant to give you an idea, not trading advice.
Microsoft hitting resistance on a 6 month time frame.
Will it cool off here and retrace, or is this going to shoot for the stars.
These are 6 month candles, so it will be interesting to see what it will do in the long term.
I placed a bubble pattern on top of it to see what it "could" do if it blows out of proportion. This would mean it could hit 1K by the end of this year.
Please be careful, as the market never gives you certainties, only probabilities!
ALWAYS REMEMBER THIS WHEN YOU TRADE
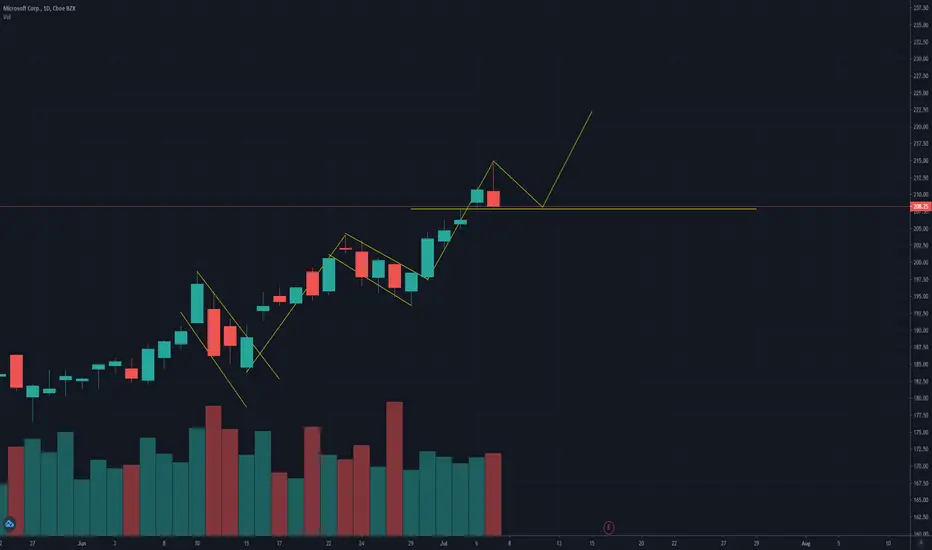
MSFT 220$MSFT made another ATH today. I have a 220 price target on MSFT. I know the drawings aren't the best but they look the same. A little overbought but not worried. Closed today at 208. Support is at 208. Looking strong but can see some pullback. Might see it push all time highs again tomorrow (July 8th). Will pick up calls again for 220. MSFT will beat earnings so I am pretty confident in this company.
Bullish Charts - Golden Cross Soon, Possible BuyoutMicron Technology, Inc. engages in the provision of innovative memory and storage solutions. It operates through the following segments: Compute and Networking Business Unit (CNBU); Mobile Business Unit (MBU); Storage Business Unit (SBU); and Embedded Business Unit (EBU). The Compute and Networking Business Unit segment includes memory products sold into cloud server, enterprise, client, graphics, and networking markets. The Mobile Business Unit segment offers memory products sold into smartphone, and other mobile-device markets. The Storage Business Unit segment comprises of SSDs and component-level solutions sold into enterprise and cloud, client, and consumer solid-state drive (SSD) markets, other discrete storage products sold in component and wafer forms to the removable storage markets, and sales of 3D XPoint memory. The Embedded Business Unit segment consists of memory and storage products sold into automotive, industrial, and consumer markets. The company was founded by Ward D. Parkinson, Joseph L. Parkinson, Dennis Wilson, and Doug Pitman in October 1978 and is headquartered in Boise, ID.
At current levels, I feel Micron is undervalued and unappreciated.
There are not many devices in the technology industry that do not need memory and storage. Micron can supply the memory and storage from electric vehicles to computers and spaceships to airplanes. Almost everything today needs memory including appliances and smart homes.
Micron just posted earnings and they blew past Wall Street estimates and then the company raised guidance and forecast higher earnings and revenue moving forward.
Currently, on the Daily Chart, the following indicators are Bullish...
Volume, Bullish
MACD, Bullish
RSI, Bullish
Accumulation, Bullish
Sector, Bullish
PMO is turning up, Bullish
On June 30, the 50-Day MA crossed up above the 100-Day MA, Bullish
As of today, the 50-Day MA is less than a point away from crossing up above the 200-Day MA, Bullish
Here are the indicators...
6-Jul-20 50.92
▲ Mon MU New York
6-Jul-20
50.92 Bullish Kijun Sen Cross Strong
27-May-20
49.45 Bullish Kumo Breakout
26-May-20
45.80 Bullish Chikou Span Cross
4-May-20
44.46 Bullish Senkou Span Cross
In my opinion, I think Micron is the best play in town and I also think it's a buyout target. If I were the CEO of Microsoft or another large tech giant like Apple, I wouldn't even think twice about trying to buyout Micron because down the road, everything will need memory and storage to operate.
If Micron is bought, I think the buyout would be upwards of $120 per share.
This was from 2016 and in my opinion, Micron looks better now than ever before... If it looked good in 2016, it looks amazing now!
Chipmaker Micron Gains with Speculation It's a Takeover Target
www.industryweek.com
Long!
DISCLAIMER
The Content herein is for informational purposes only, you should not construe any such information or other material as legal, tax, investment, financial, or other advice.


Microsoft ........ Becomig soft ?? Time Frame : 3 - 7 trading sessions
Last Close : 196.39
Every rise to 198 / 199 to be sold... ( View negates above 201.5)
Trend down : 191 / 187 good bounceback zones...
Below 187 bears will have full control.....

Microsoft Vs other major asset classesThe chart depicts the percentage rise in value of Microsoft Shares vs. other major assets like Gold, Silver, Platinum, Palladium, Barrack Gold that are generally considered to be safe heavens. There is a reason why investors do not go all out into these safe heaven. The questions is this: Is it time to put your money into Microsoft and Tesla or should we wait now. Have we missed out the train? Has the era of Technology about to end like the dot com bubble?


Bullish Charts - Golden Cross, Facebook Shuts Down HobbiPinterest, Inc. provides visual discovery engine in the United States and internationally. The company's engine allows people to find inspiration for their lives, including recipes, home and style ideas, travel destinations, and others. It shows them visual recommendations based on people personal taste and interests. The company was formerly known as Cold Brew Labs Inc. and changed its name to Pinterest, Inc. in April 2012. Pinterest, Inc. was founded in 2008 and is headquartered in San Francisco, California.
On 07/01/20, news hit the wires that said Facebook confirmed it was shutting down its rival website / app Hobbi leaving Pinterest with great potential & almost no competition.
With Short Sellers controlling around 5.54% of the stock, and the news that Facebook is shutting down its rival app, I think this stock could easily run and possibly double in price.
Daily Chart is Bullish
The 50-Day MA just crossed up above the 200-Day MA
Volume, MACD, RSI, Stochastic and Accumulation are all Bullish
The Cloud is Bullish - Indicators listed below.
12-Jun-20
20.89 Bullish Chikou Span Cross Strong
29-May-20
20.29 Bullish Tenkan/Kijun Cross Strong
26-May-20
19.50 Bullish Kijun Sen Cross Strong
26-May-20
19.50 Bullish Kumo Breakout
27-Apr-20
20.78 Bullish Senkou Span Cross Strong
PINS could be the only play in town for what it has and does.
Long!
DISCLAIMER
The Content herein is for informational purposes only, you should not construe any such information or other material as legal, tax, investment, financial, or other advice.

study of one of my all time favourite TESLA !the stock as per chart and price action is a range play for either sides
overall good as long as above 830 for 950/960 targets
wile a good short opportunity in zone 950/970 for 830/820 targets


Microsoft Dropping !! Bad news on MSFT on Friday lost 500MStock started plummeting down by 2.75% Already and will probably continue in a down slope towerds the 186$ mark
Enter SELL @ 195.00 $
T/P @ 183.80$
S/L @ 200.00$ ( psychological Barrier)
11.20$ Move Profit
5$ Move loss
2.2:1 Risk Reward Ratio!!!
Follow for more tips -CAuse we Trading for that Paper!

Comparison of the best technology companies since 2015.Comparison of the best technology companies since 2015:
#NAMAFG Netflix Amazon Microsoft Apple Facebook Google


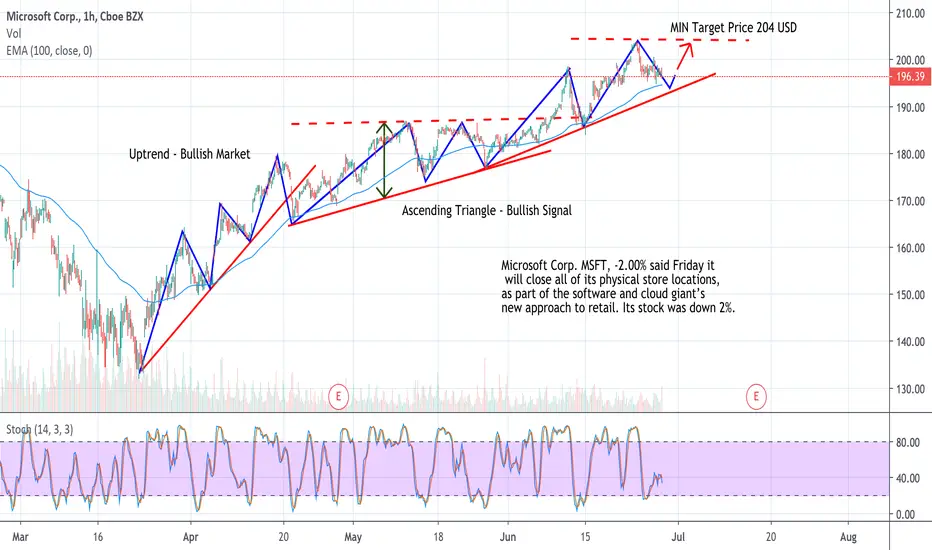
MICROSOFT - MSFT stock AnalysisBased on Technical Analysis, the idea is to go long as per major trend. Before going long wait that the trendline will be tested or wait that the moving average will work as support for the price movement.
Fundamental analysis:
Microsoft Corp. MSFT, -2.00% said Friday it will close all of its physical store locations, as part of the software and cloud giant’s new approach to retail. Its stock was down 2%.
APPLE 🟩🟨🟥 True Facts About Justin Bieber's Love of Apple💬Apple closed some stores for COVID related reasons in some states, but it also opened stores due to re-openings in other states. That is sort of mixed news for Apple.
Meanwhile, the fear in the market over a bearish IMF report and some rising COVID cases is legitimate.
Overall, however, there is logic and reason to bet on Apple.
Apple just made a string of bullish announcements at their recent digital-only keynote and Apple's chart is generally very bullish and tends to respect support/resistance levels.
Let's take a look at some Apple levels that the bulls will need to deal with to keep this tech giant's bull run going.
Hit that 👍 button to show support for the content!
Help the community grow by giving us a follow 🐣
-----
Support:
S1: The S1 S/R flip and pivot point is a logical place for the bulls to find support if they should need it.
S2: The S2 orderblock is good backup support for the bulls. The market is a bit jittery right now, so it wouldn't be shocking to see a further correction and a reaction at S2.
S3: Finally, the S3 S/R flip and price pivot point at the previous all-time high (ATH) range should hold if a more substantial correction ends up being needed. Apple has every reason to keep running, but no asset is immune to the eventual correction after a big run.
Resistance:
R1: The R1 orderblock at the recent swing high and all-time high is the only identifiable level of resistance for Apple. As the only current level, it'll be important for the bulls to break this one and find support on top of it.
-----
Summary:
There are two likely paths for Apple.
One path we see the bulls quickly take out the all-time high and then find support on top of previous resistance.
The other path we see a continuation down, likely after a rejection of R1.
The path downward becomes more likely if the virus fears ramp up, as without fear it is hard to see why investors aren't rushing back into Apple.
Resources:
www.cnbc.com + www.cnn.com + www.npr.org
✨ Drop a comment asking for an update, we do NEW setups every day! ✨
