MICROSOFT | BUYis there will happening any event or device presentation?
May new generation of Surface lines or Smartphones ;)
Microsoft

Microsoft large cup and handleMSFT has formed a large cup and handle
I expect the cup to land a trendline that extends to 1988
This is the best spot for a long entry

according to ichimoku stay buyeraccording to ichimoku stay buyer but beware not much volume. the next big volume be take the profit or continue

Watching Microsoft in the CrisisI've been watching Microsoft as the market has sold off.
Microsoft has Xbox
Cloud
Teams
Excel, Word, etc
Skype
They are one of the few tech companies that actually appear to be decently positioned for a work from home transition. Their market cap is still over a trillion.
I would not buy here, I just think the story is interesting and worth watching if you can catch a very extreme dip downward. This is still just a "blip" in its timeline.


MicrosoftLooks like its struggling under Resistance. I'm not to big on trading stocks but I figured I'd analyze it anyways. I would definitely sit out of this if I was spot trading. Could short here, but ultimately the short has been effect for a while now. Drop what ticker you want me to review next, any market. Thanks!

Weakness on Microsoft, the second seller wave is coming?I recommend to short the Microsoft title or get rid of this from the portfolio


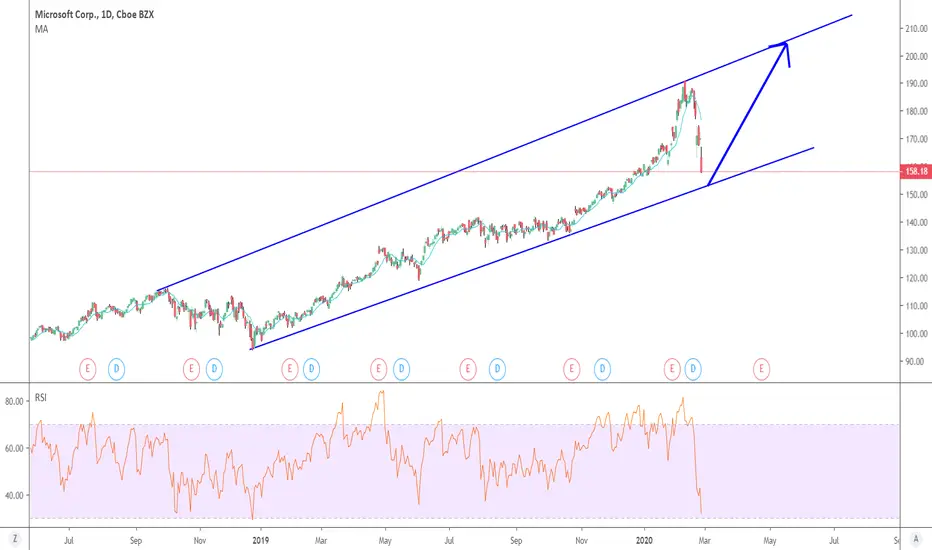
Hold onto your seats... Critical point for MSFTLet's see what happens Monday/Tuesday in the markets. MSFT is still up 26.7% in the last year (despite Coronavirus selloff) - it should not be considered cheap with current P/E ratio: 26 (down from P/E ratio: 32 in February). Terrific company with a lot of prospects going forward but there is much better value to be had elsewhere in the market right now. MSFT is not immune to the Coronavirus fallout - they've revised estimates and admitted supply chain problems which will continue to affect the company through the end of the year. Be patient with MSFT, we may get a better buying opportunity soon. HOLD OFF AND LOOK FOR BUYING OPPORTUNITY IN THE NEAR FUTURE

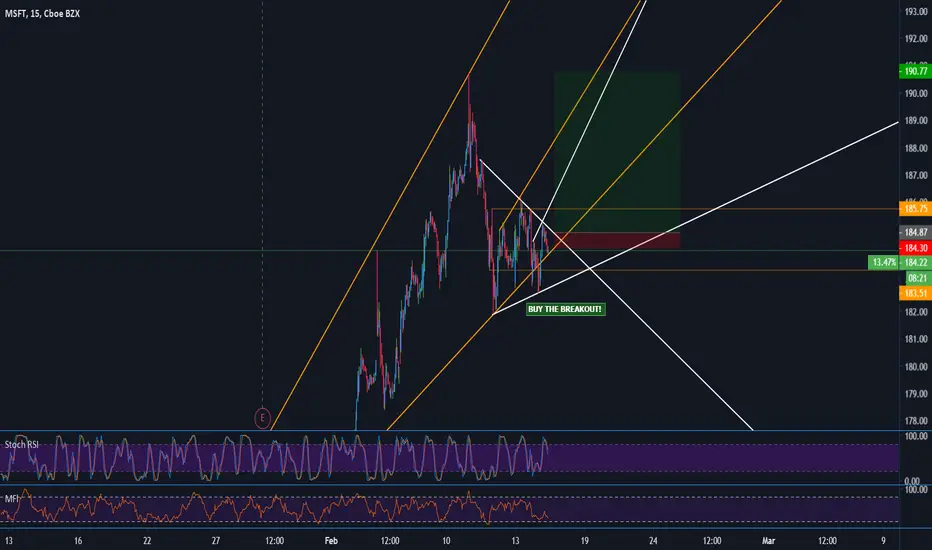
Microsoft (MSFT) Catching Pullback!
hey guys,
please, note that my trades are purely based on technical rules
and there is no need to tell me how dark is the current fundamental sentiment!)
I noticed this bullish breakout on Microsoft!
we see a retest and a positive market reaction!
I believe that the chances are high that the stock will grow in value!
targets: 163/173
good luck!
please, support the idea with like! thank you!

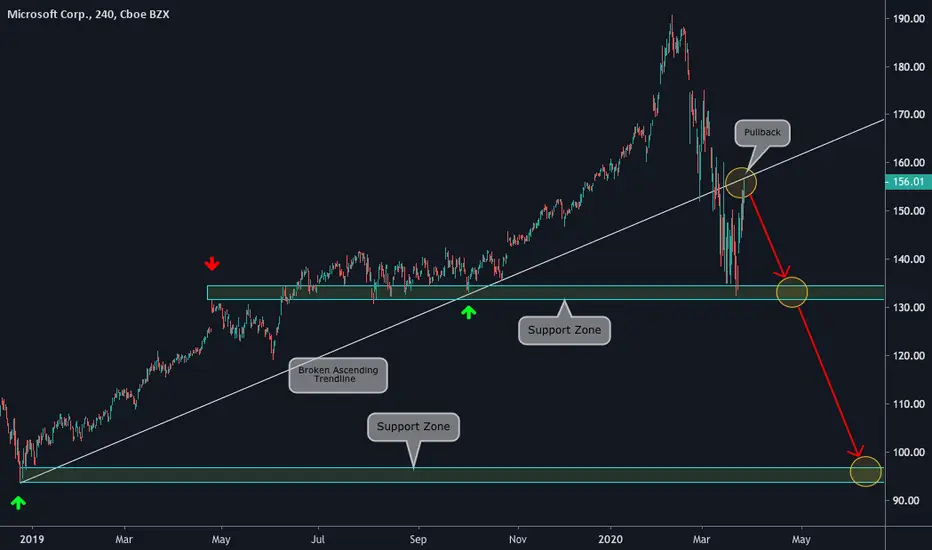
"Microsoft: pullback and the down move continues"4H Chart Explanation:
- Price broke the Ascending Trendline.
- It went down towards the Support Zone and bounced from there, developing a pullback.
- Now, price has potential to move down towards the Support Zones.
- We are looking for sell setups on lower timeframes.
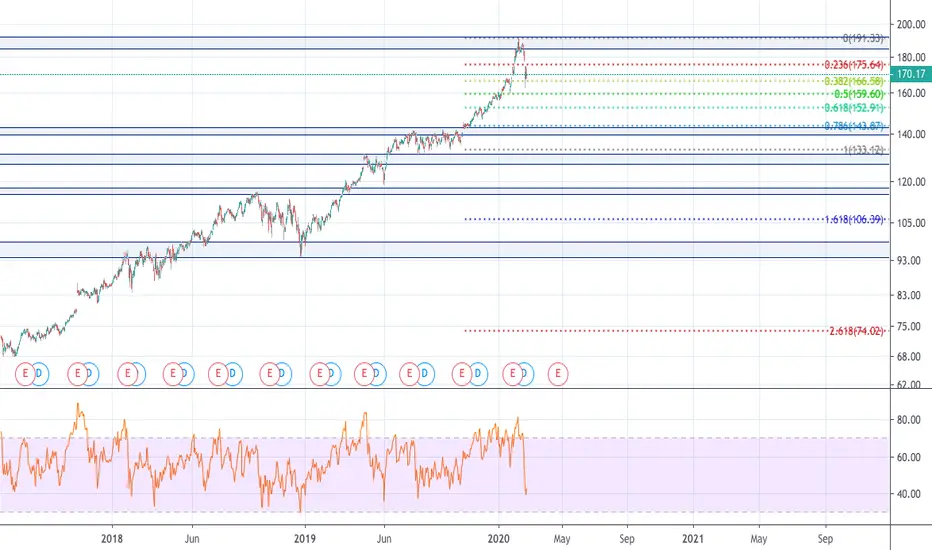
Weekly Vision:
Daily Vision:
Updates coming soon!
Long MSFT during COVID-19 Outbreak - Long-TermLong Microsoft ($137.35) after getting beaten down by the coronavirus. Positive outlook after the economy figures itself out. Resistance at $135 and been jumping between 135-148 the past week and a half showing its strength against macro effects. This creates a safe entry position between $135-$148 per share. Or could consider waiting until McGinley Dynamic 20 & lines cross again as a more confident indication of an entry point.

Back problems for $MSFTNASDAQ:MSFT
By starting the median line at a low point in December of 2018, you can see Microsoft continuing on an upward pattern through the first half of 2019. Then in August 2019, it seems $MSFT ended up with a bulging disc. It ran right out of Andrew's pitchfork, then it circled around until popping back into the channel on February 4th.
Why the heck did it do that? I have no idea.
Regardless, with government investigation into MAGA, $MSFT is back on its path.

Microsoft hidden bullish divergenceWeekly chart, first off this goes against my case for a depression however I believe tech stocks will prop the market up during these rough market conditions, which is congruent with another one of my previous analyses. The divergence is hidden as RSI shows lower lows while price maintains higher highs, a parabolic move can be seen on MSFT if this continues it may lead to a bearish divergence on the RSI. Best move is to buy here and sell at $160-165 for short term profits, or just go long lol.

"Microsoft: a Bearish Vision" by ThinkingAntsOk4H Chart Explanation:
- Price broke the Weekly Ascending Trendline.
- After that, the down move started.
- Currently, price is on the Micro Support Zone.
- We expect price to develop a correction before continuing the down move.
- We are looking for sell setups on lower timeframes.
Weekly Vision:
Daily Vision:
Updates coming soon!

Bill Gates V Donald TrumpI declare the American President Donald Trump be the winner of this bet against Microsoft co-founder Bill Gates. NOT ADVICE. DYOR.

MSFTTF: D
Looking for retracement and buys around 140 to 150 levels. It'll take some bouncing around and time, but I do think we could see a deep retracement before continuing higher due to global uncertainty and negative impacts surrounding the Coronavirus.
MSFT - weekly view - have clear signals for buying calls or puts*** Please see notes on chart. This is an example similar to many other stocks. The monthly and weekly charts show more downside is possible, and stock has not yet touched 200sma on daily.
*** Compare today's closing price with the 2/27 close, and check RSI and stochastic for bullish divergence. Look for RSI to cross above 50 on 30m chart and trendlines to turn upward. Short term call (or long) opportunities may arise. Otherwise bias is for puts, so you are looking for entries on 15m and 30m charts (like RSI touching 50 and going lower, price turning lower at 20sma, stochastic below RSI).
*** Look for engulfing candles, hammer and inverted hammer, or 3 candle patterns that indicate a change or continuation in price trend.
*** Volatility spike has made options expensive, and IV change from one day to next will affect your profit/loss. Be firm about targets and stops, and if holding options overnight then use very little capital. Again, use multiple time frames to confirm a good trade setup.

MSFT - Great entry point for longMicrosoft is at the bottom of the channel and looks like a great place for long position.
MSFT monthly candle is set to be a shooting starLast month was the 6th time in SP500's history that it was closing with a monthly shooting star candle. This month it's #MSFT's turn

Alex Vieira Sells Microsoft 2 Million Shares $190 from $38Alex Vieira Sells Microsoft 2 Million $190 from $38. Refer to previous free chart trimming $185

Microsoft Corrects | Bottom Of ChannelGood afternoon traders, If MSFT can hold its correction back into channel we should see some nice positive movement. This move down was mainly due to the JEDI ruling which learned toward Amazon. Quick TA, Please share your opinion, always love to hear!
DotcomJack
(I'm not a financial advisor... blah... blah.. I'm not providing financial advice..
BILL ACKMAN, JOHN PAULSON & SARAH KETTERER UPS STAKE IN VIAC Here's yet more BULLISH news for VIACOMCBS (VIAC)
We feel along with several other large institutional investors that VIAC is DIRT CHEAP!
News Releases..
www.benzinga.com
www.gurufocus.com
DISCLAIMER
This website and our posts are for general information only. No information, forward looking statements, or estimations presented herein represent any final determination on investment performance. While the information presented in this website and our posts has been researched and is thought to be reasonable and accurate, any investment is speculative in nature. StockKid, and/or our agents cannot and do not guarantee any rate of return or investment timeline based on the information presented herein.
By reading and reviewing the information contained in this website and our posts, the user acknowledges and agrees that StockKid, and/or our agents do not assume and hereby disclaim any liability to any party for any loss or damage caused by the use of the information contained herein, or errors or omissions in the information contained in this website or our posts, to make any investment decision, whether such errors or omissions result from
negligence, accident or any other cause.
Investors are required to conduct their own investigations, analysis, due diligence, draw their own conclusions, and make their own decisions. Any areas concerning taxes or specific legal or technical questions should be referred to lawyers, accountants, consultants, brokers, or other professionals licensed, qualified or authorized to render such advice.
In no event shall StockKid, and/or our agents be liable to any party for any direct, indirect, special, incidental, or consequential damages of any kind whatsoever arising out of the use of this website, our posts or any information contained herein. StockKid, and/or our agents specifically disclaim any guarantees, including, but not limited to, stated or implied potential profits, rates of return, or investment timelines discussed or referred to herein.
