microsoft long idea by bluepiplong in levels and following price...
leave your like and comment's about my analyze on the posts ....
Microsoft

MSFT Short Opportunity after Pre-market pushApple is looking to regain market cap from Microsoft after its 6 month rush. apple look to release new iphone priced at 399
Major company moves have been done by apple with many new products that came out so recently and many to come that are new to apple completely. Earning coming out soon with apple ready to beat exceptions setting up to break all times high
Sell entry 1 $142.00
entry 2 $144.00
sl 146.00
tp.1 $140.00
tp.2 $138.00
tp.3 $136.00

NAS100 2500 PIP Move Loading!!!Interesting times ahead for the price action of NAS100. Do not trade with money you cant afford to lose.

What is the next move for MSFT?Microsoft with some choppy action over the past month. It definitely ended in an interesting spot on Friday providing a case for both the bull and bear side. Would wait to see what kind of trend develops before taking a bull or bear position.

MSFT: Ready to correctChart self-explanatory. Connections have been averaged with step-line over linear for higher precision.

EROS a mid-to-long-term gap fill candidate with earnings Oct 8EROS is a Bollywood production company making big moves to try to dominate India's booming streaming market. Eros recently went on a 200% run after signing several major streaming contracts, including a deal with Microsoft to stream Eros content on the Azure platform. The stock price then cut in half as it first pulled back from overbought territory, then broke down even further on news that the company took on a $27.5 million debt due in 2020.
(This is something that often happens after announcement of a new product offering: the stock price initially shoots up, then breaks down on news of a new shares or senior notes offering to raise capital for manufacturing or marketing the new product. Shorting cash-poor companies after a big product announcement runs up the stock price wouldn't be a bad strategy.)
Anyway, for the moment Eros has found a floor around 1.80. It has support from there all the way down to about 1.14, with the strongest support nodes around 1.65 and 1.32. This is a decent time to take a small position for a mid-term swing. The stock is likely to get further news boosts as it implements its streaming deals and launches its content on the various platforms.
One short-term risk is the earnings report on October 8. Eros is reporting earnings later than usual, which often bodes ill for earnings results. (Late earnings tend to be worse than expected, whereas early earnings tend to be better than expected.) If Eros's earnings miss, the stock is likely to break down to one of its lower support levels-- perhaps even the very bottom of the support range. I would look at that as an entry opportunity. So if you do take a small position now, save enough cash to at least triple the size of the position after earnings if the price breaks down.
In the event that Eros beats earnings and/or begins to run up again on implementation news, it's got plenty of room to run. 3.00, 4.00, and 5.00 are all conceivable in the mid-term. In the longer term, this stock has the potential to break out above 5.49 and then very quickly fill the gap up to 7.23.
(For weekly news and educational videos, check out my new YouTube show, Wall Street Petting Zoo!)

Microsoft Push Tech Stocks Higher Amid Trade WorriesPreviously, the mounting of U.S. tech stocks was recorded. The gains in Apple, Microsoft, and Merck & Co occurred when investors set aside doubts regarding the U.S.-China trade dispute.
Shares of Apple Inc grew 2.4%. The increase was after sales of the company’s newest iPhones were off to a robust start. The information was according to Chief Executive Officer Tim Cook that he then stated in a German news report.
Meanwhile, JP Morgan elevated its forecast for shipment volumes.
In fact, Apple is battling to shift its shrinking iPhone sales amid dull global demand for smartphones.
The rise of 0.9% in Microsoft Corp., together with the S&P 500 technology index also buoyed stocks.
However, sentiment on Wall Street got an additional improvement after White House trade adviser Peter Navarro discharged reports.
The report was in regard to the Trump administration considering of delisting Chinese companies from U.S. stock exchanges as “fake news.”
On Friday, fears related to those rumors had sent the S&P 500 and Nasdaq to a more than three-week low.
The Different Impacts of The Trade Dispute
Chief executive officer of Ladenburg Thalmann Asset Management in New York, Phil Blancato, said, “This idea of using different types of levers that impact trade negotiations is something that we will get accustomed to.”
On the other side, U.S.-listed shares of Chinese companies Alibaba Group Holding Ltd and Baidu Inc increased 0.8% and 1.5%, respectively.
In October, the schedule of the next round of high-stakes trade talks between the world’s two largest economies will take place.
So far this year, Wall Street’s main indexes are on course to end September with the weakest quarterly performance. They were rattling due to a multitude of factors, including an increase in U.S.-China trade strains.
The Dow Jones Industrial Average grew 0.36% to end at 26,916.83 points.
Meanwhile, the S&P 500 also added 0.50% to 2,976.73 with the Nasdaq Composite that has improved 0.75% to 7,999.34.
For the month, the S&P 500 gained 1.7%, the Dow gained 2.1%, and the Nasdaq rose 0.5%.
For the third quarter, the S&P 500 and Dow inched up 1.2%, while the Nasdaq curved in 0.1%.


MSFT : Careful on the price action within the next weeksHope this idea will inspire some of you !
Don't forget to hit the like/follow button if you feel like this post deserves it ;)
That's the best way to support me and help pushing this content to other users.
Kindly,
Phil

MSFT Compression Attempted Breakout FailsMSFT has been in a tightening compression pattern that failed to break out and maintain a higher price. The stock has been under heavy Buyback mode over the past several months. Dark Pool Quiet Rotation™ continues.


Ascending triangle on Microsoft, could make new highs soon.MSFT has been forming this ascending triangle pattern since early August, with a series of higher-low's and a relative flat line of resistance around 139.50 or so. Measured move of the break-out would put the price at around 147.50.
-This is not financial advice. Always do your own research and own due-diligence before investing and trading, as for investing and trading comes with high amounts of risk. I am not liable for any incurred losses or financial distress.
Also, for any crypto traders out there, Binance just launched their US exchange (Binance US.) If you need a link to go sign up, click here--> www.binance.us

Microsoft 40 billion buyback Market moving news
Microsoft just approved a 40 billion dollar buyback. They are also raising the dividend by 11%.
Technical analysis
Reaching all highs on above daily average volume.


Microsoft 1700 PIP MOVE COMING IN!Get ready for the Microsoft 1700 Pip Move lining Up. Do not trade with money you can afford to lose.

MSFT Microsoft 30 Minute Trends
Trade tweets effect price on August 1st, has recovered since then and could surge again on potential trade progress


MSFT - Microsoft up trend. Time to buy?In my opinion, the share price of Microsoft will rise slow and safe until earnings reports.
I think it is a good time to buy.
What is your opinion?

Microsoft updateThe right shoulder finally finished. Now testing the trend line. Hold the shorts and wait to add on the retest of the green buy zone as we pullback and sell more at the high of the pullback.
Shares across the board start showing reverse patterns on daily and weekly time frame. Could indicate that the recent indices rally won't last and will reverse soon.
Good Luck!

Downside Risk For Microsoft Is AstronomicalMSFT is one of the only tech stocks that has made a significant higher high since the December 2018 selloff. I posted a short trade setup back then, suggesting that it would be unwise to short until the recent low was breached. Indeed, MSFT defied my original expectations and headed up, even breaking new highs. Due to this, it is one of the assets that is furthest away from its parabolic trendline on the linear chart. You can see Netflix very close to breaking down right now:
On the logarithmic chart for MSFT, we can see that it has held a parabolic trendline (purple) since its inception! That's CRAZY.
Here's where it is currently (right in the 118 area):
If the stock market continues its slide, I think we can expect Microsoft to at least test its own uptrend line again. If that breaks, I think it will likely enter free-fall mode. I have the opinion that most equities are not truly valued much above 2008 levels. This means that many could retrace the entirety of their gains from the last 10-15 years. The lowest bearish targets may not be reached, but they remain a distinct possibility, and I think investors should prepare for this scenario. If we do finally see some major breakdowns, I'd like to observe the market's reaction at higher support levels before blindly assuming further downside. Supports are outlined on the above chart.
This is not financial advice! Purely my opinion and should be only used for educational/entertainment purposes.
-Victor Cobra

$MSFT in a huge ascending wedgeThis has been a pattern playing out for the entire year of 2019, and looks like in the next week or two it could start playing out. IF this happens and we see sub $120 prices no problem. Also, take into consideration that there's a bearish divergence on the RSI, higher highs in prices but lower highs on the indicator.

#MSFT Microsoft, are you buying? I don'tThe last Earning Report was successful and surprising because they bit the forecast by 0.50. The stock is up 36% YTD, but while the markets are shaken by idiosyncratic and systematic risk, Microsoft is trying to bring the chipmaker NVDA technology to give Minecraft a graphic overhaul. Well, I don't play Minecraft but my 8-year old son loves it, so he's going to be my advisor this time. What does he say? "Cool, that would be great, however, it's not possible to see good results in the near term because usually, the graphics depend on the computer you're working with. In case if I want better graphics, I can always get some new texture packs".
Learn how to beat the market as Professional Trader with a Prop Trader!
Last 5 seats, Be part of an Elite Trading Group.
Have a Nice Trading Week!
Cream Live Trading, Best Regards!

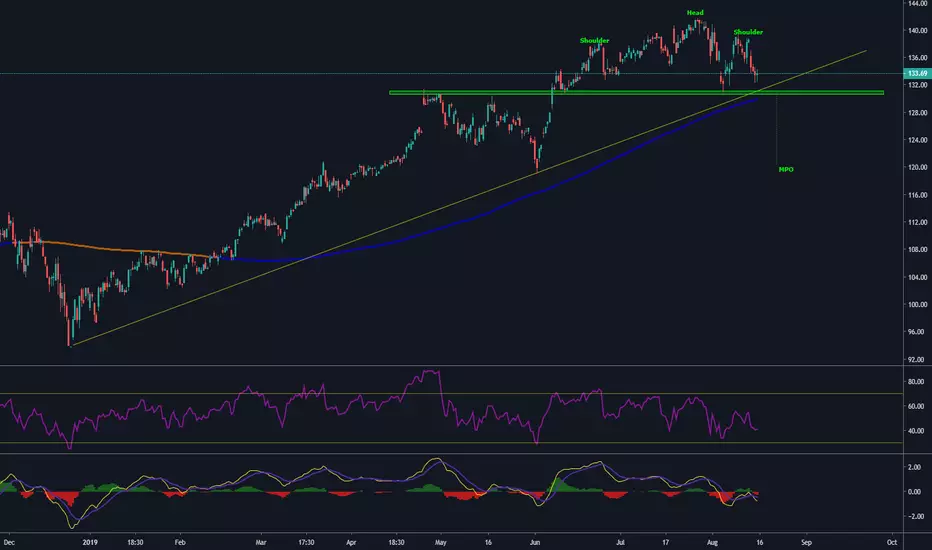
Microsoft head and shoulders patternChart analysis shows H&S pattern forming with divergence on both MACD and RSI. MPO target $120 support area and 200SMA on a daily chart (see in comments). First needs a good break through the trend line and 200SMA, quite strong support area around $130 level. If the market sell off continues next week, it could be the trigger for the pattern.
On the fundamental side major banks and investment funds see the stock as 'neutral-buy' and split price targets ranging from $115 to $160. Good Luck!