Microsoft Bullish Flag Breakout We see that Microsoft had formed a bullish flag due to profit taking resulting in lower prices as traders sell the stock. However prices broke out of the bullish flag as prices bounced off the long term downtrend line from the beginning of Oct 18. Therefore we expect Microsoft to continue it's uptrend so we remain long the stock and await the earnings announcement on the 24th of April.
Microsoft

Microsoft Forecast D1hi guys ,Stocks Like Mircrosoft are one of the best assest for buy and hold stretigy or random walk theory !

MICROSOFT - 4h short the breakdownForming flat corrective pattern - either expanding or running flat.
Looking for shorts for the C wave down

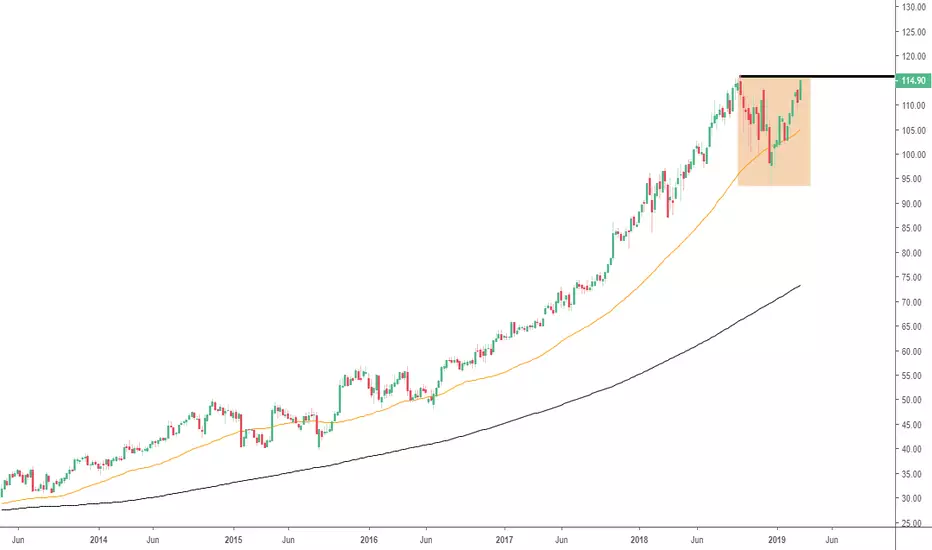
Microsoft Testing Major SupportLast post: March 14th 2019. See chart .
Review: Price was approaching a major resistance level.
Update: Price has since broken through the major resistance level and now using that level as support.
Conclusion: We have to wait and see if price will break above the previous high to confirm a continuation of the previous uptrend.
Any comments or questions, do not hesitate to leave them below. Give us the thumbs up if you share our sentiments!
Sublime Trading

MICROSOFT - BLUE STOCK OF DEATH INCOMING :(We are slowly in the end zone of the ABC retracement up.
Currently we are undergoing the C wave, within that we have 5 waves.
There is two bearish scenariosus here: While the 3rd wave didnt go above the 1.618 we could think that the 5th wave could be extended to 2.618 (120 USD)
We could also drop here from the 2. to 2.272 extension. due to the RSI making 4 double tops on the 4H, which i would say is the most likely scenario.
note: The red box is the sell area.
Take profit for this short term short would be at 106 USD, if it breaks that we would go to 98,5 USD next.

Microsoft Analysisjust randomly searched up Microsoft on the chart and this jumped out at me straight away..
with price at these levels in supply im looking at a weak MSFT even bearish the whole market.

Microsoft On The Verge Of Breaking OutThis stock is featuring for the first time on our TradingView blogs.
Current setup: Price is approaching a major area of resistance
Conclusion: If price manages to break and close above resistance, we may see a big trend unfold to the upside.
Any comments or questions, do not hesitate to leave them below. Give us the thumbs up if you share our sentiments!
Sublime Trading
MSFT Reaches My Double Top Target...Now What? Just a brief analysis. There is a possibility that the market will rally higher and that we will see a blow off top, but the DJI has found pretty substantial resistance again above 26000 so we may be about to see the true initial drop of an incoming recession. The December drop was merely the start, and subsequent rally was constructed so that people have another chance to protect their capital.
In my last MSFT chart, I suggested there was a possibility for a double top if the recent low couldn't be taken out by the bears. I provided the target for this second top (somewhere in the 110-112 area). If we are to follow this setup, we should see a big drop soon. However, if we build support here and move higher, this idea will be invalidated. Looking at the log chart, once the purple uptrend is broken, we will probably see a much deeper selloff. As you can see, there are some fairly low targets.
Things don't necessarily have to play out this way, but I think we need to see some growth slow down, so we can deal with bigger issues as a society (like the environment, for instance).
Not financial advice. This is my opinion based on what I'm seeing in the market.
Link to previous MSFT analysis at bottom.
-Victor Cobra


Microsoft Could Be a Great BuyThe Megalodon indicator recently gave us not just a buy signal, but a strong buy signal. It'll be important to watch for Microsoft's earnings at the market close on Wednesday. Definitely keep this on your watchlist. For information on how to use the Megalodon indicator for yourself, just send me a message!


Microsoft Down Trend ? 4HThis is for the stock traders, maybe a possible down trend on Microsoft however with it being a company in the technology sector i would be careful as a new product or software could significantly change this.

MICROSOFT CORPORATION (MSFT): Inevitable Correction On The WayFind Winning Trades In Seconds >> efcindicator.com (Special Discount)
Microsoft started the correction after a sequence of strong impulse waves. This kind of correction is healthy and necessary.

MICROSOFT - MSFT - BAT PATTERN- DAILYHi, have a check on the Chart.
the stock is setting up for BAT pattern.
Long position - 90.61
Stop Loss - 86.00
take profit - Target 1 - 100.48
take profit - Target 1 - 106.53

Bearish Targets for MSFT (Microsoft)Here's another bearish tech analysis. This one is brief. It's pretty clear what the setup is. Either we have a double top, or we drop from here. Either way, once we drop below the recent low of around 93.67, we will most likely head straight down towards my target at the red "X," between $50 and $57. That's the only support level we have below. What's pretty scary is that if it heads to that target, the log trendline will have been breached, and MSFT can actually continue its decline to the next green support zone. Looks like a pretty obvious bubble here.
The log graph for MSFT looks especially bad, with the log uptrend line lying so close to the current price (currently in the $60 zone). As soon as that purple line breaches, we'll likely be in free fall.
This is not financial advice. I'm just posting these charts to see how accurate (or inaccurate) I am in the coming years. I could be very wrong, and I'm not a professional by any means. This is simply what I'm seeing in the charts. I wanted to do a few for the major tech stocks to see if I can get close to the bearish targets if and when the real bear market starts. People might be wondering why my targets are so low. It's simply that people are not buying tech as zealously anymore. People are satisfied with this current level of innovation, and are finally feeling buyer's exhaustion. If not enough people want to buy, then the price drops. I wrote a more in depth analysis on my DJI chart (linked below)
-Victor Cobra

Microsoft (MSFT) MA CrossoverDespite finishing the year as the world's largest company (779.80B), Microsoft $MSFT appears to be in for a bearish 2019.

MSFT Bear FlagMicrosoft double top RSi rounding down. 5sma rounding down at top of bear flag channel resistance.


$NVDA chief casualty of epic Nasdaq fall, worst then $AAPL $FB Autumn leave Nvidia with less than half of market cap!

Microsoft: $115 Price ShortMicrosoft is nearly as valuable as Apple market cap-wise. The price correlation between November 16th until now seen some outmost positive growth. Even with some slight negatives from today, you can expect a very soon price target of $115. Also expected is Microsoft to rally past its 52 week high as a company. While, Microsoft isn't on my portfolio, it still shows market growth potential just looking at the basic trends.

MSFT Bounced Off Support, Potential Rise!MSFT bounced off its support at 11.63 (100% Fibonacci extension, 50% Fibonacci retracement, horizontal swing low support) where it could potentially rise to its resistance at 109 (76.4% Fibonacci retracement, horizontal swing high resistance).
Stochastic (55, 5, 3) is testing its support at 18%.
