Nasdaq - A Black Friday Blowout Sale?Using the SPX as a reference for ease of use, at the beginning of the November rally I asked whether or not manipulation would come after we saw a 5% rally in 3 days just because the U.S. Treasury decided to spam bonds at a lower, but still already highly inflated, rate in Q4 than they did in Q3.
SPY - Did We Bottom, Or Is Manipulation Coming?
The week before last, I cautioned bulls who believe in the "Santa Rally" thesis that we may just see sideways and manipulation back down with the end of year target being merely 4,600 and not 4,900.
SPX - Santa Ralliers: You Better Keep Your Eyes On The Clock
And for the record, I haven't cared about this rally because I haven't had a position, since there was never a retrace I never went long and shorting has looked bad, and turned out to continue to be bad.
But Friday the 17th marked the monthly Options Expiry (OpEx), and we predictably spent the day sideways. The next week ahead is U.S. Thanksgiving on Thursday, where the markets will be closed for the last time before Christmas, and then Black Friday the day after.
Although there is little news drivers this week, except for Employment on Wednesday and PMI on Friday, I posit that since the Nasdaq set a double top with its July high, we may very well see a 1,000 point "Black Friday blow out sale" this week that sets up a December rally that takes out the All Time High.
Keep in mind after this week, starting with "Cyber Monday," we still have four trading days to complete the November candle, and so we most certainly can dump an awful lot and rally an awful lot to finish the month some 2 or 3% away from where we closed on Friday.
The dangers in the markets are exceptional at the moment, however. Xi Jinping visited San Francisco for the climate theatre conference, where he met with the Biden Administration.
What this event indicates to us is that the International Rules Based Order is extending Xi, who is a Chinese nationalist, an olive branch to cede his control of China and form a critical hub in the coming One World Government.
But the IRBO has never been so intelligent as to understand that it cannot out maneuverer the Red Dragon of the Chinese Communist Party, for the Devil Red is a scourge who has come to ensure that humanity and all of its related souls are totally annihilated.
At the root of the conflict is the 24-year persecution of Falun Dafa, originally started by former Chairman Jiang Zemin on July 20, 1999. The campaign has targeted 100 million spiritual believers, even going so far as to commit the unprecedented sin of live organ harvesting.
Although Xi has been killing the Jianglings for more than a decade in his Anti-corruption Campaign, Xi is still the head of the CCP, the Red Dragon and Destroyer of Worlds, and this is a problem for him that he will either solve by overthrowing the CCP in a coup Gorbachev-style, or Heaven will solve it for him by sacking the Emperor's Bedroom in Zhongnanhai and Beidaihe.
For the IRBO, the problem the whole world faces is that the supposed "International Police" (and its Wall Street financial vanguard) have been staining their hands sanguine crimson with the Jianglings in Shanghai-Babylon all these years.
The sins are so extremely massive that they can never be fully paid for, and they still aren't doing their part to wash their hands and social distance from the Devil Red.
Instead, they're doing everything they can to expand the CCP's Zero-COVID Social Credit system worldwide.
And this is going to cause a Dark Winter for humanity. When that day comes, your indexes and your memestocks, your "Magnificent 7," even, will all trade like crypto dumpstercoins because no market making algorithm will be available to pump and dump, and at the same time everyone will be desperate to sell, with no buyers available.
But the good news is that when that day comes, you won't be paying attention to money anymore. Instead, what is unfolding in this world will be the only thing notable, and you won't have any interest, or any need of, following CNN and NYT and Xeeeeeeeeeeter for updates.
The information will come from a combination of your own eyes and another platform, one pure and clean.
Lord Jesus once told his followers: "Whoever has eyes, let them see. Whoever has ears, let them hear."
The blind and the deaf will be culled, and such is the nature of the trial all souls face.
Microsoft

Microsoft (MSFT) Hits All-time High After Hiring Sam AltmanMicrosoft stock reached a record high on Monday after the company said that Sam Altman, former chief executive of OpenAI, will join the company to head its artificial intelligence innovation leg.
Shares of the tech behemoth rose 2.1% to an all-time high close of $377.44 on Monday, beating the previous record of $376.17.
That comes after shares of Microsoft fell 1.7% on Friday, when Sam Altman was ousted from his position at OpenAI in a boardroom coup. Microsoft is the artificial intelligence firm’s biggest stakeholder, with a $13 billion investment in the company.
Technical Analysist
Price Momentum
MSFT is trading near the top of its 52-week range and above its 200-day simple moving average.
What does this mean?
Investors have been pushing the share price higher, and the stock still appears to have upward momentum. This is a positive sign for the stock's future value.

📉 Dow Jones Sees Downturn as Microsoft Tumble Shakes Markets 📉Today, the Dow Jones Industrial Average took an unexpected hit as the market witnessed a significant drop, largely attributed to a substantial decline in Microsoft's value. 📉💥
Microsoft, a tech behemoth, has long been a cornerstone of the stock market, but recent fluctuations have sent ripples across various sectors. The company's declining value has triggered investor concerns, reflecting broader anxieties about the tech sector's stability. 💻📉
This dip in the Dow Jones emphasizes the interdependence of major corporations within the index. Microsoft's stumble has highlighted the fragility of market sentiments, sparking discussions about the impact on the overall economy and the tech industry's health. 🔍💼
While this sudden descent may stir uncertainty, seasoned traders see it as an opportunity to reassess portfolios, recalibrate strategies, and identify potential market shifts. Keeping a watchful eye on both tech sector developments and market sentiments will be crucial in navigating these turbulent waters. 🌊📈
Stay tuned for further insights and analysis as we continue to monitor this evolving situation. Remember, in the world of trading, adaptability and informed decisions are key. 🚀💡
#DowJones #MarketUpdate #Microsoft #TechSector #StockMarket #Investing"

MSFT Soars with the Arrival of Sam Altman from OpenAII wanted to share the latest development that has the potential to spark a remarkable surge in Microsoft's stock value.
Imagine the possibilities that await as MSFT makes a strategic move by hiring none other than Sam Altman, the renowned technology visionary behind OpenAI. Altman's groundbreaking expertise in artificial intelligence (AI) and his impressive track record in shaping the future of technology make this an exhilarating moment for all MSFT investors.
With Altman on board, MSFT is set to revolutionize the tech industry and solidify its position as a leading force in innovation. The integration of his visionary mindset, coupled with Microsoft's already sterling reputation and enduring commitment to evolving technology, heralds a significant opportunity for continued growth and groundbreaking achievements.
In light of this momentous news, I invite you to join me in seizing the potential for substantial gains as MSFT aims to hit unprecedented highs. Now is the time to act and position ourselves for a profitable long-term investment opportunity. I strongly encourage you to consider taking a long position in MSFT, as this could be a game-changing move for your portfolio.
Let's ride the wave of this incredible development and harness the power of Altman's expertise and Microsoft's unwavering dedication to reshaping the tech landscape. By investing in MSFT today, we have the chance to participate in a remarkable journey towards new horizons of success.
Don't miss out on this investment opportunity; the potential for incredible returns is within our grasp. Position yourself for success by joining me in going long on MSFT and embarking on this exciting venture together.

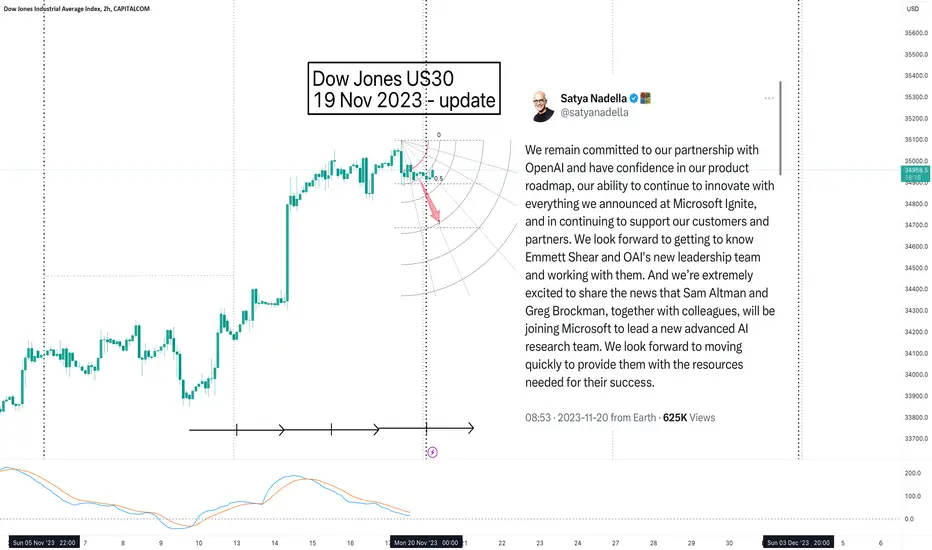
Microsoft Hires Sam Altman And Greg Brockman For New AI TeamMicrosoft CEO Satya Nadella hires OpenAI's ex-CEO Sam Altman and ex-president Greg Brockman for its new advanced AI research team.
Microsoft officially hires OpenAI’s ex-CEO Sam Altman and ex-president Greg Brockman to lead a new advanced artificial intelligence (AI) research team. Microsoft CEO Satya Nadella made the announcement after OpenAI confirmed hiring Twitch co-founder Emmett Shear as interim CEO. The company will continue to have investments in OpenAI, while getting to know Emmett Shear and OpenAI’s new leadership team.
Microsoft Hires Sam Altman and Greg Brockman
Microsoft CEO Satya Nadella took to X on November 20 to officially announce hiring of former OpenAI CEO Sam Altman and president Greg Brockman. They will lead a new advanced AI research team.
Nadella said the company remains committed to partnership with OpenAI and has confidence in the product roadmap. He added “our ability to continue to innovate with everything we announced at Microsoft Ignite, and in continuing to support our customers and partners.” Microsoft will look forward to getting to know Emmett Shear and OpenAI’s new leadership team and working with them.
This is a very good move from Microsoft (NASDAQ: MSFT) because we can not overemphazised to the fact that AI is the gateway to web.3.0. Any company leveraging AI for its services and products is a good company to invest in, because in the long run it will succeed.
Technical Analysist
Price Momentum
MSFT is trading near the top of its 52-week range and above its 200-day simple moving average.
What does this mean?
Investors have been pushing the share price higher, and the stock still appears to have upward momentum. This is a positive sign for the stock's future value.

I have no open positions. I want to see how DJI responds to thisThe top minds of OpenAI are now at Microsoft...
This is about to get crazy
I would rather trade the aftermath of this next move instead of get wicked out by the initial volatility
Is ETH about to breakout? Is Crypto going to do a Microsoft?Eth has yet to breakout of base
Being the leading ecosystem it is somewhat surprising Eth has yet to breakout of the base formed tho it does offer a potential opportunity. If Eth can run then it has a few open bar candles on the weekly that would be ideal to close out.
The rotational opportunities if holding eth post eth breakout are great
If Eth breakouts of this base then many smaller coins (esp eth based) are likely to continuing moving up. So the opportunity to compound eth profits by rotating post breakout is grand. This opportunity is not as highly provided to those who just hold the smaller caps that are waiting for either a btc or eth breakout.
MSFT makes up 1/4 of the big4 tech companies that dominate S&P500
S&P500 and bitcoin are correlated so far. With MSFT leading the big4 tech companies and MSFT breaking ATH then it gives the impression there may be room for crypto to do similar things (should trend continue).

NAS100 – up 8 straight days & the chase is heating up We see the NAS100 up for 8 straight days, with price breaking the July downtrend and testing the 12 Oct swing high – a record closing high for Microsoft clearly helping. Naturally, we don’t see the NAS100 up for 8 days in a row too frequently, and since 2010 we’ve seen this run of form 32 times. It can be quite compelling to short a market having had such a stretch, but running the backtest I find if I bought the NAS100 on the 8th up day, 53% of the time I would rally for a 9th – in fact, five days later the index would be higher 65% of the time. Granted, in many of those years the US equity markets were in a bull market and pullbacks were buying opportunities, but it still suggests momentum favours the brave. Let’s not forget the NAS100 futures haven’t closed lower in the month of November since 2011 – although a 6.4% rally MTD is punchy.

Apple - Sick Fundamentals Mean a New All Time HighI have recent calls on the SPX
SPX ES - Welcome To The Fourth Quarter Rodeo
The Nasdaq
Nasdaq Futes - You Wanted a Dip For That 'Santa Rally,' Aye?
SPY
SPY - Did We Bottom, Or Is Manipulation Coming?
And Tesla
Tesla - Remember, The Ponzi Always Continues
Which generally have a bullish-into-year-end thesis accompanying them, but caution that an October bottom for the second year in a row and a mega three day rally to start November may be something of a trap.
When it comes to Apple, we have reservations that we topped under $200, for really obvious reasons, especially considering that on the monthly, the last three months of bearish price action haven't been that bearish.
Yet, because the weekly shows us that there are two bars under $150 and $140 from last year that never printed a low, that those areas are probably protected until Apple starts to seriously deflate and enter an end-of-life cycle bear market.
If Apple is going to enter an end of life cycle bear market, the MMs will 100% take out the $200 range and sell everything there first.
So, fundamentally, why would Apple be at the end of its life? The answer is simple: the company, all these years, wed itself to the Chinese Communist Party, which is the scourge of humanity, The Beast, and the benefactor to Babylon (Shanghai).
There's lots of really horrific data involving Apple numbers and the Chinese market right now, and the CCP under Xi Jinping is also rushing to replace other phone companies with domestic product, like the notorious Huawei.
The elephant in the room when it comes to cellular and computer purchases in China is that they're down because there are less people in China as a result of the enormous damage the novel pneumonia pandemic that originated in Wuhan City has caused.
SARS 1 in 2003 was covered up by the Party. The CCP made it seem like only a few thousand people died, when in reality, some accounts have stated that several million people died.
Today, the Party still claims that less than 122,000 people died from COVID-19, despite China being the epicentre of the disease.
You don't need an expert, or even a calculator, to figure out what's really going on and why the Chinese economy is in trouble.
What's at stake for Xi and his faction is the 24-year-long organ harvesting genocide and persecution against Falun Dafa's 100 million practitioners.
Although Xi has not participated in the persecution, and has, to the contrary, been killing via his Anti-corruption Campaign the Jiang Zemin faction who started and maintained the persecution all these years, the problem is that Xi is the head of the Party.
When you kill a dragon, you decapitate it. But first, you start with its tail. And it's telling that former Premier Li Keqiang died a few weeks ago, merely in his 60s, at the hands of "an heart attack."
So the fundamentals on Apple are bad because of China. So, with great faith in the principle of reversed logic, we actually look for longs with the chance to sell over $200.
But the charts, as they stand, are not giving us a long signal.
Everything, including Apple, bounced so hard in the first three days of November, and for Apple this came on the back of an earnings report, that we have to view the situation with major reservations, expecting that the candle painting of the low for the monthly bar has not yet been completed.
Last October, Apple pretended to bottom, pretended to double bottom in November, and then gave it all back and set the low of the year at the end of 2022, and all of this happened while the indexes had properly bottomed in October.
There was none of that "Magnificent 7" talk back then.
So, how to trade this? I think it's wiser to go long on a breakout over $183 in a size that allows you to take partials at $198, $205, and $215 than it is to have bought in the last three days.
And if we do dump, where we're looking for reversal patterns is at or below the April of 2022 low at $159.80~.
But if we're about to moon for manipulation, we're actually likely to see a sweep just below the current November low of $167.90.
So long as you can buy there without getting expired worthless on some short dated options, you'll have the best chance to ride the manipulation wave.
But be careful. When it's time for the CCP to fall, all the bigger dominoes go with it, because they're all really lesser dominoes.
Gap down overnight because of the time difference between Beijing and Manhattan means margin calls that scale in brutality, because Wall Street won't be in the mood to go risk on anything ever again.
Nor will it have the money or the breath to.

Tesla - Remember, The Ponzi Always ContinuesSo, you've realized that Teslas aren't particularly great cars, EVs becoming a worldwide trend is a hoax, and that Elon Musk isn't any kind of very saintly very MAGA saviour of humanity during the end times.
And now that price is down a lot, we want to victory lap and short, because the public relations firms that are running the campaign needed to produce liquidity for banks and big money funds to buy told you to.
The problem with the short Tesla thesis right now is that Musk pledged a significant volume of his shares as collateral to get big money to finance his acquisition of Tweeter, (now known as Xeeeeeeeeeeeeeeeeeter), which by some accounts is worth some painful $15 billion compared to the $45 billion he (they) paid for it.
And so what this means is that there's been significant incentive to sell in the $250 range and buy back lower as a form of risk hedging, with the ultimate purpose of selling higher.
All for the sake of just making all the money without losing any of the money when Xeeeeeeter inevitably goes public in the future because Musk made it the manifest Western form of the Chinese Communist Party's social credit apparatus, WeChat, because Shanghai Gigafactory bro just loves the way the Party does things.
But the risk for bulls, and the economic system alike, is that "the best laid plans of mice and men oft go awry," which is to say that when it comes to gambling on Xi Jinping and his Chinese Communist Party, a fool is a fool.
One should oppose the CCP because it's responsible for the 24-year persecution against Falun Dafa's 100 million practitioners, and the campaign of live organ harvesting genocide that came with it.
Although that campaign was launched, and continued, at the hands of former Chairman Jiang Zemin, and Jiang is dead now, Xi is still the head of the Party, and the first thing you do when slaying a red dragon is sever its head.
Actually, the first thing you do when slaying a red dragon is sever its tail. Former Premier Li Keqiang, who was Xi's right hand man for a lot of years, recently died "of a heart attack," which is likely code for "was knocked down by Wuhan Pneumonia."
If the pandemic in Mainland China is killing the Xi Faction, the world has big time problems.
And it seems to me the recent conflict in Israel and the war that's being launched into Syria and Iran is probably to create a gateway to Mainland China, since Iran connects to Pakistan and Afghanistan, which are already U.S. controlled.
Everyone wants control of China and its 5,000 year history when the CCP finally falls.
So back to Tesla.
The logic is fairly simple.
Because 2023 started uppy, we expect 2023 to finish uppy. We do not expect things that start the beginning of the year on a moon mission to correct into the end of the year, because generally speaking the scam isn't played like that.
Which means that all dips are a dip to buy, and especially when we're finally printing prices under "$200," it's a dip to buy.
But the MMs are the most annoying of the most annoying people and like to run things to lows that are less comfortable. Shipping under $180 from $197 is a further loss of another 10%+, which means options expire worthless/devalue effectively, and everyone is a winner, winner, chicken dinner, except for you, who gets to finance happy hour, strippers, and cocaine at 1:31 p.m. on Halloween Tuesday.
Either way, it's worth expecting the May pivot to hold as a low, a higher low to form, and then we really do see the $320 parade into the end of 2023.
Ho, ho, ho, Happy Santa Rally.
Remember, the Ponzi always continues. By the time the ponzi stops continuing, all the bears will have long since been liquidated. The disaster sequence is when they take down bulltards who buy the dip, buy the dip, and buy the dip as it races towards zero.
And Tesla doesn't have that MULN-style landslide apocalypse pattern. That only happens when big bags are empty and nobody ever buys something again.
So all the price action is just shareholder printer selling.
Yet.

Microsoft has 'first mover advantage' in 365 Copilot launchMicrosoft (MSFT) is set to launch its new 365 Copilot AI assistance — could this be the tech giant’s iPhone moment?
Price Momentum
MSFT is trading near the top of its 52-week range and above its 200-day simple moving average.
The price of MSFT shares has increased $0.46 since the market last closed. This is a 0.14% rise.
What does this mean?
Investors are applying buying pressure to MSFT shares today.

Microsoft Stock Jumps After Earnings Beat.Microsoft Stock Jumps After Earnings Beat. The Cloud Looks Strong.
Microsoft shares traded higher after the company posted better-than-expected financial results for its September quarter, aided by better performance than expected from the company’s cloud computing business.
The software firm posted revenue of $56.5 billion, up 13% from a year ago, and $2 billion ahead of Wall Street estimates.
Profits were $2.99 a share, well ahead of the consensus of $2.65 a share. Importantly, the company’s Azure cloud business grew 28% on a constant currency basis in the quarter, well above the company’s forecast for growth of 25% to 26%; on a GAAP basis Azure grew 29%. The company said Microsoft Cloud revenue was $31.8 billion, up 24%.
Microsoft shares closed up 3.1% Wednesday, the day after the report.
In the quarter, the company posted revenue of $18.6 billion for its Productivity and Business Processes segment, up 13% from a year ago, and ahead of its guidance range of $18 billion to $18.3 billion. That includes 15% growth in Office Commercial products.
Microsoft said its Intelligent Cloud segment, which includes Azure, had revenue of $24.3 billion, up 19%, and well ahead of its forecast range of $23.3 billion to $23.6 billion. Server products and cloud services revenue was up 21%.
Revenue from the More Personal Computing segment was $13.7 billion, up 3%, and nicely above the guidance range of $12.5 billion to $12.9 billion. Search and news advertising revenue excluding traffic acquisition costs rose 10%. One big surprise in the quarter was that Windows OEM revenue—paid by PC manufacturers—was up 4%. The company’s guidance had called for a decline in the low-to-mid teens.
The company said commercial bookings in the quarter were up 14%, or 17% adjusted for currency.
Microsoft repurchased $3.6 billion of common stock in the quarter.
Microsoft shares have surged 36% in 2023, amid investor excitement about the company’s substantial investment in OpenAI, its integration of AI software into Bing, and its rollout of AI Copilot software across its software lineup.

MSFT Microsoft Corporation Options Ahead of EarningsIf you haven`t bought MSFT after they revealed a 49% Stake in OpenAI creator of ChatGPT:
Then analyzing the options chain and the chart patterns of MSFT Microsoft Corporation Options prior to the earnings report this week,
I would consider purchasing the 350usd strike price Calls with
an expiration date of 2023-12-15,
for a premium of approximately $6.90.
If these options prove to be profitable prior to the earnings release, I would sell at least half of them.
Looking forward to read your opinion about it.

Microsoft Stock Surges After Revenue, Earnings BeatsMicrosoft (MSFT) announced its quarterly earnings after the closing bell on Tuesday, beating analysts' expectations on revenue and earnings per share. The tech giant reported revenue of $56.5 billion in the quarter, above consensus estimates of $54.5 billion.
Adjusted earnings per share (EPS) topped out at $2.99 compared with an anticipated $2.66 per share. The company saw adjusted EPS of $2.35 during the same quarter last year.
Shares rose more than 3% in early trading on Wednesday, after Microsoft said higher-than-expected AI consumption boosted its cloud business.
Microsoft's Intelligent Cloud segment, which includes its Azure business, brought in $24.3 billion in the quarter. Wall Street was looking for revenue of $23.6 billion. Azure and other cloud services revenue jumped 29% in the quarter, beating Wall Street's expectations of 27%.
"With copilots, we are making the age of AI real for people and businesses everywhere," Microsoft CEO Satya Nadella said in a statement. "We are rapidly infusing AI across every layer of the tech stack and for every role and business process to drive productivity gains for our customers.”
The company's Productivity & Business Processes, meanwhile, saw revenue of $18.6 billion, while More Personal Computing took in revenue of $13.7 billion versus analysts' expectations of $18.3 billion and $12.9 billion, respectively.
Microsoft has made AI a cornerstone of its business over the last year, announcing a massive $10 billion investment in ChatGPT developer OpenAI and unveiling generative AI-enhanced versions of its Bing search engine and Edge browser in February.
Since then, the company has launched various generative AI-powered Copilot apps for Outlook, Windows 11, and Microsoft 365. The software can summarize emails, help you draft documents and create PowerPoint presentations, and provide insight into Windows 11 features. Microsoft says it will combine the Copilots into a single app in the future.
The investments are meant to help spark a new growth cycle for Microsoft, as customers look to artificial intelligence as a means of streamlining certain business processes and improving employee efficiency.
In addition to its massive focus on AI capabilities, Microsoft recently closed its $69 billion acquisition of Activision Blizzard. The deal is the largest in Microsoft’s history and instantly makes it the third-largest video game company in the world by revenue behind Tencent and Sony. The Federal Trade Commission, however, could still try to break up the companies on antitrust grounds.

MICROSOFT: No buying before the Resistance breaks.Microsoft made an important bullish breakout as it crossed over the LH trend-line of the Falling Wedge last week and turned bullish on the 1D technical outlook (RSI = 58.105, MACD = 2.380, ADX = 32.602). The last sell signal is near the dotted top of a potential Channel Down pattern. As long as it holds, we are taking the sell and target the 1D MA200 (TP = 313.00). On the contrary, if the price closes over the R1 level (341.00) we will go long and target the R2 level (TP = 366.50).
The fact that the 1D MA50 is holding is certainly a build up to a bullish trend potentially. As is the Bullish Cross on the 1D MACD, which by the way is on a Bullish Divergence (HL) against the LL of the stock price.
## If you like our free content follow our profile to get more daily ideas. ##
## Comments and likes are greatly appreciated. ##

Microsoft’s Metaverse hype
The acquisition of Activision Blizzard could mark a new phase in Microsoft's metaverse development.

Microsoft’s $69 Billion Activision Blizzard cleared by Britain LONDON - Britain finally cleared Microsoft (NASDAQ:MSFT)'s $69 billion acquisition of Activision Blizzard (NASDAQ:ATVI) on Friday after it forced the Xbox owner to sell the steaming rights to games including "Call of Duty" to address its competition concerns.
The deal was blocked in April by the Competition and Markets Authority (CMA) which said it could give the U.S. computing giant a stranglehold over the nascent cloud gaming market.
But the regulator ripped up its play book by reopening the case after Microsoft agreed to sell the streaming rights to Activision's games to Ubisoft Entertainment, with remedies to ensure the terms were enforceable.
The deal was the biggest test of the CMA's global power to take on the tech giants since Britain left the European Union.
It said "sticking to its guns" in the face of criticism from the merging companies had delivered an outcome that was better for competition, consumers and economic growth.
The approval paves the way for Microsoft to close the deal by Oct. 18 after it extended the deadline to secure UK approval.
The CMA said Microsoft's concession on streaming was a "gamechanger", adding that it was the only competition agency globally to have delivered this outcome.
The new deal will stop Microsoft from locking up competition in cloud gaming as this market takes off, preserving competitive prices and services for UK cloud gaming customers," it said in a statement.
Microsoft announced the deal in early 2022, aiming to boost its growth in console, mobile, PC, and cloud gaming to compete with the likes of Tencent as well as PlayStation-owner Sony (NYSE:SONY).
The U.S. Federal Trade Commission opposed the deal but after failing to stop it, the CMA was left standing alone.

Mircosoft breakout on watch MSFT should lift this market higher if it holds above the breakout trendline.
We could see a big rally in to tech earnings if economics data comes in positive.

Microsoft - Neutral / ShortDid not notice that bearish weekly close that week. Pretty nasty candle. I am not advising a short here since we are $30 off the highs already. However, if you are looking to buy the safest area risk / return wise is $300 but more ideally the $285 area.
Typically when 7-10 stocks lead the entire market its bearish for the future, I am getting concerned we are approaching that point despite the nasdaq looking strong overall.
My strategy isnt about timing the market but buying and selling value/euphoria. Hence the idea above.

"Microsoft's Quantum Leap: How Quantum tech can shape the futureMicrosoft's Quantum Leap: A Bullish Trend on NASDAQ
Microsoft (MSFT) is experiencing a bullish surge on NASDAQ. The Relative Strength Index (RSI) for MSFT indicates strong buying momentum, with levels well above the 70 threshold, signaling an overbought condition and potential for further gains. The Simple Moving Averages (SMA) show a golden cross, with the 50-day SMA crossing above the 200-day SMA, a classic bullish signal. This suggests strong upward momentum and investor confidence in Microsoft's strategic investments in cloud computing, AI, and quantum computing. As technology continues to evolve, MSFT appears well-positioned for sustained growth.

Microsoft's Remarkable 33% YTD Growth: A Deep Dive into Its ProsMicrosoft's Remarkable 33% YTD Growth: A Deep Dive into Its Prospects
Microsoft Corporation has been on a remarkable journey in 2023, with its shares showcasing an impressive year-to-date growth of 33%. This ascent has caught the attention of investors for several compelling reasons. As a tech giant, Microsoft has not only solidified its presence in the rapidly evolving realm of artificial intelligence (AI) but has also demonstrated remarkable resilience to economic challenges, setting it apart from many industry peers. In addition to these strengths, Microsoft's standing as a dominant player in the software sector, with a portfolio that includes iconic brands such as Windows, Office, Azure, and LinkedIn, further enhances its appeal.
Despite its strong performance earlier in the year, the tech market has experienced a modest downturn over the past three months. This market correction has led to a 7% dip in Microsoft's stock value since July, aligning it with declines witnessed by competitors like Apple and Amazon. This adjustment in stock price presents an opportune moment for investors to delve deeper into the growth potential of a high-performing company like Microsoft and consider it as a prospective investment.
Here are three crucial insights that savvy investors should be aware of regarding Microsoft:
Enormous Earnings Potential in AI:
Microsoft's strategic investments in the AI domain have been nothing short of visionary. In 2019, the company committed $1 billion to OpenAI, the developer behind ChatGPT, and later increased its stake to 49%. This partnership has given Microsoft access to cutting-edge AI technology, allowing the integration of AI-powered features throughout its software portfolio.
In July, Microsoft indicated that investors should expect "gradual" revenue growth from its AI offerings in fiscal 2024. However, considering the sheer dominance of Microsoft's brand portfolio and the advanced capabilities of OpenAI, this projection may underestimate the actual impact and potential of AI-driven revenue growth.
Wedbush analyst Dan Ives has observed a significant surge in activity on Microsoft's cloud service, Azure, following the introduction of AI tools. This uptick could potentially lead to a remarkable 25% revenue growth for Azure in the first quarter of 2024. Given that Azure already experienced substantial 19% year-over-year growth in fiscal 2023, this projection seems reasonable. Furthermore, Microsoft 365 is set to introduce an AI assistant called CoPilot, available for $30 per month as an add-on to existing subscriptions. Microsoft's strong foothold in cloud computing and productivity software positions it favorably to diversify its AI offerings and capitalize on this thriving industry.
Attractive Valuation Relative to Other AI Stocks:
While chipmakers like Nvidia and Advanced Micro Devices (AMD) have garnered significant attention in the context of AI growth, their stocks have witnessed substantial increases of approximately 198% and 59%, respectively, since the start of the year. These companies play pivotal roles in AI hardware development, but their recent surges have led to elevated stock prices. In comparison, Microsoft appears to offer better long-term value.
A key metric for evaluating stock value is the forward price-to-earnings (P/E) ratio. A P/E ratio below 20 is typically considered undervalued, and Microsoft is the closest to this figure among prominent AI players. Moreover, Microsoft's substantial investment in OpenAI and its dominance in various market segments suggest similar or even greater earnings potential within the lucrative AI industry. Microsoft's steady stock growth and consistent earnings growth make it an attractive choice, especially as expected earnings growth may already be reflected in the valuations of its peers.
Reliable Dividend Growth:
Microsoft stands out for its consistent dividend growth, boasting an impressive streak of 19 consecutive years of increases. Over the years, the company's dividend has grown from a modest $0.08 in 2003 to a substantial $0.68 in 2022. Recently, Microsoft announced another dividend hike, exceeding 10% to reach $0.75. While Microsoft's dividend yield of 0.87% may appear modest compared to leading dividend stocks like Verizon, it surpasses the yields of its tech competitors. Amazon and Alphabet offer no dividends, while Apple's dividend yield stands at 0.56%.
Microsoft's sustained commitment to dividend growth underscores management's unwavering confidence in its financial outlook. This, combined with its consistent stock appreciation, positions Microsoft as an appealing choice for long-term investors seeking both stability and growth potential.
In conclusion, Microsoft's journey in 2023 has been marked by significant achievements and a noteworthy stock performance. Its strategic investments in AI, attractive valuation relative to AI peers, and reliable dividend growth make it a compelling choice for investors looking to capitalize on the company's strong position in the tech industry and its promising prospects in the field of artificial intelligence. As the tech landscape continues to evolve, Microsoft remains a key player to watch for both its resilience and innovation.
Our preference
The upside prevails as long as 285.85 is support.

MICROSOFT Buy with a plan BMicrosoft / MSFT found support at 309.50, more or less where the August 18th low was priced, and put the Channel Down pattern on hold.
It is quite possible for a Rectangle to emerge as a hold of Support A (309.50) would potentially mean a test of Resistance A (341.10).
The 4hour MACD forming a Bullish Cross, certainly leads towards that direction.
As long as Support A holds, buy and target 340. If it fails and breaks, sell and buy on the 1day MA200 (target 320.00).
Previous chart:
Follow us, like the idea and leave a comment below!!

MSFT Takeoff🚀
Here we have Microsoft Corporation (MSFT). I have a very bullish sentiment on this stock because of the charts and analytics as well. Technology as a sector has been doing good this past week according to performance. The weekly and daily chart are looking like we have a bearish trend reversal. On the weekly timeframe we bounced off of the bottom Bollinger band but we are still early in the week. If we can close this week with a strong green candle, I would definitely look for some long calls. And on the Daily timeframe we were over-extended from the bottom Bollinger line which could signal a reversal as well as we were oversold on the RSI. As always, thank you for reading and I hope you learned something educational in this post. Feel free to like, and comment on this post.
