Microsoft Soars to Record High Following Strong Earnings ReportMicrosoft Stock (MSFT) Soars to Record High Following Strong Earnings Report
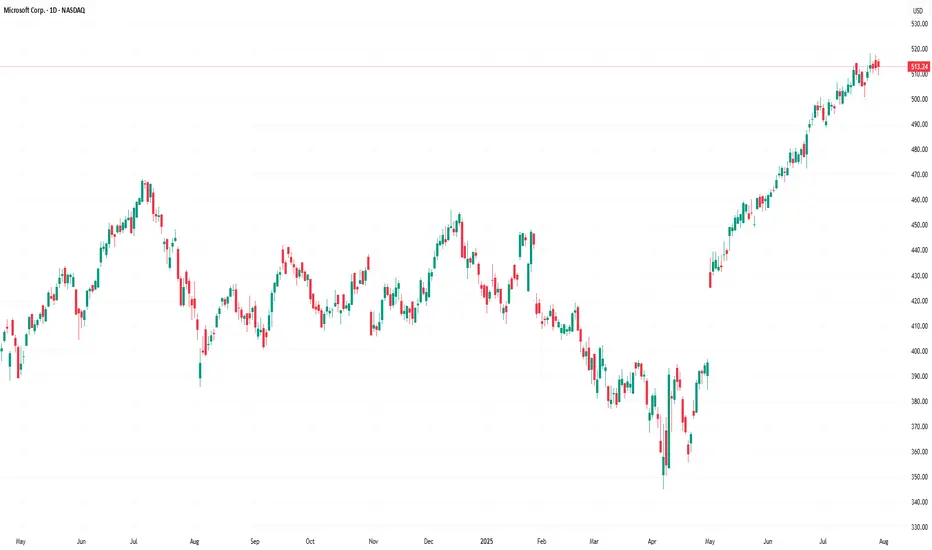
As the chart illustrates, Microsoft (MSFT) shares surged sharply after the close of the regular trading session – an immediate market reaction to the company’s strong quarterly results.
According to available data, MSFT's post-market price jumped to $555 per share, exceeding its previous all-time high by more than 8%.
Why Did MSFT Share Price Rise?
The quarterly report provided several reasons for optimism, including:
→ Earnings per share (EPS) came in at $3.65, beating analysts’ expectations of $3.37 by over 8%. Revenue also exceeded forecasts, totalling $76.4 billion versus the projected $73.9 billion.
→ Microsoft’s cloud revenue rose by 27% to $46.7 billion, while Azure’s annualised revenue exceeded $75 billion, driven by growing demand for AI-related services.
In response to these results, Barclays analysts quickly raised their price target for Microsoft shares from $550 to $625.
Technical Analysis of MSFT Chart
It is worth noting that the previous quarterly report was also strong, resulting in the formation of a large bullish gap on 1 May, followed by a sustained upward trend (highlighted by the purple trendline S). Importantly, the gap in the $395–425 range remains unfilled.
Yesterday’s report is also likely to result in a large bullish gap at the market open today, though this time, the market context could lead to a different scenario.
The key factor here is the long-term ascending channel (shown in blue), which reflects MSFT’s price movements throughout 2024–2025. After the previous strong report, the share price moved from the median to the upper boundary of the channel without setting a new record high. However, following the most recent report, the price has surged deep into overbought territory, potentially setting a multi-month high on the RSI and achieving a significant breakout to a new record.
As a result, once the initial excitement around the earnings subsides – and the desire of investors to close long positions intensifies – MSFT could undergo a correction from the upper boundary of the channel. In this scenario, the following support levels could come into play:
→ The psychological level of $550 in the short term;
→ The S trendline, as a possible support during a deeper correction.
This article represents the opinion of the Companies operating under the FXOpen brand only. It is not to be construed as an offer, solicitation, or recommendation with respect to products and services provided by the Companies operating under the FXOpen brand, nor is it to be considered financial advice.
Microsoftcorp
Microsoft: Progress!Microsoft successfully completed the magenta wave (2) and made further progress during the subsequent wave (3). Imminently, this wave (3) has some more room to rise, and after a temporary pullback in the following wave (4), the price should eventually overcome the resistance at $456.16. On the other hand, our 31% likely alternative scenario envisions a new low for the green wave alt. and would include a detour below the support at $348.18. Primarily, we consider the regular wave as already completed (in our previous Target Zone).

MSFT Pair : MSFT - Microsoft
Description :
Triple Top pattern in Short Time Frame
Completed " 12345 " Impulsive Waves and " A " Corrective Waves
RSI - Divergence
Break of Structure
Bullish Channel as an Corrective Pattern in Long Time Frame

MSFT 24/04Pair : MSFT - Microsoft
Description :
Completed " 12345 " Impulsive Waves
Break of Structure and Retracement
RSI - Divergence
Bullish Channel as an Corrective Pattern in Short Time Frame with the Breakout of Lower Trend Line

💻Microsoft Corp💻 is Ready to Decrease➖15%🏃♂️ Microsoft Corp is moving near the 🟡 Potential Reversal Zone(PRZ)($437-$422) 🟡.
💡Also, we can see Regular Divergence(RD-) between two Consecutive Peaks .
🌊From the theory of Elliott waves , it seems that the macro can complete five main impulse waves in 🟡 Potential Reversal Zone(PRZ)($437-$422) 🟡.
🔔I expect the Microsoft Corp to at least fall to the 🟢 Support zone($368_$342) 🟢 after the completion of wave 5 and the breaking of the Uptrend line .
Microsoft Corp (MSFTUSD) Analyze, Daily time frame⏰.
Do not forget to put Stop loss for your positions (For every position you want to open).
Please follow your strategy; this is just my Idea, and I will be glad to see your ideas in this post.
Please do not forget the ✅' like '✅ button 🙏😊 & Share it with your friends; thanks, and Trade safe.

💻Microsoft Corp💻 ➕20% growth potential🚀✅ Microsoft Corp reacted well to the 🟢 Support zone($317_$300) 🟢 and reached the Downtrend line .
🌊According to the theory of Elliott waves , Microsoft Corp completed the main wave 4 [Zigzag(ABC/5-3-5) ] in the 🟢 Support zone($317_$300) 🟢 so that the main wave 3 structure was Extended .
🔔I expect Microsoft Corp to rise to the minimum 🔴 Resistance zone($366_$344) 🔴 after the downtrend line is broken, and if the resistance zone is broken, it will rise to the end of the main wave 5 that I specified in the char(➕ 20% ).
Microsoft Corp (MSFTUSD) Analyze, Daily time frame⏰.
Do not forget to put Stop loss for your positions (For every position you want to open).
Please follow your strategy; this is just my Idea, and I will be glad to see your ideas in this post.
Please do not forget the ✅' like '✅ button 🙏😊 & Share it with your friends; thanks, and Trade safe.

MSFT ~ Snapshot TA (Daily / Nov 2023)NASDAQ:MSFT chart mapping/analysis.
Bullish price momentum within an ascending parallel channel (green).
Bull target(s)
Breakout above ascending trend-line resistance (white dotted)
Upper range of ascending parallel channel (green)
Upper range of ascending parallel channel (light blue)
23.6% Fib + ascending parallel channel(s) confluence resistance zone
Bear target(s)
Underlying gap fills (~357.54 / ~339)
Ascending trend-line support (white dotted)
38.2% Fib
Lower range of ascending parallel channel (green)
38.2% Fib + parallel channel (green) confluence support zone
50% Fib
Gap fill (~280.39) + Golden Pocket Fib confluence support zone
Lower range of ascending parallel channel (light blue)

Microsoft: Challenges and Opportunities for InvestorsMicrosoft's business appears to be slowing down, with the company's stock declining since the beginning of 2022 due to sales growth reaching its limit. Furthermore, large parts of the company's business, including the PC and video game segments, are shrinking, and the outlook for corporate technology spending in 2023 isn't looking good.
Despite these major problems, Microsoft has several aspects that are not as well known and point to solid returns for investors in the long run. For example, the company has a rich portfolio that covers attractive sectors such as cybersecurity, video games, and cloud services, offering more diversified participation in technology growth trends than many other peers.
Although some of these niches may go through periods of decline, Microsoft provides investors with exposure to attractive industries that offer solid returns in the long run. Additionally, Microsoft's stable cash flow is another strength that sets it apart from many of its peers. The company generated $20.4 billion in operating income in Q2 of fiscal 2023, just 8 percent less than the previous year, and its operating cash is still strong at $11.2 billion.
Despite the challenges facing most tech giants in 2023, Microsoft has several strengths that could help it weather the storm. For example, the company pays a dividend that was recently raised by 10 percent, has plenty of cash, and does not need to rely on costly debt to finance its business. Additionally, Microsoft's global sales presence should smooth out the volatility from the downturn in demand in some markets and niches.
In conclusion, although Microsoft's stock may not be recession-proof, the company's strengths provide it with the flexibility to continue investing in high-yield projects such as artificial intelligence and virtual reality, ensuring that long-term growth prospects are not jeopardized by a few weak quarters.

Microsoft -> Very Bullish Inverted Head And ShouldersHello Traders,
welcome to this free and educational multi-timeframe technical analysis.
Microsoft just recently perfectly tested and rejected a quite strong and obvious previous support/resistance zone towards the upside. It also seems like Microsoft is about to create a double bottom from a weekly perspective, which is generally speaking a very bullish pattern, leading to more upside potential.
On the daily timeframe we actually have a quite interesting situation. You can see that the market is currently crating an inverted head and shoulders and just yesterday and today broke above and retested the neckline, which again is simply previous resistance which is now turned support.
Now from here I do expect further continuation towards the upside, confirming the bullish inverted head and shoulders pattern.
Thank you for watching and I will see you tomorrow!

Microsoft Analysis 01.12.2022Hello Traders,
welcome to this free and educational analysis.
I am going to explain where I think this asset is going to go over the next few days and weeks and where I would look for trading opportunities.
If you have any questions or suggestions which asset I should analyse tomorrow, please leave a comment below.
I will personally reply to every single comment!
If you enjoyed this analysis, I would definitely appreciate it, if you smash that like button and maybe consider following my channel.
Thank you for watching and I will see you tomorrow!

Microsoft Analysis 23.11.2022Hello Traders,
welcome to this free and educational analysis.
I am going to explain where I think this asset is going to go over the next few days and weeks and where I would look for trading opportunities.
If you have any questions or suggestions which asset I should analyse tomorrow, please leave a comment below.
I will personally reply to every single comment!
If you enjoyed this analysis, I would definitely appreciate it, if you smash that like button and maybe consider following my channel.
Thank you for watching and I will see you tomorrow!

Microsoft Analysis 13.01.2022Hello Traders,
welcome to this free and educational analysis.
I am going to explain where I think this asset is going to go over the next few days and weeks and where I would look for trading opportunities.
If you have any questions or suggestions which asset I should analyse tomorrow, please leave a comment below.
I will personally reply to every single comment!
If you enjoyed this analysis, I would definitely appreciate it, if you smash that like button and maybe consider following my channel.
Thank you for watching and I will see you tomorrow!

I recommend MSFT for purchaseHello guys , according to my graphical analysis of microsoft , there is a high probability of an increase towards over 327$ in the next few days

MSTF 1H What Can Stop Microsoft's grow Supercycle?Today, we will look at the behavior of the share price of Microsoft Corporation on a global chart.
Patient investors have been gaining the position of Msft shares for 13 long years, and the price itself during this period was stuck in the consolidation of $20-37
However, look at the result: as of now, the share price has risen +1000% , and the super cycle of growth itself has been going on for 8 years.
Moreover, during this long super cycle of growth, there have not yet been significant corrections. The recent news that the Pentagon is breaking a $10 billion contract with Microsoft shook the share price down 1%, but the next day, Msft's share price updated its all-time high.
Even during the Covid market drop in February-March 2020, Msft shares fell by only -30% and left the price within the parabolic rally. For example, then the S&P500 fell by -35%, the DJI index -38%, and for example, the hypes TSLA shares by as much as -60%
By the way, yesterday we made an idea for TESLA, we invite you to view:
For ourselves, we set the bar for the growth of Msft shares to $349-350 , from where a long correction may begin. Of course, against the backdrop of such a powerful growth, it is hard to believe in such a deep correction, but it would be nice to test the strength of the top level of $60 per share for Microsoft
An alternative scenario is a breakout and consolidation of the price above $350 , then nothing will prevent the price from moving further with parabolic growth, and the zone of $825-880 per share of MicrosoftCorporation will wait from above

MSFT LONG SET UP (MICROSOFT CORP.)TITLE/(DATE)- BUY MSFT/USD
ASSET- STOCK
PLATFORM-MT4
ORDER TYPE- BUY Market
Time Frame-4hr
ENTRY PRICE 1- $206.50✅ market
ENTRY 2- $202.50 pending
STOP LOSS- $199.50 (70 PIPs)
TAKE PROFIT 1-$213.50 (70PIPS)
TAKE PROFIT 2- $220.50(140 PIPS)
TAKE PROFIT 3- $227.50 (210 PIPS)
TAKE PROFIT 4- $234.50 (280 PIPS)
TAKE PROFIT 5- $241.50 (350 PIPS)
STATUS:🏃🏽♂️RUNNING 🏃🏽♂️

