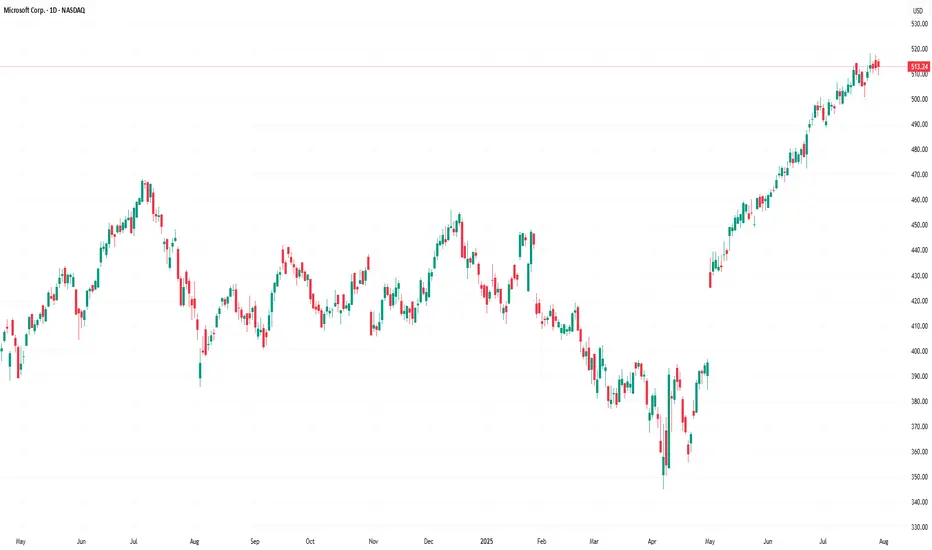
Microsoft Soars to Record High Following Strong Earnings ReportMicrosoft Stock (MSFT) Soars to Record High Following Strong Earnings Report
As the chart illustrates, Microsoft (MSFT) shares surged sharply after the close of the regular trading session – an immediate market reaction to the company’s strong quarterly results.
According to available data, MSFT's post-market price jumped to $555 per share, exceeding its previous all-time high by more than 8%.
Why Did MSFT Share Price Rise?
The quarterly report provided several reasons for optimism, including:
→ Earnings per share (EPS) came in at $3.65, beating analysts’ expectations of $3.37 by over 8%. Revenue also exceeded forecasts, totalling $76.4 billion versus the projected $73.9 billion.
→ Microsoft’s cloud revenue rose by 27% to $46.7 billion, while Azure’s annualised revenue exceeded $75 billion, driven by growing demand for AI-related services.
In response to these results, Barclays analysts quickly raised their price target for Microsoft shares from $550 to $625.
Technical Analysis of MSFT Chart
It is worth noting that the previous quarterly report was also strong, resulting in the formation of a large bullish gap on 1 May, followed by a sustained upward trend (highlighted by the purple trendline S). Importantly, the gap in the $395–425 range remains unfilled.
Yesterday’s report is also likely to result in a large bullish gap at the market open today, though this time, the market context could lead to a different scenario.
The key factor here is the long-term ascending channel (shown in blue), which reflects MSFT’s price movements throughout 2024–2025. After the previous strong report, the share price moved from the median to the upper boundary of the channel without setting a new record high. However, following the most recent report, the price has surged deep into overbought territory, potentially setting a multi-month high on the RSI and achieving a significant breakout to a new record.
As a result, once the initial excitement around the earnings subsides – and the desire of investors to close long positions intensifies – MSFT could undergo a correction from the upper boundary of the channel. In this scenario, the following support levels could come into play:
→ The psychological level of $550 in the short term;
→ The S trendline, as a possible support during a deeper correction.
This article represents the opinion of the Companies operating under the FXOpen brand only. It is not to be construed as an offer, solicitation, or recommendation with respect to products and services provided by the Companies operating under the FXOpen brand, nor is it to be considered financial advice.
Microsofttrading
MICROSOFT: 1D Golden Cross to slingshot it to $590MSFT turned overbought on its 1D technical outlook (RSI = 73.199, MACD = 13.580, ADX = 52.584), extending the rise to a new ATH today, having formed a 1D Golden Cross on June 9th. That was the first 1D Golden Cross since March 20th 2023, which validated a bullish extenstion to +71.50% from the bottom. Since the long term Channel Up has already started its new bullish wave, we are expecting the uptrend to continue up to +71.50% at least. Go long, TP = $590.
## If you like our free content follow our profile to get more daily ideas. ##
## Comments and likes are greatly appreciated. ##

Microsoft (MSFT) Becomes the World’s Most Valuable CompanyMicrosoft (MSFT) Becomes the World’s Most Valuable Company
According to financial data, Microsoft’s market capitalisation currently stands at approximately $3.24 trillion, while the valuations of Apple and Nvidia — second and third on the list respectively — remain below $3 trillion.
This follows a sharp surge in Microsoft’s share price (MSFT), which has risen by over 26% from its April low.
Why has Microsoft’s share price risen?
The main driver behind the MSFT stock rally was last week’s quarterly report, which outperformed analysts’ expectations:
→ Earnings per share: actual = $3.46, forecast = $3.22;
→ Revenue: actual = $70 billion, forecast = $68.4 billion.
As reported in the media, investors responded positively to a notable increase in revenue from Azure cloud services.
Technical Analysis of Microsoft (MSFT) Shares
A wide bullish gap — over 7% — pushed the price above a key support line that had underpinned the 2024 uptrend in Microsoft stock.
However, following the report’s release, the price stabilised just below a resistance line drawn through previous key highs.
This provides grounds to interpret the current setup as a symmetrical triangle pattern with an axis around the $427 mark, suggesting short-term price consolidation within the defined boundaries.
Going forward, further key news related to Microsoft — a company less exposed to trade war impacts than Apple — could:
→ help maintain its status as the world’s most valuable firm;
→ support a potential bullish breakout through the resistance line and a continuation of the 2024 uptrend.
This article represents the opinion of the Companies operating under the FXOpen brand only. It is not to be construed as an offer, solicitation, or recommendation with respect to products and services provided by the Companies operating under the FXOpen brand, nor is it to be considered financial advice.

MICROSOFT: Rectangle bottom buy opportunity.Microsoft is still bearish on its 1D technical outlook (RSI = 39.052, MACD = -6.600, ADX = 39.471) but that is to be expected as the price breached the 0.786 and almost touched the bottom of the 5 month Rectangle pattern. All breaks under the 0.786 have been strong buy opportunities targeting at least the 0.236 Fib. The trade is long (TP = 438.50).
## If you like our free content follow our profile to get more daily ideas. ##
## Comments and likes are greatly appreciated. ##

Microsoft (MSFT): What’s Next? Will It Break $455.34 Morning, Trading Family! Let’s Talk About Microsoft (MSFT): Will It Break $455.34 or Head Lower?
Microsoft’s stock is at a key level, and the next move could set the tone for what’s ahead. The magic number right now is $455.34. Will we see a breakout to new highs, or could the price dip lower before bouncing back? Let’s break it down step by step so everyone’s ready!
If Microsoft Breaks Above $455.34
If the stock moves above $455.34 and holds steady, it could signal that buyers are in control.
What could happen?
The price might head up toward $460 or even $465. These levels could be the next spots where the stock takes a breather.
What should we watch?
Look for strong movement above $455.34 with good trading volume (lots of action). If the price quickly dips back below, it could mean the breakout isn’t real yet.
How can we trade it?
If the price holds above $455.34, it might be a good time to think about buying with a target around $460. Just make sure to use a stop-loss in case the trade doesn’t go as planned.
If Microsoft Drops Below $455.34
If the stock struggles to stay above $455.34, we could see a pullback.
The first key level:
Watch $449. This is the next area where buyers might step in to stop the price from falling.
If $449 doesn’t hold:
The price could drop further, landing somewhere in the $443–$438 range, where stronger support is likely.
How can we trade it?
Be patient! If the price dips, wait for signs that it’s stabilizing at a support level before making any moves.
What If the Price Drops Below $438?
If MSFT falls below $438, it could mean the stock is turning more bearish. At that point, we’ll need to step back and reassess the trend.
Tips for Today’s Trading
If you’re bullish: Wait for the price to break and hold above $455.34 before jumping in.
If you’re bearish: Watch for a clean break below $449 for potential short opportunities.
Always: Use stop-losses to protect yourself and trade with a plan!
Bottom Line:
The $455.34 level is the line in the sand. If we break above, it’s good news for the bulls. If not, we could see a dip to $449 or lower.
Kris/ Mindbloome Exchange
Trade What You See

MICROSOFT: Channel Down bottomed. Bullish wave starting to 540.MSFT is neutral on its 1D technical outlook (RSI = 48.171, MACD = -0.910, ADX = 23.585) as since the September 6th Low it has been ranging sideways. Despite the lack of trend, this price action still hit the bottom of the long term Channel Up and technically the new bullish wave should start. The conditions for that are perfect as the 1D MACD just formed a Bullish Cross. The last bullish wave touched the HH trendline of the Channel Up after surpassing the 1.786 Fibonacci extension. That is our current target (TP = 540).
See how our prior idea has worked out:
## If you like our free content follow our profile to get more daily ideas. ##
## Comments and likes are greatly appreciated. ##

MSFT 24/04Pair : MSFT - Microsoft
Description :
Completed " 12345 " Impulsive Waves
Break of Structure and Retracement
RSI - Divergence
Bullish Channel as an Corrective Pattern in Short Time Frame with the Breakout of Lower Trend Line

MICROSOFT: Sell and Buy at the right place.MSFT is on healthy bullish technical levels on the 1D timeframe (RSI = 60.229, MACD = 3.110, ADX = 14.662) and there is no indication that the current uptrend won't be extended. We expect the current HH bullish wave of the Channel Up to continue as high as 450.00 before a technical correction. This is what took place after the July 18th 2023 HH, which pulled back to the 0.382 Fibonacci level. Consequently we are willing to buy again for the long term only at 400.00.
## If you like our free content follow our profile to get more daily ideas. ##
## Comments and likes are greatly appreciated. ##

MICROSOFT: Bearish breakout under the 1D MA50.MSFT has turned neutral on its 1D technical outlook (RSI = 46.496, MACD = 1.200, ADX = 24.141) as the price reached the 1D MA50 for the first time since late October on a sideways price action. Since the 1 year pattern is a Channel Up, we expect its bottom to get tested (TP = 345.00) if the 1D MA50 is crossed. Consider it a bearish breakout signal.
See how our prior idea has worked:
## If you like our free content follow our profile to get more daily ideas. ##
## Comments and likes are greatly appreciated. ##

MICROSOFT: No buying before the Resistance breaks.Microsoft made an important bullish breakout as it crossed over the LH trend-line of the Falling Wedge last week and turned bullish on the 1D technical outlook (RSI = 58.105, MACD = 2.380, ADX = 32.602). The last sell signal is near the dotted top of a potential Channel Down pattern. As long as it holds, we are taking the sell and target the 1D MA200 (TP = 313.00). On the contrary, if the price closes over the R1 level (341.00) we will go long and target the R2 level (TP = 366.50).
The fact that the 1D MA50 is holding is certainly a build up to a bullish trend potentially. As is the Bullish Cross on the 1D MACD, which by the way is on a Bullish Divergence (HL) against the LL of the stock price.
## If you like our free content follow our profile to get more daily ideas. ##
## Comments and likes are greatly appreciated. ##

MICROSOFT: Last chance to rebound. Selloff under this trendline.Microsoft is on a neutral technical setting on the 1D timeframe (RSI = 47.707, MACD = 0.040, ADX = 29.959) despite trading on the HL of the Rising Megaphone for the second time in 30 days. As long as this trendline holds, MSFT is a buy signal, targeting R1 (TP = 366.50). A cross under the Bullish Megaphone, will be a sell signal aiming at the 1D MA200 (TP = 300.00).
It is worth mentioning that the 1D MACD formed today a Bearish Cross, the first since July 21st. The pattern could be replicating the price action of September-November 2022.
## If you like our free content follow our profile to get more daily ideas. ##
## Comments and likes are greatly appreciated. ##

MICROSOFT Remains a buy as long as the 1day MA50 holds.Microsoft / MSFT turned sideways inside the 4 month Channel Up after it hit the 350 Resistance (and All Time High) and got rejected.
The price is now approaching the bottom of the Channel Up and the 1day MA50.
The 1day MA50 has been supporting since January 26th.
As long as it holds, buy and target 360.
If the price closes a 1day candle under it, sell and target 315.
A closing under the 1day MA100, can initiate a bearish reversal.
Notice: the 1day RSI is holding its Rising Support, keeping the momentum bullish.
Follow us, like the idea and leave a comment below!!
