S&P Midcap 400 Futures (EMD1!), H4 Potential for Bullish RiseType : Bullish Rise
Resistance : 2727.9
Pivot: 2612.6
Support : 2564.4
Preferred Case: On the H4, with price moving above the ichimoku indicator and within an ascending channel , we have a bullish bias that price will rise from the pivot at 2612.6 where the pullback support is to the 1st resistance at 2727.9 in line with swing high resistance and -61.8% fibonacci expansion .
Alternative scenario: Alternatively, price could break pivot structure and drop to 1st support at 2564.4 where the pullback support, 50% fibonacci retracement and 61.8% fibonacci projection are.
Fundamentals: Due to investor optimism that the Federal Reserve can achieve a soft landing for the economy, we have a bullish view for the S&P Midcap 400 index.
MIDCAP

S&P Midcap 400 Futures (EMD1!), H4 Potential for Bullish RiseType : Bullish Rise
Resistance : 2564.0
Pivot: 2494.8
Support : 2460.9
Preferred Case: On the H4, with prices moving above the ichimoku indicator, we have a bullish bias that price will rise to the pivot at 2494.8 where the pullback resistance is. Once there is upside confirmation of price breaking pivot structure, we would expect bullish momentum to carry price to 1st resistance at 2564.0 where the swing high resistance is.
Alternative scenario: Alternatively, price could drop to the 1st support at 2460.9 where the pullback support, 61.8% fibonacci projection and 23.6% fibonacci retracement are.
Fundamentals: Due to fresh worries of global growth and House Speaker Nancy Pelosi's trip to Taiwan capital, Taipei, we have a bearish view on the Midcap 400 index. We'll need to exercise caution for this setup because our fundamentals and technicals are not completely aligned.

Mid-Cap Growth This is a 6-month chart of iShares Russell Mid-Cap Growth ETF (IWP) relative to the performance of the S&P 500 ETF (SPY).
IWP tracks a market-cap-weighted index of growth companies.
The yellow and orange lines are the exponential moving averages that form the indicator called the EMA exp ribbon. The EMA exp ribbon usually acts as support when price hits it from above, and usually acts as resistance when price hits it from below. To break the EMA exp ribbon, and reverse the trend, usually, a single candlestick must pierce through the ribbon (moving averages) with high volume and strong momentum. In this case, the EMA exp ribbon held up as support.
Here we see that mid-cap growth stocks have corrected on the longer timeframes and will likely start to move back up relative to SPY. If this holds true, we can expect that mid-cap growth stocks will begin to outperform the broader index over the long term. For those who invest on longer time horizons, this could be a great time to consider legging into IWP. If you're conservative, you may wish to wait for IWP to breakout above the daily EMA exp ribbon before entering a position.
The current 6-month candle, which started on July 1st, is showing a long upper wick, which indicates that capitulation is still occurring. Capitulation can be seen in candlesticks that occur after a long downtrend, and which have long upper wicks. These long upper wicks after a long downtrend indicate that there are people selling, or shorting, into strength. These market participants usually need to exit before a major bullish breakout occurs.
For the month of June, IWP/SPY printed a bullish spinning top candle (which is a bottom reversal candle). So it's likely that we're in the final stages of capitulation, and soon enough a bullish breakout will occur, (assuming that the relative performance chart accurately predicts price action).

Raymond BreakoutThe stock has broken out and retested, therefore may undergo a reversal rally. Trade is supported by Supports Nearby.
Risk Reward Ratio - 2:1
SL is placed below the support zone & the lower trendline. The target is placed near resistance.

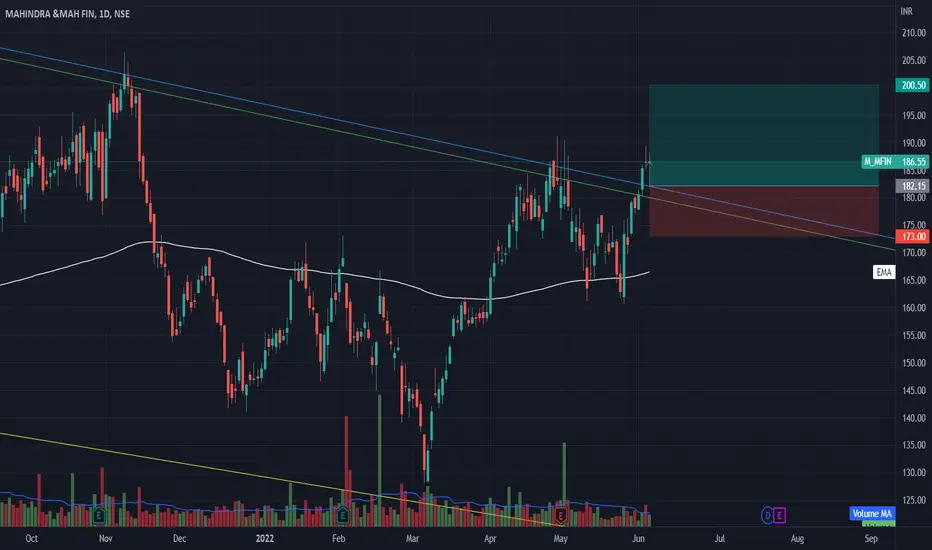
M&M Finance BreakoutThe stock has broken out and retested, therefore may undergo a reversal rally. Trade is supported by Supports Nearby.
Risk Reward Ratio - 2:1
SL is placed below the support zone & the lower trendline. The target is placed near resistance.
Jindal Stainless BreakoutThe stock has broken out and retested, therefore may undergo a reversal rally. Trade is supported by Supports Nearby.
Risk Reward Ratio - 2:1
SL is placed below the support zone & the lower trendline. The target is placed near resistance.

Endurance BreakoutThe stock has broken out and retested, therefore may undergo a reversal rally. Trade is supported by Supports Nearby.
Risk Reward Ratio - 2:1
SL is placed below the support zone & the lower trendline. The target is placed near resistance.

Fundamentally Good Multibagger Stocks To Invest (23/5/22)The Mentioned Stocks have the potential to become multi-baggers in a few years as they have good growth potential and good fundamentals. They are available at a cheaper valuation when compared to the market and their listed peers in their respective Sectors/Industries. It may be wise to distribute the investments into a number of stocks than a particular stock.
As most of these stocks are Small Caps/Micro Caps, they have great potential to provide returns and also offer higher risk. So it is a must to also invest in safer options like stable Largecaps/Midcaps and other instruments like Gold to bring stability to your portfolio. If you are a first time stock investor, make sure to also invest in safer stocks along with the above mentioned ones. Best Of Luck!
I have mentioned the Stocks, Their Sector, and Their Market Cap.
These Stocks were selected from portfolios of superstar investors. They were filtered using their-
EPS growth for the past 5 to 10 Years
Price/Earning Ratio
PEG Ratio
Debt Status
Price To Book Value
ROE%
ROCE%
Dividend Yield & Dividend Payout
Industry P/E, P/ BV
Comparison of Other Companies in Their Sector Or Industry.
Stocks in Green are good growing and fundamentally strong stocks.
Lincoln Pharma, Gravita India, Hinduja Global, Jindal Polyfilms.
Stocks in Yellow have less growth record but are fundamentally sound stocks.
Sharda Cropchem, Aarvi Encon, Vippy Spinpro, Sarda Energy.
This Stock in Red is a bit overvalued but cheaper in its sector and may offer good growth potential. But this is not a value stock and has higher risk involved.
Thejo Engineering.
Note:
These are my personal view and only for educational purposes, Not Responsible For P&L. DYOR Before Investing.

TATA Power BreakoutThe stock has broken out and retested, therefore may undergo a reversal rally. Trade is supported by Supports Nearby.
Risk Reward Ratio - 2:1
SL is placed below the support zone & the lower trendline. The target is placed near resistance.

NESCO BreakoutThe stock has broken out and retested, therefore may undergo a reversal rally. Trade is supported by Supports Nearby.
Risk Reward Ratio - 2:1
SL is placed below the support zone & the lower trendline. The target is placed near resistance.

TRENT BreakoutThe stock has broken out and retested, therefore may undergo a reversal rally. Trade is supported by Supports Nearby.
Risk Reward Ratio - 2:1
SL is placed below the support zone & the lower trendline. The target is placed near resistance.

Minda Corp BreakoutThe stock has broken out and retested, therefore may undergo a reversal rally. Trade is supported by Supports Nearby.
Risk Reward Ratio - 2:1
SL is placed below the support zone & the lower trendline. The target is placed near resistance.

VIP Industries BreakoutThe stock has broken out and retested, therefore may undergo a reversal rally. Trade is supported by Supports Nearby.
Risk Reward Ratio - 2:1
SL is placed below the support zone & the lower trendline. The target is placed near resistance.

BlueStar BreakoutThe stock has broken out and retested, therefore may undergo a reversal rally. Trade is supported by Supports Nearby.
Risk Reward Ratio - 2:1
SL is placed below the support zone & the lower trendline. The target is placed near resistance.

Rajesh Exports BreakoutThe stock has broken out and retested, therefore may undergo a reversal rally. Trade is supported by Supports Nearby.
Risk Reward Ratio - 2:1
SL is placed below the support zone & the lower trendline. The target is placed near resistance.

CEAT BreakoutThe stock has broken out and retested, therefore may undergo a reversal rally. Trade is supported by Supports Nearby.
Risk Reward Ratio - 2:1
SL is placed below the support zone & the lower trendline. The target is placed near resistance.

Rallis India BreakoutThe stock has broken out and retested, therefore may undergo a reversal rally. Trade is supported by Supports Nearby.
Risk Reward Ratio - 2:1
SL is placed below the support zone & the lower trendline. The target is placed near resistance.

Mid-cap Pharma Company might get a booster dose.Mid-cap Pharma Company might get a booster dose?
The 31,177.59 Cr. worth mid-cap Pharma company, Laurus Labs Ltd. gave a massive 96% CAGR (3yrs.) in the past. The share price of the company made a high of Rs. 723.55 after which it saw a downturn is now giving signals of its trend reversal to Bullish. The share price of the company made an 'inverted Head and Shoulders' pattern which is a bullish trend reversal pattern. Also, the share price might also see a 50 & 100 EMA crossover in the next 1-3 trading session which again makes it a positive for traders & investors. In clear words, the target for the share is 665 - 685, with a mid-term view of 2- 12 weeks. The stock might retest the level of 550 - 560 (precisely Rs. 555) which would also make it the ultimate support.
Also, please consult your financial advisor before entering into any trade. This piece of knowledge is shared only for educational purposes. Thank You & keep learning!

Rangebound KPIT Tech will break the range ?The 16,000 cr. mid-cap IT company, KPIT - Technologies Ltd. is about to give a breakout. KPIT Tech is a fundamentally sound company, firsthand. In the recent few weeks, the share price of this mid-cap stock was trapped in a range shown in the chart below with blue lines. The higher range of this stock is 601. Two technical indicators signal that this range might be broken soon. Firstly, the stock may see Crossovers of 10, 20 & 50 EMA (Moving Average) soon. Secondly, the stock is not overbought as the RSI of the stock is at 52 points (approx). Also, the stock made an Inverted hammer candle at the closing of Thursday, once confirmed this might make the stock more attractive. The target is between 660 - 675. Moreover, a trailing stop loss is recommended.
Also, please note that this information is only shared for educational purposes. Please consult your financial advisor before entering into any trade. This trade might involve the risk of capital loss.

Narayana Health BreakoutThe stock has broken out and retested, therefore may undergo a reversal rally. Trade is supported by Supports Nearby.
Risk Reward Ratio - 2:1
SL is placed below the support zone & the lower trendline. The target is placed near resistance.

Buy Blue Star @ 1065 SL 990 TGT 1266Buy Blue star at current price of rs.1065 sl 990 on closing basis target is 1266 , 1500 . risk to reward ratio is very good . i expect good return . please keep stop loss

Buy NMDC Above 152 SL 139 Target 185Lot of technical reasons for choosing NMDC . 1 As per Ichimoku in daily above cloud 2. as per renko 3% first time above 20/40 EMA line 3. as per candle RSI is above 62 which is first time after long time . Buy NMDC above 152 And stop loss is on closing basis of rs.139 . always keep stop loss

Syngene ReversalThe stock has reached lower trendline and may undergo a reversal rally. Trade is supported by brokerage calls and Supports Nearby.
Risk Reward Ratio - 2:1
SL is placed below support zone & the lower trendline. The target is placed near resistance.
Market is bearish, so take positions carefully.
