That's itHi everyone,
We are still in a wedge for Bitcoin. We took out the liquidity that resided above the last swing high, and right now the price is showing rejection, which is creating a new high, with liquidity that resides above it too.
In the following days, we might /witness some red days, which will make retail enter short, then test the 0.68 Fib level. After that, we might break above the resistance shown, retest, and then reach the 27,750 level.
In summary, we are going to see a move to the downside (short-term), then to the upside (mid-term), and finally continue our long-term downtrend.
Midterm

ETHUSDTHello trader
I hope you start a good trading day .
#ETHUSDT
⚜️Type: Buy
🎚EP: 1025
✅TP1: 1261
✅TP2: 1505
✅TP3: 1824
✅TP4: 2167
✅TP5: 2405
✅TP6:
✅TP7:
⛔SL:809
Midterm
If you like this post or have any comments, leave a comment for me here and share it with your friends.

BTC - Altseason is close!?!☝️On July 12 I told you guys exact scenario that happened on BTC. That first we have to go down with short squeeze and only then we can start a bull run. Let's look at how situation looks right now.
☝️What was the cause of volatility yesterday?
Inflation news from US. Inflation was higher than expected, hense we squeezed down, however overall economy is doing good and big money run from europe to US. That's why we rose.
☝️What now?
We broke local trendline on BTC and now coming close to global trendline that you can see on daily chart. It's 100 days long so potential move will be huge !
As soon as we break it we will finally change trend to complete bullish and start short altseason
What do you think of this idea? What is your opinion? Share it in the comments📄🖌
If you like the idea, please give it a like. This is the best "Thank you!" for the author 😊
P.S. Always do your own analysis before a trade. Put a stop loss. Fix profit in parts. Withdraw profits in fiat and reward yourself and your loved ones

BTCUSD midterm (3-4 months)Hello guys
the pattern is repeating itself again, we can expect a bearish market for the short term ( max 1 month) then it will be a bullish market.

Consider gold to be safe haven? Don't be so sure🔑 As inflation rises all around the world everyone turns their eyes to gold - safe haven during all financial crisis's.
However if you look at the chart, Gold came too close to the stop-losses of bulls, just below the demand zone.
When you expect something to rise, you always have to ask yourself - Who will pay for the show?
That's exactly why I think that we have to collect liquidity at the bottom of supply zone before going up and starting new bull rally.
Targets for such bullish momentum could be as high as previous top at 171, which is roughly 50% iincrease!
What do you think of this idea? What is your opinion? Share it in the comments📄🖌
If you like the idea, please give it a like. This is the best "Thank you!" for the author 😊
P.S. Always do your own analysis before a trade. Put a stop loss. Fix profit in parts. Withdraw profits in fiat and reward yourself and your loved ones

How far market will drop? Complete midterm BTC analysis🐻🐂Today many bulls woke up with horror in their eyes, BTC dropped once more and the drop is heavy.
Bears on the other hand, excited since a lot of shorts worked out well, I am one of them.
Let's look at BTC and see what's waiting for us here.
We broke the support at 20k and now heading down. Problem here is that there no strong levels nearby. Closest Levels that can become support are 6% away from here.
For intraday traders and scalpers it's a good idea to short this market. However, I wouldn't advise to do it today since most coins are at full ATR already, pullback should be expected.
To become bullish once again, we have to break the trendline on the chart as until we are trading under it, we are in bear market.
Also for bulls opportunities are not over as they can take bounces or local trendline breakouts when price reaches "Strong support 1" or "Strong support 2"
Always be careful, don't try to subdue the market, just follow it. And have strict risk-management!
What do you think of this idea? What is your opinion? Share it in the comments📄🖌
If you like the idea, please give it a like. This is the best "Thank you!" for the author 😊
P.S. Always do your own analysis before a trade. Put a stop loss. Fix profit in parts. Withdraw profits in fiat and reward yourself and your loved ones

BTCUSDTWe are still in a downward trend
I identified important areas of demand in 1H timeframes where we can hope the market will return
Otherwise we will go to much lower levels which is really terrible!!
Have these for now so I will update the analysis later BINANCE:BTCUSDTPERP

Stock Market during Mid-Term Election and Inflation AnalysisThis is a historic timeline showing the following:
Visuals:
1. Mid-term election years (Green Vertical Lines)
2. Peak Inflation (Yellow Vertical Lines)
3. Recession (Grey box)
Charts:
1. Inflation CPI
2. FedFundsRate
3. Unemployment Rate
You can note that there were two similar instances where inflation was getting higher during mid-term elections (1974 and 1980). In an inflationary environment, most likely the S&P bottoms when the inflation (CPI) has peaked. However, in 1980, the S&P went higher after mid-term elections despite inflation rising and having not peaked.
So the S&P can bottom anywhere from June to October ( possibly at $3200- Fib lower level ), then rally after mid-term elections. If post-mid-term election, the unemployment rate starts going up, it can lead to a recession in the upcoming years.
Feedback welcome!
References:
1. List of recessions: en.wikipedia.org
2. Mid-term elections: en.wikipedia.org
3. Stock Market post Mid-Term elections: www.usbank.com

BLZ - Midterm short, updating historical lows!BLZ had been in a game almost a week and a lot of people bought, as you can see from volume at high.
Right now there is beatiful daily trendline and one of my most profitable setups that I usually trade on lower timeframes. Since it's drawn on daily timeframe, potential for a move is huge as everyone sees it.
I expect price to at least touch historical lows since it's a reasonable level for such formation.
I will enter in a couple days, when price squeezes to the trendline and BTC will be bearish.
P.S. Always do your own analysis before a trade. Put a stop loss. Fix profit in parts. Withdraw profits in fiat and reward yourself and your loved ones

BTC Long Term Analysis - BearishIt's a possible scenario for BTC to keep the bearish trend.
It may fall again after completing the wedge pattern and the amount could be as much as last one.

BTC - New range is forming!We saw a beautiful bull trap by marketmaker. Today we may see another. As it's been for a couple months already, marketmaker is really savage and squeezes last onze of money from the market.
I expect to see new range for next days, the channel is pretty clear.
Locally we could trade alts in the direction of btc bounces inside this range.
Globally we still look down, as S&P continues to plummet.
What do you think of this idea? What is your opinion? Share it in the comments📄🖌
If you like the idea, please give it a like. This is the best "Thank you!" for the author 😊
P.S. Always do your own analysis before a trade. Put a stop loss. Fix profit in parts. Withdraw profits in fiat and reward yourself and your loved ones

Possible outlook BTC this year with Phoenix ascending and BBandsCharts says it all.
This is just a possibility. Changes in lower timeframes (weekly on up etc) may change all this. I just finished this and thought I might share.
Points of support found with 50, 100, 200 MA. Phoenix ascending by Wyckoffmode (David). And badass Bbands (bbands with different SD's). AND supportlines of simples previous supports.
Do your own research. NEVER listen blindly to what others say. If you can't understand the data; you. are. gamboling.


Ape going to touch ATH Im 100 percent sure it is long for ape and many huge news is coming for ape 💵💵💵
Go long

Mana should be wait for long? bit lower and İ think time to 3.35 4$
the MANA is one of the biggest cryptocurrency from the mataverse , we need to think in long term actually all crypto currency is droping , just will grow again, after BTC start a bull markert . my advice buy MANA , SOL , ETH , LUNA ,BTC , are great currencies .

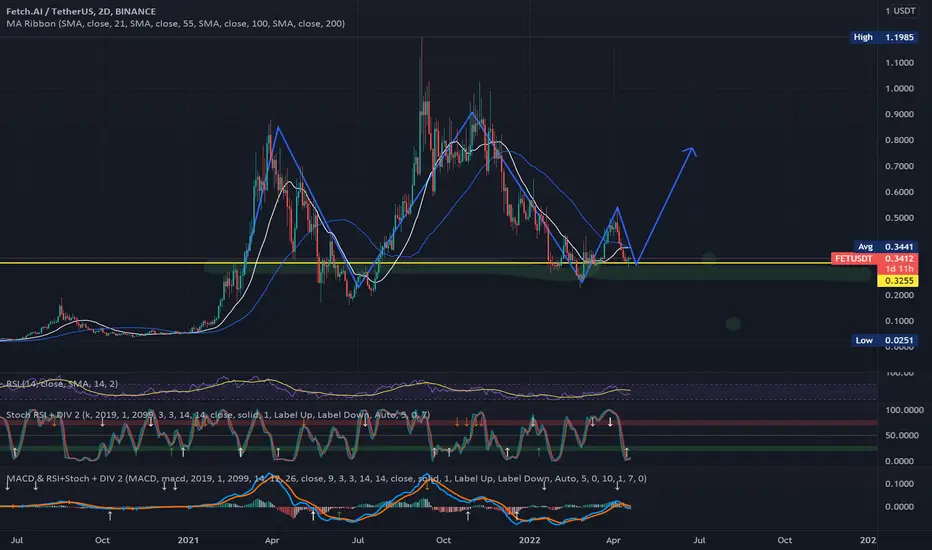
FET/USDT#FET/USDT ANALYSIS
###################################################################################################################################################+
It is holding above horizontal and trendline support. MACD crossover is loosing bearish momentum. As it is currently creating a higher low, so a good volume will confirm a bullish move from here and a sustain breakdown of the support would confirm bearish move. FET has real great project. you can buy it under 0.35
BUY ORDER < 0.344
SELL ORDER >= 0.37-0.70
Targets:
T1: 0.37
T2: 0.42
T3:0.47
T4: the moon
If u agree & like my trading still give me some like and follow me boss! love all of u !!!
HAPPPY TRADING!!!
Gold has Reached the PeakI found that Gold has been in Overbought position, as indicated by the RSI indicator. Here Gold will experience a daily/weekly price correction, with a profit target of $1800 (Demand Zone) and at the point of position (approximately) the Daily Moving Average line (WMA-200).

Brent (UKOIL) Price CorrectionAlmost the same as what will happen with WTI (USOIL) , Brent (UKOIL) will experience a weekly price correction marked by the Overbought RSI indicator, and with a profit target of $73 in the Demand Zone.

Time for WTI for Price CorrectionIt can be concluded from the analysis that I present, that there will be a weekly price correction for WTI Crude Oil. The RSI indicator is showing Overbought, and the price will drop to $72.17 based on the points of the daily Moving Average (WMA) indicator.
Hopefully my analysis can help or complement your analysis. Thank you.

WAVESUSDTit has big potential! when it start nothing will stop it. retest was successfully! now the begin!!!
BUY ORDER < 22.90
SELL ORDER >= 24-55
HAPPY TRADING!
if u agree my idea or enjoy it pls give me some like and follow me boss! love all of u !!!

XRP against SEC(((Since I value your time, I always provide a concise summary - feel free to request more)))
Fundamentally, I believe XRP is going well; the SEC was unable to provide sufficient documentation against Ripple.
Also, as the price is rising, please use a laddering strategy to enter retracements.

FTMUSDTFTM hat big potential! it is a creasy one, when move unstoppable!!
entry: 1.13->1.20
T1: 1.34
T2: 1.54
T3: 165
T4: 1.98

Bitcoin / USDT MidtermRSI on the daily is already at the overbought area. Volume is decreasing. The buying power is insufficient at current levels. Seems like the second leg of a corrective wave going to bring the price of BTC/USDT below 30K.
