The "I can't sleep trade" Shorting Junior MinersShorting juniors using long JDST. Trade will be invalid based on a daily close above the trend line.
Tips:
Don't use margin
Trade with what you can afford to lose
Expect extreme volatility
try to get some sleep ;)
Miners

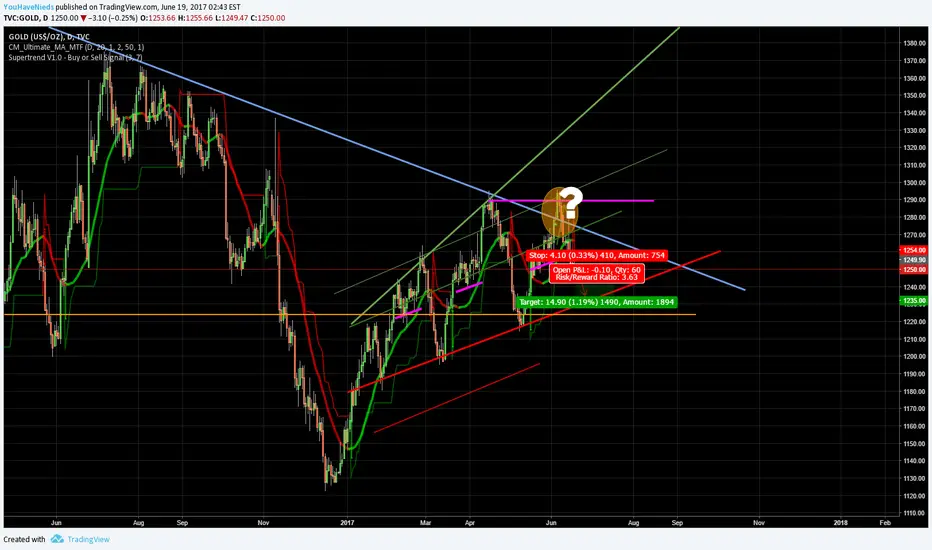
Short GOLDI will short gold. It will most likely keep going down to the trend line.
Then comes an opportunity for gold to break the huge monthly trendline starting from 2011.
SL: 1254 TP: 1235
?The question mark?: On the monthly timeframe we see that the candle closes below the trendline and not actually over it. This still shows potential for it to go lower.
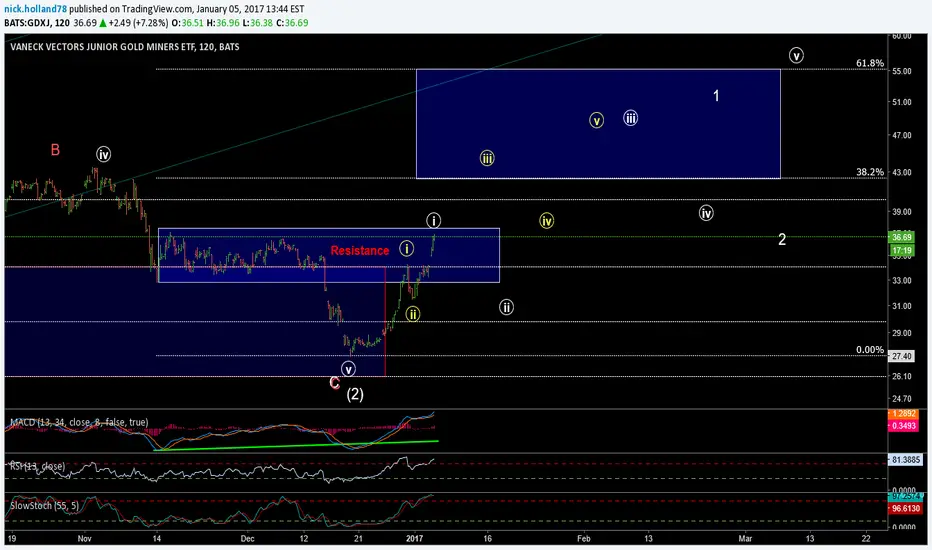
GDX - Gold Miners at a Critical JunctureThe miners are reaching a pivotal point that will determine the price pattern over the following months.
In my previous post back in Feb, I provided a count and stated that the GDX would be bottoming at around $20 before resuming the bullish trend. While the count is still valid, wave (ii) has protracted longer than what I had initially expected as we are still in that same corrective wave.
I still expect the bottom to hit around the $20 mark and would like to see a strong move upward above $24 in the following weeks to confirm the start of wave (iii) of 1 that would take us to at least $30.
However, should the price fall below $19, it would invalidate the current count and make me more bearish in the short term.
The next couple of weeks are going to be critical as the pattern unfolds.
Stay tuned for more!


Gold miners heading lowerMiners have had an amazing run for most of 2016, but now it's time to get back to reality. The over-all monthly trend is still DOWN, and markets don't turn around on just one bounce like we've had at the beginning of 2016.
This retest is the bears trying to continue the bear market, will they succeed? I don't know; I'm here to make money, but I know they will retest and try to breakthrough the 12-13$ level.
If they succeed, then it's just an expected continuation of the bear market in miners, if they fail and another bottom is formed; then we might start thinking of an emerging bull market.

Long Gold. Pattern recognition. Interest rates, etcThe following chart presents an opportunity to go long on gold and miners if wanted. The pattern has already presented in several occasions, highlighted in green boxes.. I believe the rate hike has been priced in. We can observe such pattern in the following chart before a significant move up Observe how I detected the bottom the last time, breaking out of the down trend.
Targets of course are marked by Fibonacci retractments. Of course, this is not for scalping.
Support is set at 1196 where the 200 moving average is located in this 8 hour chart.
Also, the Bollinger bands have widened, allowing gold to continue higher. Bullish cross of the macd is also present.
www.tradingview.com
This image shows how the yield in the 10 year note behaves before the rate hike (date of the 2016 hike marked in red). The yield moves down and when the hike occurs it goes higher temporarily. As we know, short term rates are set by the Fed, long term rates by the market. I believe yields will continue to move lower after the hike or perhaps before if the pattern holds.
s3.amazonaws.com

GDX - Trend Reversal in Miners To Start SoonThe current drop has many investors thinking that the long term correction in the miners is still ongoing. However, the current price movement is playing out more as a short term corrective wave (ii) of a larger degree wave 1 that should take us above $30 sometime this summer.
I am currently expecting a bottom to be reached somewhere above $20 before the resumption in the bull trend. While a drop below $18.60 would invalidate the count and have me reassess the outlined pattern, it looks less likely to play out at the moment.

JNUG ready to rock? JNUG missed an opportunity for a bullish Exponential Moving Average cross up over the past couple weeks. Felt horrible for anyone (...uh...guilty) who bought in the late Jan/early Feb thinking that insane movement was THE start of another wild bull run like 2016. I've improved my average to $9.40 by buying in the $6's. Using the Fibonacci Extension Tool on the Dec 2016 swing low to the swing high, I see a very precise touch on the 0.236 Fib line on this deep retracement, and expect this to be as bad as it gets. It could touch it again (and again and again) as this crazy market (and especially miners, and especially leveraged ETF's) love to play head games with the little guy/girl to shake them out when the circumstances appear the most dire. Stay strong, be smart. Use those simple, powerful indicators to make your decisions. But don't be stubborn either. I like the indicators I've used here, and in a minute I'll post a different chart with another simple one you can use.

A Perfect Bubble on the 1hrAfter last week's auction which sparked US yields to rise it was obvious that a GDP miss in Japan would fuel US yields to higher intra-day highs. $US10Y and $USDJPY are closer correlated than $DXY and $USDPY because Japan is the largest holder of US Treasuries. Keeping all this in mind tomorrow Yellen will likely pivot back to hawk triggering gold to dip back to 1210-1208 by Wed. and the miners should sell-off strongly.

GDX - Miners on the riseThe miners are following the same bullish pattern as gold and silver, having resumed the bull trend as a wave 1 of an extended wave (3) which should take us to $30 over the next couple of months and very likely north of $50 over the next year.
A drop below $18.60 would invalidate this count, though it seems unlikely given the current setup.

Stock exhausted!! LIFETIME opportunity in a miner!!Stock exhausted!! LIFETIME opportunity in a miner!!

Gold to Re-target 1220-30 During the Transition of PowerMy initial target on this pullback was 1190, however gold has managed to regain 1200 as the $DXY has rolled over giving up today's gains. Longing from these levels may be risky, but the reward may turn out to be lucrative depending on the volatility and uncertainty during the transition of power in the U.S. government through Monday. President Trump's speech will be interesting tomorrow @ 12:00 EST. Keep in mind that a number of executive orders may be repealed on Monday.

Gold Needs a Strong Shakeout to Make Fresh HighsAfter Failing to reach 1220, gold is showing signs of short-term overbought. Don't rely on Yellen to talk gold up today as the $DXY is making higher intra-day highs.

A Chance for Gold to Target 1220Trump's recent "saber rattling" comments about China should send gold to 1220 over the next 48hrs. Today we've seen some demand from Asia pushing the price to a new high @ 1208. I'm loaded on $JNUG for Tuesday. I think there is a good chance to make a decent 10-15%.


gdx miner cyclefor those who follow cycles, here is my chart of the gold miners cycle.
this chart forecasts that as of 1/12/2017 we are due for a miners cycle low in the second part of january 2017.
this cycle will give us hints as to the Trend of gold.
The current Daily cycle looks right translated (the high is in the second half of the cycle) and has gone higher than previous cycle (see arrows).
if the bottom of this upcoming gdx cycle closes Above the previous daily cycle low (see line labeled "Critical level" - we must find a cycle bottom Above that line), it will make a strong signal that the daily cycle Downtrend is Over and we are starting a new Daily cycle uptrend UP.
In plain language as long as we dont make a lower cycle low, it is a strong signal that gold is now in a long term uptrend!
so it looks like there maybe a good Short trade here for a few Days, and then once we bottom, a good Long trade if we dont break the low.
same cycle applies to GDXJ


CDE - 2hrMonstrous +13% day. Shallow wave (2) relative to other miners, assuming its complete. A pattern like the one I've outlined for wave 1 would add confidence. Retraces may be relatively short and shallow if this is, in fact, the start of wave (3). Note structure of wave (1) off the low last year.
As always, my notes aren't meant to indicate timing.

GDXJ - 2hrSome individual names have patterns suggesting this more immediately aggressive yellow pattern within minor wave 1, whereas others the white minute i-ii structure. I'd like to see the resistance region taken out over the next week or so regardless.
GDX - 2hrFor reference against some of my individual miner ideas posted. Remember, each individual name has its own pattern.

SA - 2hrI was early on Seabridge Gold. Should have stopped out but the swing position was small...may look to add to this position on a retrace.
SA dipped below ideal wave (2) support but has a solid impulsive looking move so far off the low. Need to see something like this 1-2 play out if wave (3) is indeed underway.

RIC - 4hRIC held above the 61.8% extension of presumed wave 4 of (3). Slightly different pattern than what I'm tracking on some other names, so the nature of this presumed impulsive move will be an indication if something else is operative. I plan to take swing trade profits above 15, or else stop out as the pattern dictates.
