pennies to thousands long term junior miner candidatealways diversify with miners -put in limit prices-see in our book on amazon how to do this correctly-stop loss 8 ema close-with stock doubled its presence in golden triangle area-all indicators look good-with juniors have good money management spread risk
Miners

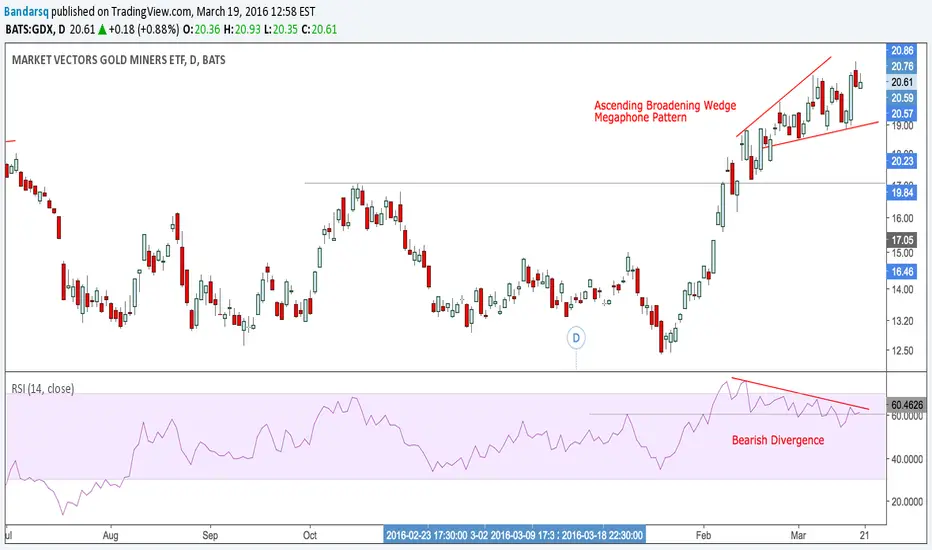
GDX: Time at mode uptrend with two targetsGDX has traced a nice accumulation pattern, after the monthly downtrend expired in September 2015.
It's currently confirming a time at mode uptrend which aims for two possible targets, 23.21 and 30.67.
Considering the monthly downtrend mode resistance sits at 23.89, the first target seems way more likely to get hit.
I'm long from a discretionary entry I took a day ago, but you can enter either now, or on a slight retracement, with stops under 19.51.
Good luck if taking this trade.
Cheers,
Ivan Labrie.

Gold/Silver Ratio 4/20/2016The big direction of this ratio is obviously down, and there are only three ways this ratio can go down: 1. Silver going up and Gold going down; 2. Silver going up more than Gold going up; 3. Gold going down more than Silver going down. #3 is very unlikely and #2 is most likely. Personally, I'm long both metals.

Amadeo Ratio 4/19/2016Use it with benevolence and love. Use it to pursue peace and serenity. Keep in mind that Doing cannot do much without Non-doing.

SPY/XME/USO/GLD/SLV Ratio 4/18/2016 (Short-Term View)Watch the lines. This chart tells us when to switch from bubble assets to contrarian assets.

SPY/XME/USO/GLD/SLV Ratio 4/18/2016 (All-Time View)Watch the lines. This chart tells us when to switch from bubble assets to contrarian assets.


GDX WEEKLY CHART -- MINERS BREAKOUT, CASH WONT BE KING FOR LONGWith all the NIRP's and ZIRP's flying around in an economy based off fraud and debt, this was expected, and now we have the start of the technical indicators to back it up :)
My target area Short Term is 25-28:
- We have the 23% fib retracement from our move down from our All Time Highs in 2011.
- Weekly 200 ma
- Solid price action (horizontal black lines)
- Broke out of our channel to the upside that start in June 2013
-- If tomorrow (April 12th) holds above this channel, that's when I shoot my final bullet
- The top of our bigger channel is in this area
Feel free to comment with questions or ideas :)
Happy Trading!

first majestic breaks 200 daymetals are strong broke 50 and 200 day look for minor pullback and then run

GDXJ, WeeklyI know nothing of gold except what ZeroHedge tells me to think, but, boy, that's a lot of volume. Maybe time to ease in this or NUGT if you think an up trend is beginning.

GDXJ Potential Short SetupThe Junior Gold Minors GDXJ finished a wave 3 down on the daily chart. It has now completed an abc correction into wave 4. The MTPredictor indicators generated a TS2 automatic sell signal at 27.14 with a stop at 29.77. The initial target is 21.99 which is the minimum wave 5 target. If price does not hit 27.14 (the entry) and instead moves above 29.77 first, then the trade is invalidated.
If the Swiss referendum fails, we may see further declines in these stocks.

Now that BearWhale (Draper?) has exited — are we est new supportThe accumulation is actually up, which hopefully means people are buying at this level, establishing a new support.
I'm not jazzed about a $330-350 support level, but it's better than not knowing where the floor is at.
Still, my miners are shut down, until it's cool enough to use them for heating, or BTC goes above $400 again.

NEM and the Gold SectorYou will see this base across many gold related stocks including the miners. Looking for a continued move higher out of the base. Will most likely use the daily stochastics to time exit. If we cross back down on the daily stochs I am out . also Like the GLD, and holding GLD

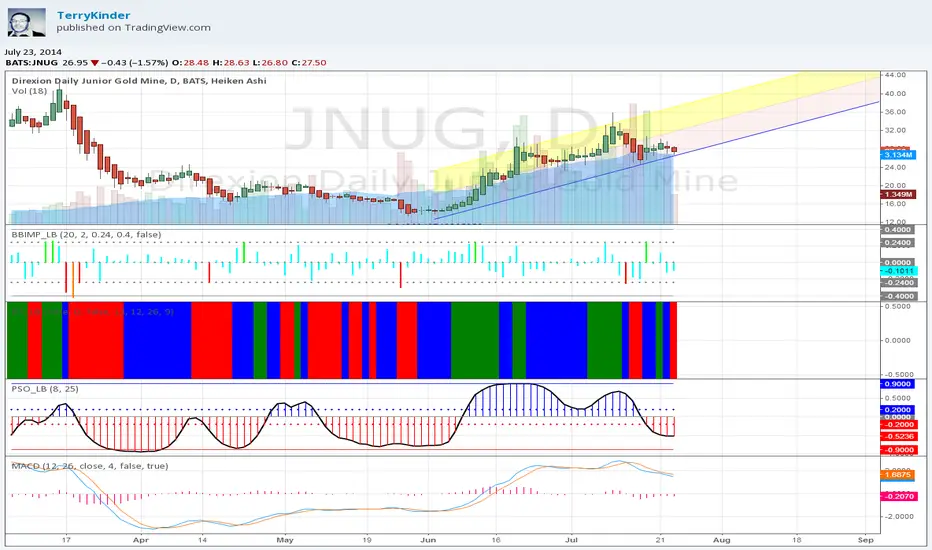
JNUG Setting up for a Move Up?JNUG has been in an ascending price channel since near the beginning of June. As of 7-23-14 12CST, it is nearing the bottom of that channel.
Currently indicators such as EIS, PSO, BB Impulse, MACD (see indicators underneath price chart) indicate downward price momentum. However, there are some indications that some of the indicators could reverse.
Should the Premier Stochastic Oscillator turn up accompanied with a bullish crossover in MACD then, given past history, we could see a move from the bottom of the price channel to the top (or slightly above) of it. This could represent something along the lines of a $10-$11 move on a stock that is well under $30 at present.
The GDX Could Be The Next Great Trade In 2014 Recently, the gold and gold mining stocks have surged higher over the past three weeks. The highly followed Market Vectors Gold Miners ETF (NYSEARCA:GDX) jumped higher by more than $4.00 a share since May 29th, 2014. Today, the Market Vectors Gold Miners ETF is trading lower by 0.37 cents to $25.90 a share. The GDX is now overbought on a daily chart, so a pullback over the next couple of days to weeks should be somewhat expected. While a pullback is possible, traders and investors must now keep an eye on the weekly inverse head and shoulder pattern that is forming on the chart. A weekly chart close above $26.00 a share on the Market Vectors Gold Miners ETF would trigger a buy signal for the pattern. The target for the bullish inverse head and shoulder pattern indicates a move up to the $35.00 area.
Leading gold mining stocks such as Royal Gold Inc (NASDAQ:RGLD), and Goldcorp Inc. (NYSE:GG) also have the same weekly chart head and shoulders pattern as the Market Vectors Gold Miners ETF (NYSEARCA:GDX).
Please understand that these patterns have not yet triggered, so until they do these equities could still be somewhat volatile in the near term.
Nick Santiago
Chief Market Strategist
www.InTheMoneyStocks.com

Gold Miners $GDX may be heading for a reversal A Gartley and a Cypher pattern is pointing to the same exact destination for a sell reversal. We have previous structure at $31.31 & $29.38 coupled with confluence with two 1.27 extension ratios. $29.95. and $28.96 at the .786 retracment will be our kill zone.
******************************************************************************
For inquires of education, live trading room, or prop trader funding email
epicdaytrading@gmail.com
Skype: epicdaytrading
PH: +1 940-448-0281
******************************************************************************

GG broken out of retracment box, Is it still bullish?With the gold miners stocks tend to have a very volatile behavior. They correlate with the equities market as well as physical gold. Hence they tend to gap up and down. That's just its personality. Looking at the long term view, it still looks bullish and the inverse head and shoulder is still intact. Possible morning star reversal forming if it if gaps up tomorrow. (Other miners like GDX, SLW also have the same reversal pattern and have respected the retracement levels). For the miners to be bullish from this point onwards, the equities market and physical gold has to become bullish.( or physical gold has to be more bullish that the equities market, if the recent selling and market correction is to persist. Ignore intra-day volatility and focus on the long term view. Swing/ position trading
