Possible short on further fed funds hikes down to $5I expect more downside in miners if perceived hawkishness from the fed is maintained. Soon though, they'll cave and sacrifice the dollar to do what they think will save the markets, which will lead to an explosion in precious metals. These miners will be the ultimate levered trade on the coming fed pivot so be ready to reverse to long.
Miners

$MARA ~ Still correcting...As shown in previous update, correction continues and expect lower prices as shown. Possible opportunity soon but not yet. Will be interesting soon and will continue to track closely.

$HUT ~ Watching the show...As shown in previous update, correction continues and expect lower prices as shown. Possible opportunity soon but not yet. Will be interesting soon and will continue to track closely.

FIRST MAJESTIC SILVER - PRESSURE BUILDINGThis is a weekly chart of AG, First Majestic Silver Corp. I like to call this pattern a giant compression wedge - it's just a simple descending triangle. But considering this is on the weekly timeframe, it's a mammoth-sized wedge. I like the pattern but I really like the company. I'll try to focus on the technical analysis, but First Majestic looks incredibly well positioned for what's unfolding in the metals market. They have their ducks in a row.
If you follow my ideas, then you'll know how I feel about precious metals. I believe we're facing a perfect storm that will propel precious metals & miners to incredible levels. The monetary circus, supply & demand, inflation, gold:silver ratio, and the commodity cycle are just a few of the ingredients in the recipe.
I'm torn about direction. Equities, the dollar, precious metals, and the miners are in a pivotal place. The dollar looks like it's trying to find a bottom. It's possible that the metals, miners, and equities get pushed down hard again.. potentially another crash. Having another crash in equities, metals, miners, etc.. would be my preferred path because I suspect that it wouldn't last long.. Inflation is coming but don't rule out another deflationary hiccup. I like to buy stuff cheap and so I'll be thrilled to have another discount. Watch the dollar. I think we're going to know soon.. and watch First Majestic. It would be incredible to have it tag (E) of this wedge. The measured move of this pattern is somewhere around 39-40 but a move from $4.00 to 40 is a 10x compared to the 2x it is from current prices.

Newmont: Nearly There!Newmont has been following our primary scenario and has as good as reached the ideal destination for wave ii in magenta near the lower third of the magenta zone between $69.49 and $56.42. Thus, it should soon turn around and move upwards. However, there remains a 40% chance that Newmont could drop through the magenta zone and below the support line at $52.60, which could then entail a continuation of the descent below the next support at $46.07.

GDX weakness and bullish failurePrevious analysis appeared bullish, but the price movements in the last two weeks since failed.
The weekly chart instead of following through with the bullish indications, reversed into a weekly gap down and further down for the next week. Weekly technicals are weak and suggest some bearishness.
A clear failure for the GDX ETF to break above the weekly 55EMA.
The daily chart shows how the weekly gap down developed, starting with a gap down that broke down of the gap range. This range was tested and failed for more downside in the following week. finding support at 29.
The technical indicators are bearish indicative, and downside target is currently 27.60.
Bearish breakdown in the works!

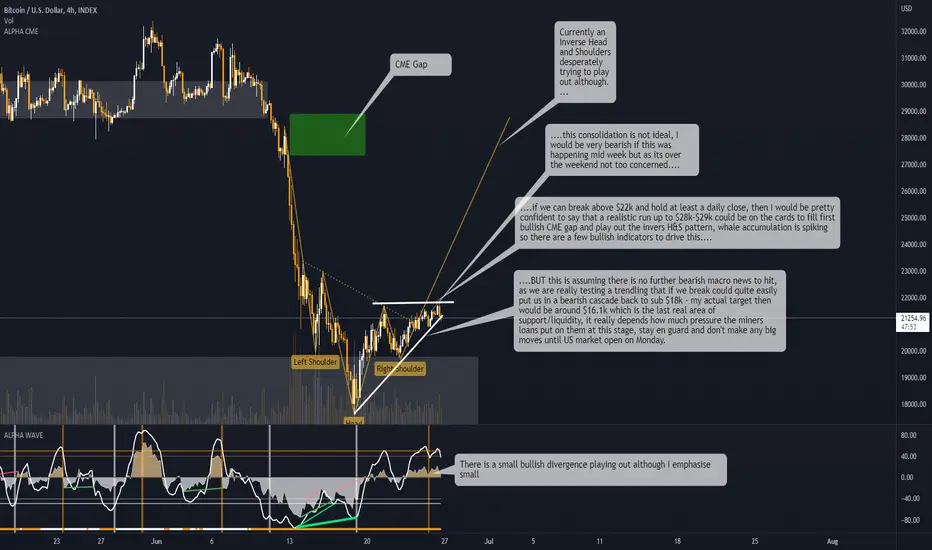
#BTCDAILY - 26/6/22#BTCDAILY
26/6
Overall looking 60:40, bullish:bearish.
We have to break $22k if we want to see $28k come in and CME gap filled.
We are at the mercy of institutions unloading stockpiles to secure margins (or any other crazy sell off's in this space), any further negative announcements from FED and Miners being forced to unload BTC due to loan repayments being enforced.
We DO want to see exchanges coming in to pad out their BTC holdings more, positive rumours of the spot ETF and also Ripple case for that matter and increased whale accumulation.
If we get bad news and break the trendline downwards then it will get very rough, I have moved down my low target from $17.5k to $16.1k before re-assessing.
Keep it sensible, keep it in spot and don't make any big moves till after US market open tomorrow.
Parabolic Setup on the Mining JuniorsThis is a very asymmetric trade setup with nearly blue skies to 100 if it can catch some momentum in the coming sessions.
We also have a nice little fractal that shows us the path upward, should we break 49.
I would not front-run this one and would wait for 50+ daily close before a serious entry. With this level of confirmation in pocket, I'll be taking a rather aggressive stance.
Its a clear magnet-move to 100 - if for no other reason than it being one of the only decent plays available.
=PigMagnet
AMEX:GDXJ
TVC:GOLD
TVC:SILVER
MCX:GOLD1!
MCX:SILVER1!
ASX:GOLD
AMEX:GDX
NYSE:GOLD

Agnico: On Track!Despite smaller counter movements, Agnico continues to follow our primary scenario. We expect it to fall below the support line at $45.42, which should confirm further descent below the next support at $31.03. However, there is a 32% chance that Agnico could chose the other direction and cross the resistance at $74.50, thus reinforcing upwards movement above the next resistance at $89.16.

Pan American Silver: Aquanaut 🤿So far, Pan American Silver has only been snorkeling along the surface of the blue pool between $21.88 and $13.94. However, we expect it to put on its diver’s gear and to plunge deeper into the water to finish wave (ii) in blue. Afterwards, Pan American Silver should emerge from the depths and rise above the resistance at $40.11. There remains a 38% chance, though, that Pan American Silver could lose its compass in the blue zone and dive deeper and deeper, even below the support at $10.61. Once there, it should tumble further below the next support at $5.38 as well.

Starting to build positions in gold and silver minersWe just hit a major support for this stock, so I am starting to build a position. I'll take out half at the next resistance and hold the rest in case we break resistance and see an explosion in price.

Vox Royalty to C$4.50Vox Royalty (TSX-V:VOX) Corp has told investors it expects to report royalty revenues of between C$10 million and C$12 million in 2022—more than double what it realized in 2021—as it also revealed it has acquired a producing royalty on a Western Australian iron ore mine.
The royalty, purchased from a private vendor, is a 1.25%-1.50% sliding scale gross revenue royalty (GRR) on the Wonmunna mine operated by major Mineral Resources Ltd (ASX:MIN).
Vox is paying US$4.75 million in cash, US$12.15 million in Vox shares, and issuing 3.6 million share purchase warrants with an exercise price of C$4.50.
"The Wonmunna royalty acquisition further expands the revenue and growth profile of Vox and is accretive on all key metrics," said Kyle Floyd, CEO of Vox in a statement.
"The opportunity to add significant, immediate, incremental revenue through a non-brokered accretive transaction with a private seller generates significant value for Vox shareholders for years to come.
©Proactive Investors
The line that I find most interesting is 'warrants with an exercise price of C$4.50', as the current price action is hovering above C$3.00. For the vendor of the Royalty to find this deal acceptable they must have looked at Vox Royalty Corp and seen what others clearly can not see. And that is a 50% increase in value at the minimum.
Warrants and Call Options Similarities
The basic attributes of a warrant and call are the same:
• Strike price or exercise price – The guaranteed price at which the warrant or option buyer has the right to buy the underlying asset from the seller (technically, the writer of the call). “Exercise price” is the preferred term with reference to warrants.
• Maturity or expiration date – The finite time period during which the warrant or option can be exercised.
• Option price or premium – The price at which the warrant or option trades in the market.
©Investopedia
For a strike price of C$4.50 to work, the share price needs to be above C$4.50 or otherwise the warrants have little to no value.

New Swing Alert - $GOLDBarrick Gold ($GOLD) - Daily hidden bullish divergence confirmed, with price reclaiming the 200MA in confluence with the 0.618 fib level. We can also see price has broken out of the short term supply line.
4R:R

GDX Interim Bottom?Just as Gold and equities plummeted over the last 4 weeks, GDX was in no way spared, losing at least 25% from 4 weeks ago. An absolutely deep retracement following Gold prices.
Daily candlestick pattern suggest a brief consolidation at current levels, 30-31.
Do not yet see a bottoming pattern... not yet.

$GDXJ to fall from here? $35 first, $20s next?GDXJ looks to be rejecting at resistance here which could setup a large move lower. I know everyone wants to be bullish gold, but both commodities and equities are starting to look weak here.
I think we're about to see a false breakout of the falling wedge and a break back below it down to $35 as the first target, and potentially the $20 range after that.
Green lines mark support levels. Let's see what happens over the coming weeks/months.

Gold Miner Breaking Through Demand Line Visible On The Monthly Just Like Gold itself i expect the Miners to experience severe Pullbacks in the upcoming Months

$SLV Long 50 JUL callsWent long 50 JUL SLV 23.5 calls.
Nice looking chart and I like the R/R on a move to at least the top of the box. Will reduce the position there and manage on price reaction.
Mental stop just below 30 wk MA.
Nice consolidation with accumulation type buying, cup and handle with a good retrace from the JAN to MAR move, I think it's going for next leg higher.
A break above the box should expect a massive move, as this has been digesting since AUG 2020.
If calls go farther ITM may sell bi-weekly calls against them to reduce my cost basis, playing it day by day week by week.
Miners and Metals look good overall, many above 30wk MA.
Cheers

GDX: Out of the BlueThis is GDX’s motto only literally because its descent from the blue zone between $43.86 and $39.30 was far from unexpected and indeed completely in accordance with our primary scenario. After completing wave (b) in blue in the blue zone, GDX has established itself on its way downwards, and we expect it to continue this trend into the magenta zone between $27.49 and $19.52 below the support at $28.83. There, GDX should finish wave (c) in blue and wave ii in magenta before rising above the resistance at $40.13. There is a 30% chance, though, that GDX could break through the bottom of the magenta zone and drop below the support at $16.18.


GDXJ Bull FlagGDXJ is showing some nice bullish divergence in the pennant of a bull flag on the 4hr and daily RSI. Upside is 30%+ and if it breaks down below the lows of the flag it'd be time to get out.
This is obviously dependent on what Gold spot price does. So, if XAU decides to finally use that hidden bullish divergence to head to all-time highs, then gold miners are gonna feast too. Playing the odds.

$SIlJ wants lower. $8-9 over the coming monthsOn high timeframes, we seem to be continuing the trend of forming lower highs. The rejection of price at $15.49 gives me the setup I was looking for to think $SILJ is going lower.
On top of the rejection, the RSI is overbought, the moving averages on ichi are stretched with price above the moving averages giving me reason to believe price will snap back lower, and I have a hard time seeing how price gets above the cloud (on higher timeframes, there's thick resistance w/ the clouds).
I think there's good reason to believe we're heading lower here. I think price will first head down to $11.66 but being its' already been tested as support multiple times, it's weakened and price should break through that support fairly easily. Which leads me to believe the next target on the downside would be $9.44 and below that $8.32 if that support fails to hold.
Let's see how it plays out over the comings weeks/months.

GDX continues rallyingTwo weeks ago, a break above 40 was expected , and it just closed the week above 40, in good fashion if I may say so.
The weekly GDX chart followed the previous week's long tailed doji and gapped up, ending near the week's high, with yet another lower tail. Bullish candlestick structure here. Technical RPM indicator is supportive of the momentum, although the MACD expects more.
The daily GDX chart is consistent with a continuing uptrend rally, with higher highs and higher lows. Technically supportive, both the RPM and MACD are crossed up and trending bullishly.
47.50 upside target in sight as projected previously.

$HUT - 2 Chances HUT broke down from the inverse head and shoulders. It even has candle confirmation - spinning doji followed by bearish engulfing. It is fair to say that the IHS is NEGATED.
I see 2 bullish scenarios here on $HUT . In this order:
1. Bullish divergence on $HUT. It can bounce righy here on the 4.50 support and see much higher levels: 4.8, 5, 5.5 and even higher levels.
2. $HUT loses the bearish divergence and goes for oversold zone (below 30 RSI and under). It can try to bounce here.
Thanks for reading. What do you think?
This is not financial advice. This is solely for entertainment purposes. Do not take anything from this idea as advice in any way, shape, or form.
