AG run?AG (First Majestic Silver) is looking good to us. Gold and the miners have been performing well so far. We see opportunity here. - HH
Miners

RUS's 5000/RUB/gram of Gold converted to implied USD COMEX valueRussia pegged its Rubles to Gold of 5,000 RUB/gram.
This is the implied value of Gold per troy oz. as shown in the paper Gold market (COMEX) in USD.
Will be the floor price of Gold

Time to long $HUTInverse head and shoulders. Moving with current market downside. I think BTC being at these level is a good indicator that we may see 60k sooner than later. Hoping a reversal occurs soon
This is not financial advice or advice in any form. Sole purpose is to entertain

Vox Royalty - Good updateAnother positive update from Vox Royalty Corp. ,
We just need to see the price action reflect the momentum on the ground.
Precious metals are holding up, so producers are able to make more money. Though inflation will hit them with larger CAPEX.
Royalty companies don't bare any of the extra costs but can a slice of the revenues.

Gold miners ETF (GDX) taking off again!The Gold Miners ETF, GDX, as expected, launched itself after a small recoil.
The Weekly chart key takeaway is that the MACD and RPM followed through, but better yet, this week saw the weekly candlestick to be in a rather bullish position, closing the week on a recent 9-month high.
Fibonacci projections bring a 47.50 upside target in the following weeks.
The Daily chart confirms the bullish indications similarly. Having bounced off an intermediate support, the technicals are turning bullish again as the strong close for the last day of the week encourages a breakout above 40.

GDX: Room for MoreFor GDX, there is still room for more upwards movement! As the ETF has only touched the blue zone between $39.30 and $43.86 so far, we expect it to go for it again and more firmly this time, crossing even the resistance at $40.13. After it has finished wave (b) in blue in the blue zone, GDX should rattle down through the support at $28.83 and into the magenta zone between $27.49 and $19.52, where it should complete wave (c) in blue as well as wave ii in magenta. Then, GDX should turn around and move upwards, heading for new highs above the resistance at $40.13. However, there is still a 30% chance that the price might not rise from the magenta zone but could fall through it and below the support at $16.18 instead.

Vox Royalty Smoothes Out VolatilityHaving multiple royalties within a portfolio means Vox Royalty has enough diversification to clearly smooth out the volatility.
High inflationary environments are great for commodities and equities, but for miners, there is an increase in costs and CapEx. Not so with the royalty company.
Their expenditure doesn't change but they have access to the widening profit margins when each of the producers realise their gains.
TORONTO, ON / ACCESSWIRE / March 8, 2022 / Vox Royalty Corp. (TSX.V:VOX)(VOTCQX:VOX) ("Vox" or the "Company"), a high growth precious metals focused royalty company, is pleased to provide recent development and exploration updates from royalty operating partners Gold Standard Ventures Corp. (TSX:GSV) ("Gold Standard Ventures"), Genesis Minerals Limited (ASX:GMD) ("Genesis"), Develop Global Limited (ASX:DVP) ("Develop"), Norwest Minerals Limited (ASX:NWM) ("Norwest"), and Alamos Gold Inc. (TSX:AGI) ("Alamos").
Spencer Cole, Chief Investment Officer stated: "The past month of royalty operator newsflow includes the exciting release of the South Railroad feasibility study, ongoing exploration success at Sulphur Springs, Puzzle North and Bulgera, capped off by consistent development guidance for Lynn Lake. Each of these projects are being aggressively progressed by well-capitalized operators towards near-term resource updates and development decisions. 2022 continues to be shaping up as a record year for the Vox royalty portfolio based on these developments."
Key Development Updates
Robust feasibility study released for the South Railroad gold project in Nevada by Gold Standard Ventures;
Exceptional drilling results set to underpin growth at Puzzle North gold project by Genesis;
Strong drilling results at the Sulphur Springs copper-zinc project by Develop are likely to result in a significant resource upgrade;
Positive drilling results at the Bulgera gold project by Norwest; and
Significant capital budget planned in 2022 by Alamos for the Lynn Lake (MacLellan) gold project.
South Railroad (Pre-Feasibility) - Robust Feasibility Study Released(1)
Vox holds a 0.633% net smelter return royalty with advance minimum royalty payments over key portions of the South Railroad gold project, which is located in the prolific Carlin Trend of Nevada;
Vox has been receiving advance minimum royalty payments from Gold Standard Ventures since October 2021;
On February 23, 2022, Gold Standard Ventures announced the following feasibility study results:
After-tax IRR of 62% and NPV5 of US$487M at Spot Gold Price (US$1,899.20 per ounce) and after-tax IRR of 44% and NPV5 of US$315M at US$1,650 per ounce gold ("Base Case Gold Price");
Payback of 1.6 years at Spot Gold Price and 1.9 years at Base Case Gold Price;
29% increase in Mineral Reserves to 1.6 million gold ounces;
10.5-year operating life with total gold production of over 1 million ounces, with an average gold production of 152,000 ounces over the first four years;
Launch of construction financing process, targeting 75% from non-equity sources, to be completed this year in advance of final construction permits; and
Orion Mine Finance to provide Gold Standard Ventures with a term sheet of up to $200 million to support the construction of the South Railroad Project.
Vox Management Summary: These compelling feasibility study results closely match Vox management's estimates formed during due diligence for the South Railroad rancher royalty. This high-return project is being fast-tracked towards a first production target in 2024, based on Gold Standard Ventures management guidance.
Kookynie (Pre-Feasibility) - Exceptional Drilling Results at Puzzle North Discovery
Vox holds a A$1/t production royalty on part of the Kookynie gold project(2);
On February 3, 2022, Genesis announced:
Outstanding new results from reverse circulation ("RC") drilling across multiple areas, confirming potential to expand the mineral resource at the Ulysses Gold Project near Leonora in Western Australia;
Broad, high-grade zones of gold mineralisation intersected from shallow depths in RC drilling at the Puzzle North Discovery, including:
21USRC1186: 27m @ 8.18g/t Au from 30m;
21USRC1190: 34m @ 13.36 Au from 42m, including 1m @ 382.6g/t Au from 68m; and
21USRC1192: 29m @ 2.91g/t Au from 52m;
Drilling at Puzzle North has now defined mineralisation over 600m of strike and up to 100m width, with the mineralisation remaining open both at depth and along strike;
Mineralisation at the southern end of the Puzzle pit extended over 200m south with results including:
21USRC1114: 11m @ 2.20g/t Au from 82m;
21USRC1119: 4m @ 9.07g/t Au from 92m;
21USRC1123: 5m @ 5.98g/t Au from 79m; and
21USRC1127: 47m @ 1.07g/t Au from 95m;
A large drilling program is currently being planned for the Puzzle North to Puzzle corridor.
Vox Management Summary: This exciting gold exploration royalty that Vox acquired for less than A$150k in 2020 is being rapidly drilled to include the royalty-linked Puzzle North discovery in an expanded feasibility study at the Ulysses gold project. The potential development timeline for this project from exploration to development continues to exceed Vox management expectations.
Sulphur Springs (Pre-Construction) - Strong Drilling Results Point to Significant Resource Upgrade
Vox holds a A$2/tonne production royalty (capped at A$3.7M) on the Sulphur Springs copper-zinc deposit and an uncapped A$0.80/tonne production royalty on the Kangaroo Caves deposit, which is part of the combined Sulphur Springs project;
On February 10, 2022, Develop announced:
It has now received ~60% of the assays from the A$10M resource infill and exploration drilling program at Sulphur Springs;
The drilling has been highly successful, with numerous high-grade mineralisation intersections of more than 50m, significantly thicker than anticipated and with two of the intercepts being the thickest intersections achieved in the project's history;
The results point to a substantial conversion of Inferred Resources to the higher confidence Indicated Resource classification;
The upgrade in Indicated Resource classification will pave the way for Develop to update reserves, mine development plans, project costings and to finalise funding options;
Exploration drilling has also returned outstanding results, paving the way for an increase to the total resource;
A resource update is scheduled for mid-2022; and
Preparations for construction of the exploration decline are proceeding rapidly with the approval request submitted. This will be pivotal because it will enable drilling to be conducted faster, and cheaper and brings forward capital/access to the underground deposit.
Vox Management Summary: Under the new leadership of Northern Star Resources founder Bill Beament, the Sulphur Springs project is on track to be expanded in resource size and fast-tracked into underground decline development within the next 12 months. This drilling success indicates that the potential economics of this high-grade copper project are improving month to month.
Bulgera (Exploration) - New High-Grade Drilling Results
Vox holds a 1% net smelter return royalty over the Bulgera gold project;
On February 3, 2022, Norwest announced:
The first three of seven diamond drill holes extend new high-grade gold lode to beyond 400m down dip of the shallow Bulgera open pit;
Drill results included:
BDD21003: 11.3m @ 3.25g/t gold from 260m (downhole), including 4m @ 4.5g/t Au from 260m and 3.3m @ 5.3g/t Au from 268m;
BDD21001: 16.5m @ 1.20g/t gold from 128m and 3m @ 4.10g/t gold from 166m;
BDD21002: 6m @ 2.07g/t gold from 195m;
It is sourcing a drill rig to undertake the Phase 2 diamond drill program (targeting March/April 2022) which will test mineralisation to ~700m down-dip of the Bulgera open-pit; and
Norwest's CEO, Mr. Charles Schaus commented: "Assay results from the first 3 diamond holes confirms that strong gold mineralisation extends beyond 400 metres down dip of the shallow Bulgera open pit. Once the gold assays from the remaining 4 diamond holes are received (over the coming weeks), the Company will commence re-modelling the Bulgera gold resources which should add considerably to the current, 94,000-ounce, gold resource reported in April 2020".
Vox Management Summary: Norwest management are now guiding towards a remodelled and expanded resource estimate for the past-producing Bulgera gold project which would increase the value of Vox's royalty. Oxide ore from Bulgera was last processed at the nearby Plutonic gold mine in 2004 and given the haul road remains in place, credible near-term development options are available for Bulgera.
Lynn Lake (MacLellan, Feasibility) - 2022 Capital Budget
Vox holds a 2% gross revenue royalty (post initial capital recovery) on part of the MacLellan deposit at the Lynn Lake gold project;
On February 23, 2022, Alamos announced:
the total capital budget for Lynn Lake in 2022 is US$14M, including US$11M for development activities and US$3M for exploration;
Development activities will be focused on environmental work in support for permitting detailed engineering and other site access upgrades; and
The approval of the Environmental Impact Statement for the project is expected in the second half of 2022, following which Alamos expects to make a construction decision.
Vox Management Summary: Alamos management has been very consistent in guiding towards a 2022 construction decision at Lynn Lake and is currently guiding investors towards 2025 first production in its corporate presentation. Alamos' 2022 capital budget further supports its consistent project development guidance.
Qualified Person
Timothy J. Strong, MIMMM, of Kangari Consulting LLC and a "Qualified Person" under National Instrument 43-101 - Standards of Disclosure for Mineral Projects, has reviewed and approved the scientific and technical disclosure contained in this press release.
About Vox
Vox is a high growth precious metals royalty and streaming company with a portfolio of over 50 royalties and streams spanning eight jurisdictions. The Company was established in 2014 and has since built unique intellectual property, a technically focused transactional team and a global sourcing network which has allowed Vox to become the fastest growing company in the royalty sector. Since the beginning of 2019, Vox has announced over 20 separate transactions to acquire over 45 royalties.

Vox Royalty - Genesis Minerals LtdKookynie (Pre-Feasibility) - Exceptional Drilling Results at Puzzle North Discovery
Vox holds a A$1/t production royalty on part of the Kookynie gold project(2);
On February 3, 2022, Genesis announced:
Outstanding new results from reverse circulation ("RC") drilling across multiple areas, confirming potential to expand the mineral resource at the Ulysses Gold Project near Leonora in Western Australia;
Broad, high-grade zones of gold mineralisation intersected from shallow depths in RC drilling at the Puzzle North Discovery, including:
21USRC1186: 27m @ 8.18g/t Au from 30m;
21USRC1190: 34m @ 13.36 Au from 42m, including 1m @ 382.6g/t Au from 68m; and
21USRC1192: 29m @ 2.91g/t Au from 52m;
Drilling at Puzzle North has now defined mineralisation over 600m of strike and up to 100m width, with the mineralisation remaining open both at depth and along strike;
Mineralisation at the southern end of the Puzzle pit extended over 200m south with results including:
21USRC1114: 11m @ 2.20g/t Au from 82m;
21USRC1119: 4m @ 9.07g/t Au from 92m;
21USRC1123: 5m @ 5.98g/t Au from 79m; and
21USRC1127: 47m @ 1.07g/t Au from 95m;
A large drilling program is currently being planned for the Puzzle North to Puzzle corridor.
Vox Management Summary: This exciting gold exploration royalty that Vox acquired for less than A$150k in 2020 is being rapidly drilled to include the royalty-linked Puzzle North discovery in an expanded feasibility study at the Ulysses gold project. The potential development timeline for this project from exploration to development continues to exceed Vox management expectations.

Update on PMs vs Cryptos right now. Gold, Silver, BTC, ETHI designed this custom chart to monitor the relative strength of top precious metals gold and silver versus top cryptos bitcoin and ethereum, to their respective ratios.
As you can see, there is a compression triangle of sorts that has formed and looking to determine which way it will break out.
The bottom is supported also by this arc spanning a much larger time horizon.
The fundamentals favor PMs.
All this together leads me to believe we are headed UP in gold/silver relative to cryptos.
None of this is financial advice.
If you're seeking a platform to trade between cryptos and precious metals (and fiat if you like), check out Kinesis. Their gold and silver on blockhchain are real, allocated, audited, and deliverable (at a very reasonable price I might add). Really the best of the best. Check out their informational videos to learn more:
kms.kinesis.money

DRD GOLD If gold's price continues to stay elevated and push higher then I believe DRD Gold will push higher too.
It has broken out of the trend line and looks set to move higher, which coincides with gold breaking out too.
Strikes aside, I think pullbacks will be an opportunity to add to positions.
Price targets are highlighted on the chart, with predetermined profit taking prices along the way.
Profit taking started today, which also coincides with the strike actioned that was served to Sibanye Stillwater.
My price target within 12 months, barring any economic meltdown, is R22 (+- 50% return)
My stop loss will be set below R11.50.
Disclaimer,
I have been accumulating DRD gold since R11,50, and have taken profits recently, will look to add to existing positions again in large pullback like today (9th March 2022)

$URNM - Available At a DiscountRussian forces recklessly shelled a nuclear plant last week.
This led to a sell-off over concerns that countries might take a step back from nuclear power.
This turned out to be an emotional overreaction. The plant was completely safe, and only an administrative building was damaged.
Uranium plays are now available at a relative discount.
According to Reuters, "The United States relies on Russia and its allies Kazakhstan and Uzbekistan for roughly half of the uranium powering its nuclear plants - about 22.8 million pounds (10.3 million kg) in 2020 - which in turn produce about 20% of U.S. electricity, according to the U.S. Energy Information Administration and the World Nuclear Association."
"There is no uranium production or processing in the United States currently, though several companies have said they would like to resume domestic production if they can sign long-term supply contracts with nuclear power producers. Texas and Wyoming have large uranium reserves.
Australia and Canada also have large reserves of uranium and there is ample processing capability there and in Europe. But Russia and its satellites are the cheapest producers."
So with the White House considering sanctions on the cheapest available uranium, the price of this commodity will undoubtedly rise over coming weeks and months.
According to World Nuclear Association, "Russia has substantial economic resources of uranium, with about 9% of world reasonably assured resources plus inferred resources up to $130/kg – 505,900 tonnes U (2014 Red Book)."
This seems like a great play for a move back above $100.

$GDX Gold Miners WeeklyGDX weekly nice chart with Triangle breakout and volume increasing with MACD opening up all implying more room to the upside.
I'm in April 35/40 debit spreads and looking for 40 as the first price target.
XME (metals) Gold Silver all appear to be ready to make a bull run, keep these on your watchlist especially with some weakness still in the equities market.

Decade of GDX Channels"Market Memory" is illustrated well in the long-term support and resistance lines of GDX

GDX Nice breakout here so farGold and miners might be finally ready to make a run with a nice breakout of resistance line here. MACD showing bullish confluence and 9/20 moving average cross
I'm long april 35/40 debit spreads

GDX... Launched!The Gold miners ETF had a clear launch over the last two weeks, amidst the build up of the global events in Europe.
The Weekly chart has a sustained double breakout of a short term trendline, and the weekly 55EMA. The technicals (MACD and RPM) are very supportive, crossing upwards and into bullish territory.
The Daily chart shows the past two weeks developments, nothing short of being impressive and decisive. An immediate term resistance is seen, but am optimistic that the Gold miners have launched from the base low, at long last.
As previously mentioned... Gold prices have since moved significantly to above 1900, and equites are on the rise.
This are supportive of the GDX. Currently, a slightly stronger USD is disregarded and off set by the previous two.
GDX has since moved up 10% and is slated for much for upside, way above 40 IMHO. Projections in a later following post...

Dark Cloud Cover at PCZ of Bearish Bat on PlatinumNot Much in the way of indicators except your RSI is slightly overbought and that's about it but in General this Price Action is pretty Bearish and you'd expect a decent move down from here.

Gold and precious metals miners are setting up ... !I am not GOLD bull - i read charts. Feels like the price action is confirming what we see happening outside of markets.
i recently read a report that someone was secretly buying gold at around 1800 and putting it aside - based on yahoo search- here is the copy of it:
(Bloomberg) -- Spot gold is again bobbing along near $1,800 an ounce, as it has been since mid-2020. The stickiness of that level, particularly as fundamentals turned more bearish, suggests there’s a big buyer somewhere in these waters. (...) That would suggest that whoever is buying is able to buy in scale, leave little footprint in the market and then take delivery and store the metal in secure, invisible vaults. And that points strongly toward a sovereign buyer.
Today i share with you few tickers and price action on XAU.

GDX about to break out?It has been many fake outs, but yet again, the GDX is attempting to break out, one that starts with a nice long bullish marubozu type of candle on both the weekly and daily chart.
The weekly chart had a gap and run marubozu, with MACD turning upwards but not yet in bullish territory, nor clear of the 55EMA.
The daily chart had a decent long bullish candle that is supported by the technical indicators.
What needs to happen over the following week is a proper breakout and sustaining above resistance turned support levels.

Fed Fund Rate Vs US 10Y Vs GoldHere is an interesting comparison of the 3 charts. If the history of these charts has taught us anything, there is going to be a rise in rates on a real rate basis more so than actual rates. What is more interesting is how this real rate rise will influence gold prices. Now gold isn't bitcoin, they are the exact opposite things. One is front-loaded with energy and the other requires perpetual energy in addition to one having mass vs one having no mass. The risk-off appetite will be a big player here. I can see rebalancing to add gold to your account of 5-10% and reducing bonds to offset this is smarter now. Adding the 1-2% bitcoin position will make sense as the risk-off bottoming occurs.
Gold miners will be smart soon, but not yet. Pick your miners now, Barrick, Newmont, Agnico Eagle, Wheaton Precious, FrancoNevada, Sandstorm, etc, and hit the bid when they tank along with equities. (This is a time to add additional bitcoin as well)

NU440 Miner Deal with Sphere 3D Put it on your watchlist, supposedly they just made a deal that would be a massive game changer if true.
The NU 440 has 4.5-5x the hashing power with less energy usage compared with the top asic miner available.
Sphere 3D would be way ahead of the game if this is true. DYOR NFA

Three Falling Peaks On The Gold Miners ETFThe Gold Miners don't look like they are setting up to have a very good time as they have made Three Consecutive Lower Highs and have penetrated the line of support it's been holding. Just from looking at this pattern and how we are trading in between the 55 and 200 week Moving Averages and Preparing a Weekly Death Cross it would seem that it is setting up for a +40% Decline in the near future so long as it continues to make Lower Highs.

GDX Lame Duck ?This week, the GDX did a lame effort to test the 55EMA, if you could even call that a test. Hence, the 55EMA failure was pretty much a lame effort too. This downward consolidation is growing lame and old, but it does appear to continue perhaps for a bit more as I do not yet see strength in the accumulation... having said that, when it comes, it is likely to be rather overwhelming.
For now, the same zone is pushed forward as a Buy Zone or Break Zone.
This is like fishing... all is lame until the big bagger comes, when it really comes, it comes with a hard fight!
Stay safe!

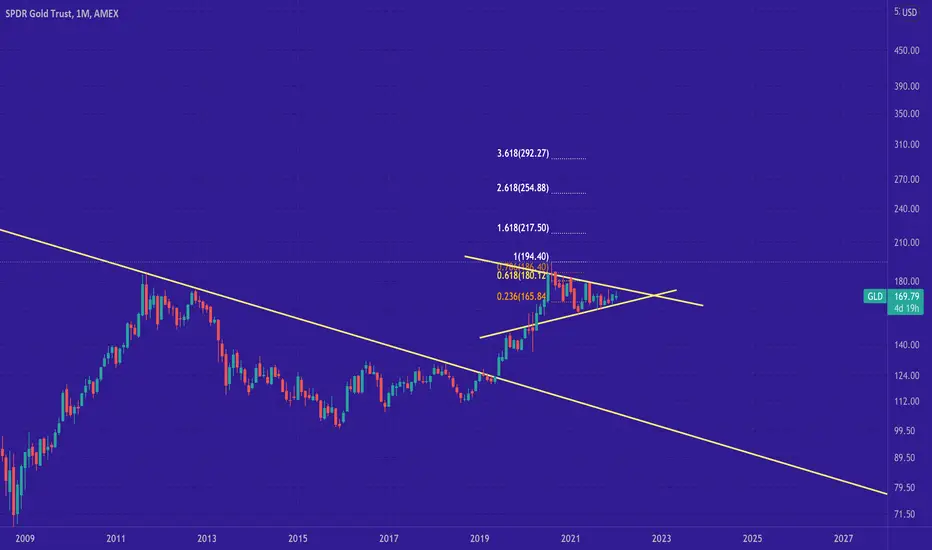
Gold ~ GLDI want to see a breakout to the upside between now and march and i'm quite confident it comes.