Turn Around time for ALTURA?Update to previous chart,
looks like we are complete with the ABC?
time for the beginning of a new cycle, a wave 3 of 3 could be approaching.
LONG bullish
Mining

gpu tech bubble alertOverpriced gpu tech stock in a bubble. Correction sooner or later now that ETH mining will half soon.
Bitcoin fundamental analysis: energy consumption unsustainableBitcoin's energy consumption is out of control.
The network's energy needs come primarily from mining. The current industry standard miner is still the Antminer S9 from Bitmain. The power consumption trend is proportional to global hash rate which continues to increase exponentially, yet innovation in the mining sector has stalled since 2016. Recent developments in 2018, i.e. 10nm ASICs from Innosilicon and 7nm ASICs from GMO have not brought any significant increases in efficiency, please see this chart .
It is unlikely that a breakdown in price from here will be sustainable for miners over any prolonged period, i.e. bear market, that is probably why market makers have prevented this from happening. Without increases in efficiency a bear market will not be possible as energy consumption is too high already.
However a bull market will lead to unbelievable energy requirements and the world is well within its rights to demand cessation of mining (which can be legislated against, indeed UK facist-liberal daily the Guardian advocates just for that Bitcoin’s energy usage is huge – we can't afford to ignore it ). It is not really possible to estimate a reliable figure due to various hidden costs (be suspicious of anyone that says otherwise), but even back of envelope estimates such as mine put Bitcoin's electricity consumption as being the equivalent of 0.2- 0.4 % of global electricity consumption.
There are simply too many miners and too much hash rate. Satoshi once said he thought in the future mining would be performed on specialised farms, of which there would be around 100 worldwide. He never considered mining pools and he didn't care much about the lack of decentralisation in mining. And I am assuming he never expected the global hashrate to reach the tens of millions of terahashes. (Currently 45,000,000,000,000,000,000 hashes/second). Koomey's Law states that computing power should double every 1.6 years on average. Well Bitcoin mining has far outstripped this and without significant increases in miner efficiency (exponential increases), proof of work in its current form is dead.
Miner Specs
Hash rate: 13.5 TH/s
Power: 1300 W
Efficiency Calculation
E = 1300 W / 13.5 TH/s = 92.3 W/Th/s (Watts per Terahash)
Weekly Power Consumption Calculation (chart)
P = Global Hash Rate * E / 1000000 * 24 hrs/day * 7 days
(we divide by 1000000 to convert from Watts to Megawatts, i.e. 1 MW = 1,000,000 W)

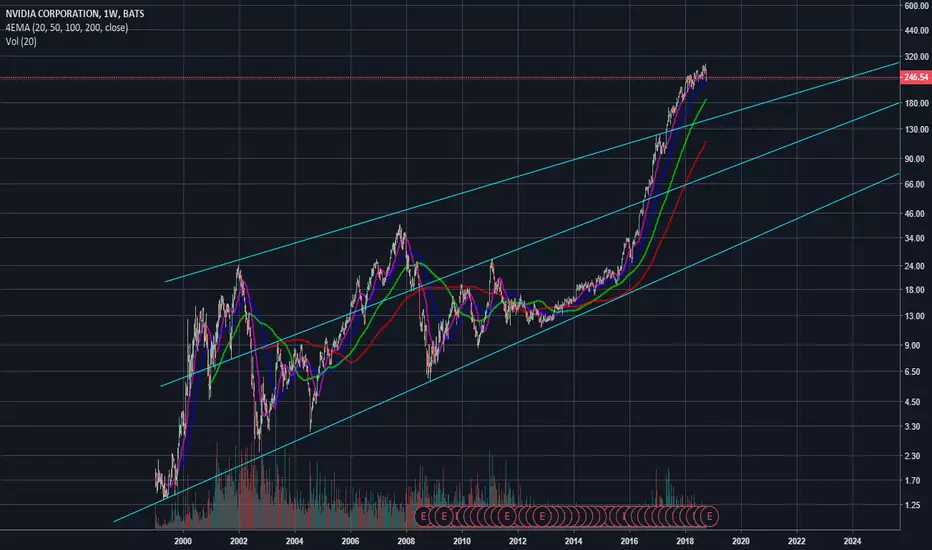
A diatribe on NVDAThis is my diatribe on why I am staying away from Nvidia.
There are many facets to this business that go under peoples radars, but the most important from an earnings perspective especially with the state of the general purpose hardware arms race, is the mining metric that they like to throw around and that those numbers are a lie. It's also a flat out deception that they claim to have left the mining space.
Their percentage of sales figures for mining uses comes from cards that were designed specifically for mining (IE the P102 and P106 cards). When they talk about crypto sales declining, they are talking about those cards, when they talk about profits from miners they are talking about those cards.
This has always bothered me; They never discussed this metric openly until recently when they announced they were "leaving" the crypto space, which is something they don't have a choice in. The fact is that their record sales that have created their current bull market are more based in mining operations than in gaming computers, and there is no way they could ever have a metric for mining sales unless they were discussing cards that were designed for mining. Which means they themselves are either in the dark in regard to how their GPUs are being used which I find unlikely or they are misleading the general public because the numbers they are aware of are far more grim than they want to let on.
They have somehow convinced the general public that miners only buy mining specific GPUs and that the "gaming" gpus are not being used by miners. That is a deception, the run on GPUs was not created by gamers but by miners. And with the miners not having a general interest so far in the RTX branded cards due to potential performance and the abhorrent cost there will be a fairly large gap in earnings that will be difficult to make up.
With the mining issues aside, NVDA is making a huge bet on the future of games. They are attempting to become the APPL of GPUs by locking people into their specific architecture for ray tracing performance, Apple can do this because they create a life style around their products, Nvidia will have a more difficult time convincing people to lock themselves into a single part in a PC for the foreseeable future.
Another issue that is present is the performance of the cards for the price you are paying. The 2080 and 2080ti are not showing benchmarks that highly outshine their predecessors on non ray trace specific games. Sure the RT reflections and soft shadows are really cool and add a really pretty flare to your overall gaming experience, but does it completely change the games enough for a person to spend $1200 on a single GPU? Let alone a person who is a hardcore gamer who cares more about their kill count than if they can admire themselves in the window they just ran buy. If the FPS in something like GTAV which is not optimized for ray tracing is 90 with a 2080ti and is 80 with a 1080ti the benefits are obviously not strong enough for a person to spend $1200 on.
The final thing that was bothersome to me was the tear down and benchmark embargo that Nvidia placed on the reviewers they sent early cards to, this to me would indicate that they knew the overall numbers would be disappointing and that they wanted to keep people on the hook for their preorders without trying to get a refund.
I think overall earnings are going to be disappointing, and there will be a resulting painful realization for NVDA holders. Only the future will tell, but right now things are not looking great on the horizon.
This is not investment advice, only my personal outlook on nvidia and their current state of affairs.

HBM - Mining stock with good entry to short or longHudson Bay Minerals is 50% off January high and mining not favorite for many but it's
in small-cap under $10 stocks that can give good double digits this year.
Turning up off baseline entry as copper futures are also turning around.

IVPAF - Ivanhoe MinesSmall cap Mining Stock to own when VIX jumps 5% like yesterday. Entry 1.79
Development and recovery of precious and EV specialty metals: Nickel, Copper, Gold, Palladium, Zinc, Germanium, and Rhodium.

CCJ - NYSE CCO - TSX Powering the grid Cameco Corp. Mining Uranium stock likely recovers in breakout of FIB retracements 0.5 (recent down) and 0.382 (recent up) and near 9.81 or drop below 9.50 to 8.95-9.25 resistance.
Point of interest:
* Uranium prices beaten down since 2011 Fukashima Reactor melt-down and back-up generator cooling failures from psunami hitting Japan.
* Japan shuts down all of the 32 Nuclear Reactors to assure public safety and clean-up causing global Uranium (Ur) prices to tumble to where it now is.
* Nuclear energy is still a paid for and quite reliable energy source with proper safety measures, which Japan now has and plans to restart.
* No. Amer. power also relies on nuclear power, which Pres. Trump will not import from other countries supporting demand.
* This is one of several plays, which is safe haven mid to large-cap mining stock and away from volatility (VIX) moneyballers like, as VIX up near 5% each of last 2 days.
Viewers come to own conclusions. Like, share, comment.

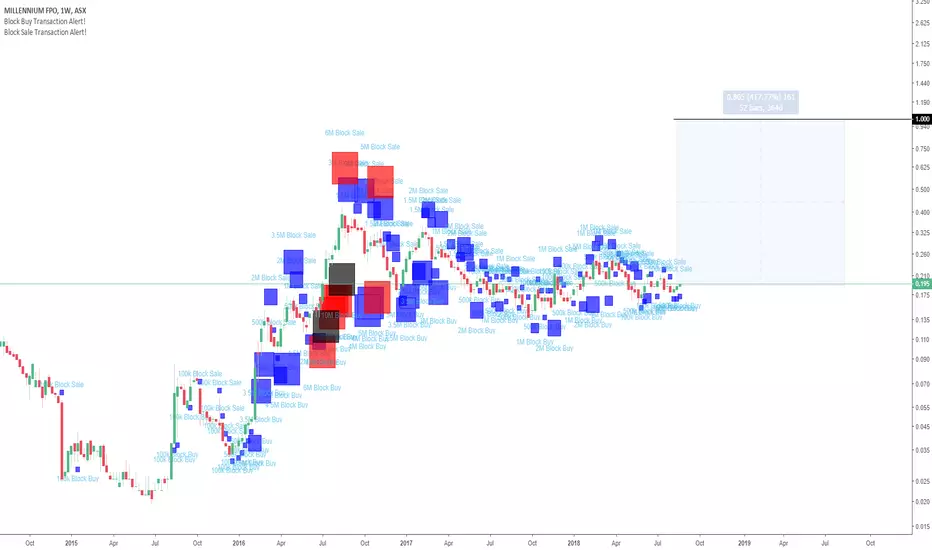
ASX:MOY Institutional Investment Millennium Mining is very well run and operated. Institutions around Australia have weighed in on the success of this company and the stock price is set to soar as retail realises they are sitting on the sidelines. Conservative figures put this stock well over the dollar mark within the next year (large returns).
Spot price gold has also experienced an over-extended slump, leaving ASX:MOY nothing but positive news ahead.
A Larger Correction Might Be Underway for VALEThe Cycle Wave 5 top (and Supercycle Wave 1 top) was most probably on the week of the 14th of May 2018 (please reffer to related idea).
NYSE:VALE now seems to be on an Intermediate Wave C which is part of the Cycle Wave A down.
If this count is correct we should still expect Intermediate waves B and C.
Only after Cycle Wave C, the last part of Supercycle Wave 2, should we see the hallowed Supercycle Wave 3. \o/
Best idea for now is to step aside from the stock and wait for signs Supercycle Wave 3 is around the corner...

Ethereum death window, based on fundamental analysis Hi i hope to have good time
Today i want to calculate ETH death window based on fundamental analysis!
what's the meaning of death window ? i called lowest price and lowest time period after that all of Ethereum network crash and dead, after this price mining is not profitable and all the miner switch off their machines .
lets calculate this price:
All of us know ETH network generate new block after 14.5 seconds and today block rewards is approximately near 3 Eth.
I would like to estimate how much miner paid for electricity to generate a single Ethereum for this purpose we need to chose sample and formal miner devices and total network hashrate .
base on my experience from mining optimum mining rig with 6 GPU ( optimum GPU card ) cards are able to generate 180 MH with using 1.2 Kwh electricity,
from last published idea i found average electricity rate is 0.1189 $/Kwh .
==========================================================
how many mining rig we need to build today Ethereum networks ?
total Ethereum network speed is 287,486.80 GH/s ( refer to etherscan.io) so we need 287486800 MH/s / 180 MH/s = 1,597,149 mining rigs
this bunch of devices is using 1,916,579 Kwh,
during an hour Ethereum network generate near 757 ETH
today a single ETH cost = total eth network electricity * electricity cost / total ETH during an hour = 301 $
=========================================================
i will update this post when we are moving in downtrend again.

A dangerous descentThe price was able to overcome the next level without problems and continues to decline. At the current time the next level of support is the mark of 6.200.
Given the fall in the value of the cryptocurrency, mining becomes less profitable and may soon become unprofitable. The only winners in the fall are traders. In case of falling volumes of mining, prices may again rush down.
Since our technical indicators point for a sale, we believe that at the current moment it is worthwhile to take short positions and consider the point for fixing of the profit at the mark of 6.200.

BMN Long EWTBUSHVELD MINERALS
• BMN trading near all time highs
• Both Wave 3 and Wave iii are in motion
• Momentum studies positive
Currently trading near all time highs, Bushveld Minerals (BMN) still has room to continue higher. A rally begun with a gap after a year long consolidation period. With a high at 24.50 reached in May, BMN saw a correction back to the 17.10 level - finding support. The Elliott Wave 1 subdivided into a Minute impulse wave. Wave iv retraced 38.2% of the Wave iii advance, stalling inline with the 17.10 support level. Wave iii and Wave v tops saw bearish divergence, warning that a corrective phase was near. Wace C saw bullish divergence, again, giving a potential warning that the correction is over, and a new impulse move was about to occur.
More recently however, BMN has had a solid advance, breaking above a psychological level of 20.00, and breaking above the May high of 24.50. It has given back some of its gains however, retracing and holding the 21.70 level. This has formed a new wave i and ii count equalling Wave 3 of higher degree.
With BMN just hovering below 27.00 it has much more room to rally as it is in Wave 3 of both degrees. Though not always the longest wave, it has potential to move to 32.00. This level is the point at which Wave 1 = Wave 3. The RSI favours the bullish picture and reinforces the potential for a move higher. A possible retracement to the uptrend line is also possible and would be a great opportunity to go Long. Longs can also be entered at the break above 27.00 if a more conservative approach is preffered.

STORJ the future of decentralized Digital storage [BTFD]I featured STORJ in my post from early Nov'18
was a huge profit maker and one to watch for this year
after a good rally in last few days we can entertain some good long positions for this active coin which actually has a working product... (one of the few in crypto)
retraced from last major highs, lets meet these targets before we try for the ATH (which was based on a very very well timed token swap)
If bitcoin comes down again to lows then we might have a new floor but looking at the COP (Cycle of Power) indy it still needs some more upwards momentum, something we may see in the coming months if the markets goes more bullish on alts
HOW TO TRADE?
Aggressive traders would start buying up on the pull back, the recent rally hit the 0.786 level and dumped from there creating a possible pullback to watch
More cautious traders will wait for the fib to be broken and move up into the next gann fan area for confirmation of a bull trend
red line is the baseline trend
good trades, plz tip or leave a comment if this or other trades we select make u profits, even if its for a beer/smoke all welcomed
more on STORJ....
Storj is decentralized cloud storage that applies blockchain technology for processing transactions that are entirely safe, secure and done without third parties interfering. It is the first decentralized, end-to-end encrypted cloud storage that utilizes blockchain technology and cryptography to guard your files. Currently, STORJ is trading at $0.515 per unit. It is predicted that by the end of this year there will be a hike in the value of STORJ and it will rise to $1.27. But we cannot entirely rely on these values because fluctuations can happen at any time.
coinpriceprediction.net

$BRVRF Enters Into Agreement with Global Satellite IntegrationBlue River Resources First Step in the process of integration forward was a 30% stake in GSIL a private British Columbia Company based in Vancouver, BC. Looking forward to the next upcoming updates from this soon to be conglomerate.
www.otcmarkets.com
Vancouver, British Columbia--(Newsfile Corp. - July 9, 2018) - Blue River Resources Ltd. (TSXV: BXR ) (OTC Pink: BRVRF) (FSE: 0BL) (the "Company" or "Blue River") ( www.blueriv.com ) is pleased to announce that it has entered into an agreement with Global Satellite Integration Ltd. ("GSIL") which agreement provides for the acquisition by Blue River of a 30% interest in the share capital of GSIL for total cash consideration of $50,000. GSIL is a private British Columbia company based in Vancouver, BC. GSIL provides satellite bandwidth and related services to mining companies. The acquisition includes a participation right for Blue River to retain its post-acquisition pro-rata interest in GSIL should GSIL issue further equity as well as the grant to Blue River of a right of first refusal by the two current shareholders of GSIL. The transaction has been accepted for filing by the TSX Venture Exchange. orders.newsfilecorp.com
GSIL and its management have extensive experience working with mining companies and government to provide Internet and telecom access to mining companies regardless of their location. Blue River recognizes that stakeholders in mining such as the local government and the surrounding community of a mine site or large exploration site require some level of corporate social responsibility as part of gaining the "social license" to explore and exploit their natural resources. GSIL can bring the internet to these communities, regardless of their location, which can enhance Blue River's relationship with local communities, where Blue River could conduct exploration or mining activities. Blue River believes that having an ownership in this expertise will enhance its ability to bid for or acquire mineral concessions and the required exploration or mining permits in rural areas of the world.
Blue River's main focus remains mineral exploration. The Company continues to explore its Castle Copper Project near Princeton, BC, on which the Company has recently received a NI-43-101 report recommending a two phased exploration program.
ON BEHALF OF THE BOARD
BLUE RIVER RESOURCES LTD.
Griffin Jones
President, Director
For further information contact:
Griffin Jones
Tel: (604) 682-7339
www.Blueriv.com
Neither the TSX Venture Exchange nor its Regulation Services Provider (as that term is defined in the policies of the TSX Venture Exchange) accepts responsibility for the adequacy or accuracy of this release.

$BRVRF Continues Rising in Anticipation of its 1st UpdatesOn Feb. 27, 2018, Mr. Martin purchased 500,000 common shares of the company on the open market. This purchase increased his holdings to approximately 12.8 per cent of the total issued and outstanding shares of company.
As of the date of this report, Mr. Martin has approximately 24.55 million common shares of the company, representing approximately 12.8 per cent of the common shares of the company, plus 6.05 million warrants. If the warrants were exercised by Mr. Martin, the total shares held by Mr. Martin would be 30.6 million or 15.4 per cent of the issued and outstanding shares of the company.
Vancouver, British Columbia--(Newsfile Corp. - June 12, 2018) - Blue River Resources Ltd . (TSXV: BXR ) (OTC Pink: BRVRF) (FSE: 0BL) (the "Company") announces that it has received a NI 43-101 report on its 100% owned Castle Copper Project located near Princeton BC.
The report was written by Mr. Sean Butler, P. Geo., and recommends a two phased exploration program consisting of IP geophysics and soil geochemistry in phase 1 and contingent on positive results in Phase 1, 2000 meters of NQ diamond drilling in Phase 2.
The area of interest that the exploration program will focus on is the Christian Creek zone where hole no. BXR 11-9 returned 198 meters of 0.04 % copper from 30 meters to 228 meters.
Several companies are exploring this region for porphyry copper deposits from Copper Mountain Mining and Sego Resources to the south, to Antofagasta Minerals to the north and Kaizen Resources in Aspen Grove BC.
The Company is reviewing additional opportunities in the resource sector as well as the non-resource sector.
Neither TSX Venture Exchange nor its Regulation Services Provider (as that term is defined in the policies of the TSX Venture Exchange) accepts responsibility for the adequacy or accuracy of this release.
So far I have not observed any dilution and the company does not currently have any dilutive convertibles or aggressive debt. The company is clean and continues to be accumulated in anticipation of further updates which some have said could be very substantial.
This is a Long term hold for me, around 2 years. I anticipate a PPS of $10 by then given the current Share Structure.

Antminer S9 ROI: Bitmain vs Retail over 1, 1.5 & 2 yrsThis is in addition to my previous chart on miner roi for different Antminer models. The S9 is the only model making a profit now and is the only sha256 miner currently used by Bitmain according to news articles. My previous chart only looked at ROI for retail miners. Here I show estimates for Bitmain (area plots) itself who pay less for their mining equipment than their customers. I also compare with retail miners (lines). The three lines/areas represent three different amortization periods for mining equipment: over 1 year (green), 1.5 years (blue) or 2 years (purple). The longer the period over which you spread your costs the less dependent you are on BTC price so long as your miner does not become obsolete before the write off period ends. previously I only considered a 1 year write off period.
Lastly after some research I determine the average lifespan of a miner is just 1 to 2 years (www.cell.com(18)30177-6).
Area plot: Bitmain
Line: retail
Elec: 0.06 USD/kWh
Model: Antminer S9
Hrate: 13.5 TH/s
Unit cost: USD 500 (Bitmain), USD 900 (retail)
Operating time: 24 hrs/day, 365 days/year
see: medium.com
see: www.cell.com(18)30177-6

BITMAIN: Antminer S-series Return on Investment (Bitcoin)Chart shows the return on investment of Antminer S-series miners:
S1 (yellow): approx released July 2013, power consumption 2 kW/TH/s
S3 (purple): approx released June 2014, power consumption 0.71 kW/TH/s
S5 (orange): approx released December 2014, power consumption 0.51 kW/TH/s
S7 (green): approx released Aug 2015, power consumption 25 kW/TH/s
S9 (blue): approx released July 2016, power consumption 0.1 kW/TH/s
Red curve is network hash rate (proportional to difficulty).
Chart of mining efficiency (TH/s/kW): drive.google.com (blue is actual trend, red is projected continuation of pre-S9 trend)
Bitmain has not publicly released any significant efficiency upgrades since July 2016. Innovation at the mining sector's biggest player seems to have stalled. If the exponential trend had continued we should have reached >40 TH/s/kW by Jan 2018, instead we are at 2016 levels. This is either because Bitmain cannot make more efficient ASICS or because they are keeping secret any innovations they have made.
Looking at the return on investment (ROI) chart. The white horizontal line is the breakeven line. Anything above is profit. The vertical lines are release dates of the various S-model miners. We see that a new miner is released to the public just when the previous model becomes obsolete. Normally there is a lead time before delivery of several months. Bitmain have not made any announcements regarding an S11.
Despite all of this the hash rate is increasing unabated. Have Bitmain been secretly mining with new hardware or have they simply been bringing more S9s online? If they have an S11 why aren't they releasing it?
Further reading
Bitmain now mines 42 % of the entire network bitcoinist.com
June 8 interview with the Bitmain CEO Jihan Wu fortune.com
This is where I explain how to calculate the conversion factor medium.com

One More Drop - Bitcoin Panic ZoneBitcoin price is going down for the past 6 months and still is.
The price zone between 5,000$ - 6,000$ considered as a safe zone in regards to mining costs,
below this price zone mining Bitcoin in most of the countries considered to be not profitable.
Having said that, the longer the Bitcoin traded at the 6,000$ price,
More and more news about Bitcoin mining and the cost of it started to pop up,
and it seems like the media is preparing us for another price drop.
All of a sudden the cost of mining Bitcoin was overestimated...
I am getting myself ready for the last drop,
The panic drop.
A drop that will confuse many will wipe many more and will cause panic.
My strategy is simple:
My Trade Size = X
I Buy Half X at 4,900$ (Bitfinex)
I Buy The Second Half at 4,500$ (Bitfinex)
My Stop Loss = X

BayHorse Silver potential massive breakout.consolidating on top of 3 year support zone. fundamentals have changed from speculator to producer with potential cash flow positive occurring this year. bears tired, divergences occuring on multiple high timeframes.

How much worse can it get? :(Learning to use trading view and also a little charting.
- Strong down trend with multiple resistance levels broken.
- Not enough bull volume on the way down to reverse
- hourly chat has come green at 0.01 and 0.012 but I don't think it is strong enough
How low can we go? :(
Ideas?
Looking for advice and tips along the way as I learn..

BTC MAGNETIC MEGASUPPORT REVERSAL. This is my BTC/USD forecast for the next months.
In crypto we know that timing may vary a lot faster than forex markets.
Anyhow I see those final low target for the bear market:
30% = 6000 $ AREA . DOUBLE BOTTOM AND REVERSAL
65% = 4970 $ AREA. MAGNETIC MEGASUPPORT REVERSAL WITH VARIOUS CONFLUENCES.
3% = 3000 $ AREA.
I cannot think at anything lower also because of the mining costs.
My best reversal point is 4970 $

BTC never under 5k and this is why !!!!BTC ECONOMIC BASIC
There are a lot of speculations that bitcoin would go to 3000... well those who tell you that don't have a clue what they are talking about. Bitcoin/altcoins can be compared to stocks/gold/silver etc. Now some of you will be shouting at me that it is not the same but this is just a example.
In this case we take a look at gold. To mine gold you need employees, materials and insurance etc. When you add all those things up you will get a price that you have to earn from selling the gold to at least break even with the costs of mining the gold.
This is the same as bitcoin mining. It takes a lot of energy to mine 1 bitcoin and the equipment is also pricey. The average costs to mine 1 bitcoin is 4700 - 4800 dollar. If bitcoin would drop below this price a lot of miners would shut their systems down. Only the big companies would be able to mine with a small profit. We think whales/major investors would never let this happen. If you see the price dropping beneath this price range... sell every single crypto you have because we are going to shut down!
This is just some basic economics. If it the costs to mine something are higher than the sold product... why should you do it?

Bitcoin S-curve with Mining History + Qualitative Hasing RateSome assumptions first:
Bitcoin follows an S-curve typical of many growing technologies (and sometimes even stocks/indices): Adoption chart
The exact gradients / inflexion points of the S-curve shown here is illustrative, as we cannot know its future development.
The hashing rate shown here (brown line) is completely illustrative and represents only the changing trend (which has been increasing or constant since 2010).
S-curves (which appear as exponential curves in linear charts) indicate a viral exchange of information which is typical of technology adoption and hype (this is where stocks/indices come in etc)
In the case of Bitcoin, although the rate of production is supposed to be constant (hence difficulty adjustment) and therefore cannot affect the price, there is a clear relationship between price development and the development of network hashing rate. The hashing rate develops with the evolution of the mining sector from 2010 hobbyist to 2018 industrialist.
The next big boom in Bitcoin will take place in conjunction with the next revolution in mining. There are some 4 million Bitcoins still left to mine. The next halving (block reward reduction to 6.25 BTC/block) is probable in summer 2020. But the halving is not necessary in order to start a new growth phase . In fact the previous two halvings occurred half-way through the growth cycle.
Some reading:
Controlled Supply
Evolution of Bitcoin Hardware
Bitcoin hashing rate
Bitcoin mining price 2015
Bloomberg mining price 2018
