MKR - Following the channel, Target hit Respecting the ascending parallel channel...for now. Not a bad idea to take profits.
MKR’s rally combines exchange-driven FOMO around its SKY migration, whale-driven liquidity shifts, and technical momentum. Watch for sustained volume above $200M (current: $207M) to confirm continuation, or profit-taking near $2,300 (161.8% Fib extension). Will the SKY transition sustain demand post-swap, or trigger a “sell the news” reversal?
MKRUSD

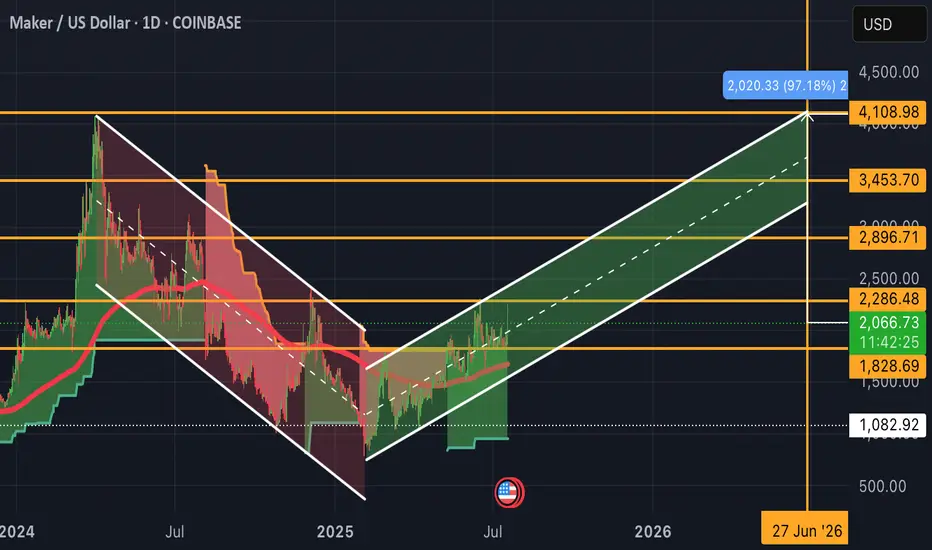
MKR-Setup for a Macro Bullish play, might take a year or soonerMacro Swing in play already. Literally give it a year to soak...or sooner.
200MA on the Daily is strong and reliable
Been Green SuperTrend and positive 200MA all of July.
SKY Token Transition: MakerDAO’s rebrand to Sky Protocol and the ongoing 1 MKR → 24,000 SKY conversion could tighten MKR supply as 43% of tokens remain unconverted. Staking SKY for 17% USDS rewards may incentivize long-term holding.
FRAX Integration: Plans to expand cross-protocol liquidity via Frax Finance could boost DAI demand, indirectly supporting MKR’s utility.
Real-World Asset (RWA) Collateral: MakerDAO’s $1B investment into tokenized loans via Grove Protocol diversifies revenue streams, potentially stabilizing MKR’s burn-mint equilibrium.
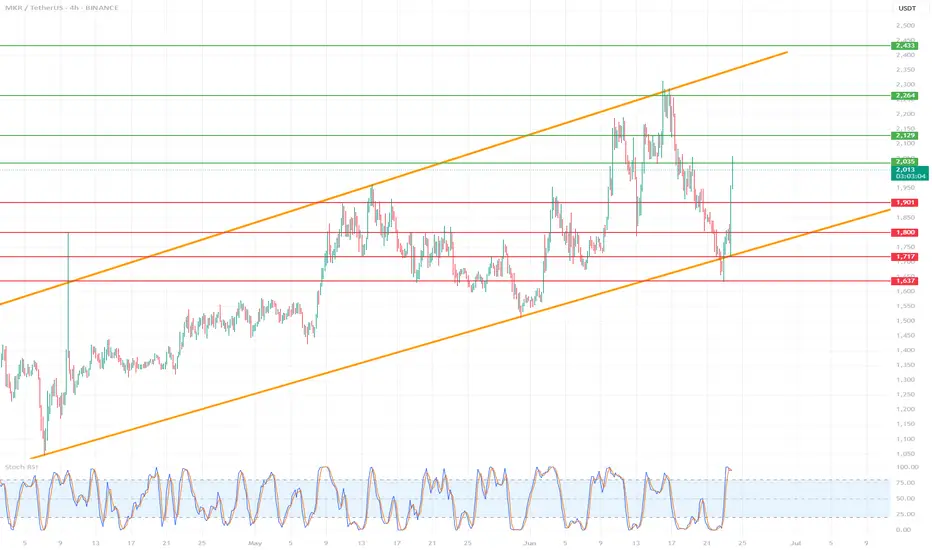
MKR/USDT (MakerDAO) on the 4H time frame🔷 1. Trend and market structure
🔸 Upward channel:
The price is moving in a wide, ascending channel (orange lines).
The lower line of the channel was last tested on June 22, 2025, which ended with a dynamic upward bounce.
The upper limit of the channel reaches around 2,450 USDT.
🕸️ Market phase:
In the short term, the market was in a downward correction phase within the uptrend.
Currently, we see a strong rebound from support - a new uptrend is possible.
🔷 2. Key horizontal levels (support/resistance)
🟥 Support:
1,637 USDT - local support (the lowest level of the red zone), almost tested at the bottom.
1,717 USDT - very technical support, tested several times.
1,800 USDT – psychological level and local consolidation.
1,901 USDT – last support peak, currently broken upwards.
🟩 Resistances:
2,003 USDT – current price level, currently tested as new resistance.
2,129 USDT – strong resistance from previous peaks.
2,264 USDT – previous swing high.
2,433 USDT – upper boundary of the channel and technical level from historical peaks.
🔷 3. Price and candle behavior
Strong demand reaction at the lower boundary of the channel: long pin bar/bull's embrace at the lower boundary.
The upward movement was dynamic and uniform, which indicates high buyer activity.
If the price stays above 1,901 USDT – further increases are possible.
🔷 4. Technical indicators
🔁 Stochastic RSI (4H):
Currently in the overbought zone, just below the level of 100 - a temporary correction or consolidation may occur.
However, with a strong upward trend, Stoch RSI may "stick" to the upper band - it does not yet give a clear S/S signal.
🔷 5. Technical scenarios
🟢 Bullish scenario (continuation of growth):
Condition: maintaining the level above 1,901 USDT.
Targets:
TP1: 2,129 USDT
TP2: 2,264 USDT
TP3: 2,433 USDT (upper limit of the channel)
Stop-loss: below 1,800 USDT
🔴 Bearish scenario (rejection of resistance):
Condition: strong rejection of 2,003 USDT and return below 1,901
Targets:
TP1: 1,800 USDT
TP2: 1,717 USDT
TP3: 1,637 USDT
SL: return above 2,003 USDT
🔷 6. Final remarks
The current upward movement looks like a "V-shape reversal" reaction - a sharp turnaround with dynamic volume suggests strong buyer interest.
The key will be the reaction to 2,003 USDT - a breakout and retest can give a very good long entry.
Short positions are risky as long as the price is in the lower half of the ascending channel.
MKR - @ $1800 support, monitor closely for bullish correction BTC dominance up, Alts down including MKR.
MACD getting stronger, histogram looking better on 4 hour TF
RSI coming up off low 30's
Volume stabilizing
You can see the ascending price channel for secondary support and resistance
Next bullish wave should bring back to top gold Resistance line and above to top parallel white line.

#MKR/USDT#MKR
The price is moving within a descending channel on the 1-hour frame, adhering well to it, and is heading toward a strong breakout and retest.
We are experiencing a rebound from the lower boundary of the descending channel. This support is at 2008.
We are experiencing a downtrend on the RSI indicator, which is about to break and retest, supporting the upward trend.
We are heading toward stability above the 100 moving average.
Entry price: 2333
First target: 2201
Second target: 2097
Third target: 2333

#MKR/USDT Ready to launch upwards#MKR
The price is moving in a descending channel on the 1-hour frame and is adhering to it well and is heading to break it strongly upwards
We have a bounce from the lower limit of the descending channel, this support is at a price of 1200
We have a downtrend on the RSI indicator that is about to be broken, which supports the rise
We have a trend to stabilize above the moving average 100
Entry price 1243
First target 1270
Second target 1311
Third target 1356

MKRUSDT 1D AnalysisMKR ~ 1D Analysis
#MKR Buy on retest of this support block with short term target of at least 10%++ from here.
MKR - Target hit for a 65%+ gainTook just 65 days for our target to execute for a 65%+ gain with peak selling near 80% gain.
Totally worth the wait.
Hope all is well. Took a few months off from posting here. I should be around more.
Have A Plan and Stick To It

MKR Looks Bearish (1D)The correction of MKR seems to have started from the point marked START on the chart.
This correction appears to be a diametric pattern, and we are now in the late stages of wave F, which has been a bullish wave.
It is expected that from the red zone, wave G a bearish wave will begin.
The closure of a daily candle above the invalidation level will invalidate this analysis.
For risk management, please don't forget stop loss and capital management
Comment if you have any questions
Thank You

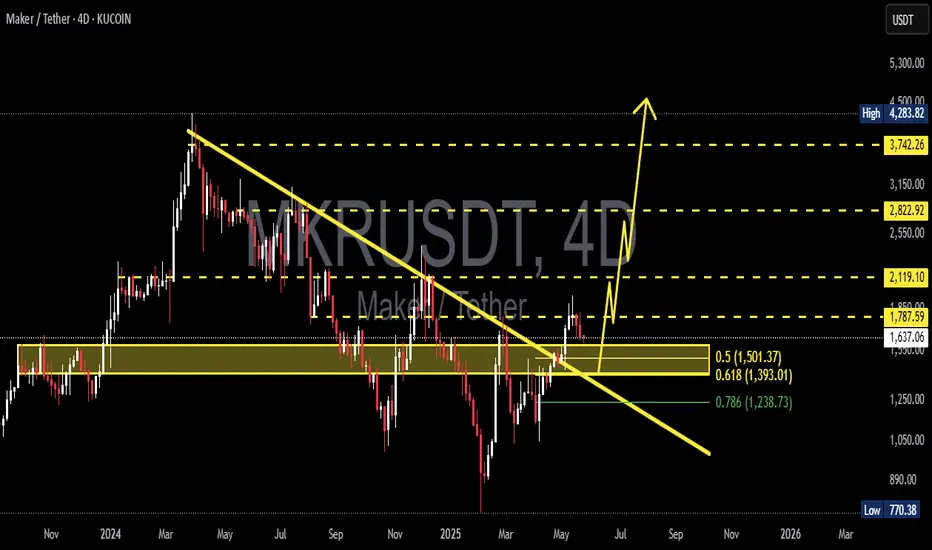
Potentially a good time for LONG MKR/USDHello everyone, let's look at the 1W MKR to USD chart, in this situation we can see how the price created a lower low with the last drop, what is important is that now it goes up creating a new higher local high. What's more, we can see how the ema cross 50 and 200 approached each other, but the price exiting upwards should maintain a long-term upward trend. We can also see how the whole thing is moving in a descending triangle, but an exit from the yellow downward trend line upwards can give a new strong upward movement.
Let's start by defining the goals for the near future that it has to deal with, and here you can see how the price bounced off the first target:
T1 = 1631 USD
T2 = 2159 USD
Т3 = 3015 USD
Т4 = 3607 USD
As for support or potential stop-loss when opening a long, we need to consider a strong support zone from $1028 to $542, with the level around $790 being key, as it is our last lower low in declines.
The RSI and STOCH indicators show an attempt to break out of the local downtrend lines upwards, which may also have a positive impact on the next price movement.

MKR Update-A bit shy of target, still a 66% gain exactly on timeWe got very close to plotted $1828 target by March 1st as the recent peak ended up maxing out at $1798 before March 1st, still a great 66% gain from original call out price of $1090.

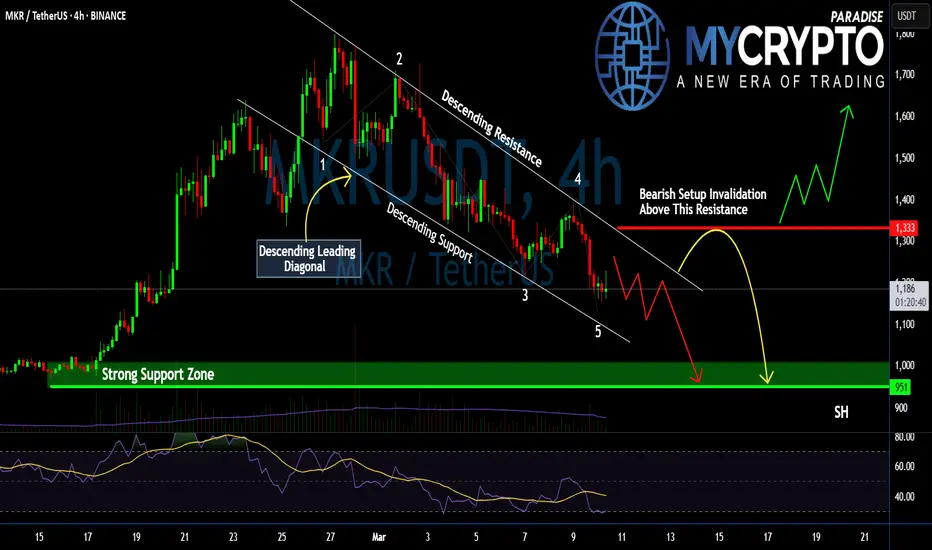
#MKR Bears in Control: Is a Breakdown Inevitable or Not?Yello, Paradisers! Is #MKR setting up for another leg down, or will the Bulls finally step in? The structure is clear; this could get ugly unless something changes soon. Let’s break down the #Maker setup:
💎#MKRUSDT is forming a Descending Leading Diagonal, a classic bearish pattern within a larger zigzag correction. This structure suggests that sellers remain in control, with each bounce being met by renewed selling pressure.
💎Price is currently reacting off the descending support near $1,160. While a short-term bounce toward $1,250 - $1,300 is possible, it remains within the bearish framework. The critical resistance to watch is at $1,333—a breakout above this level would invalidate the bearish setup and signal a shift in momentum.
💎If the bearish structure holds, the next leg down could take us to the strong support zone at $1,000 - $950. This is where buyers will have their last real chance to defend the trend. A failure to hold this level could open the door to a deeper correction.
💎RSI remains weak, showing no strong bullish divergence, signaling that momentum is still in favor of the sellers. The volume is declining, meaning the recent price action lacks strong buying conviction.
Strive for consistency, not quick profits. The market rewards discipline and patience—trade smart, Paradisers!
MyCryptoParadise
iFeel the success 🌴
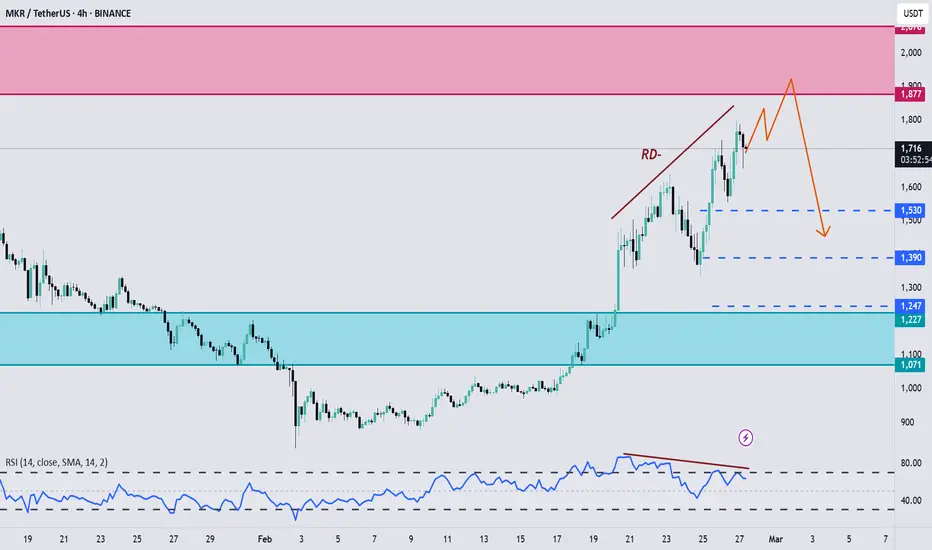
MKR, Ready for a short opportunity !!!Hello Traders, Hope you are doing great.
After a good upward movement that happened in last weeks, now it seems that bulls are going to lose their control and we'll probably see a downward correction after the price reaches to the specified supply zone, we also have regular divergences on 4H and Daily timeframes.
So for upcoming days I expect a slowly upward movement at first and after that Bears step in and cause a downward correction happen. Targets have determined by Blue dashed lines.
And finally Tell me What are your thoughts about MKR ? UP or DOWN ? comment your opinion below this post.
MKR ANALYSIS (2D)Before anything, pay attention to the timeframe. This is a 2-day timeframe, so it will take time.
From the point where we placed the red arrow on the chart, it seems that MKR's correction has begun.
It now appears to be in wave C. Buy/long positions can be considered in the green zone.
The target could be the red box.
A daily candle closing below the invalidation level will invalidate this analysis.
For risk management, please don't forget stop loss and capital management
Comment if you have any questions
Thank You

MKR - 68% profit coming up...maybe before March 1stMacro setting up for another bullish wave to retest $1830 for a 68%+ gain maybe as early as March 1st.
RSI a bit high near mid 50, MACD looking more bullish.
Top take profit for a 100% Fib correction would be at EUROTLX:4K for an estimated 280% return!

MKRUSD: Channel Down bullish wave starting.Maker has just turned neutral on its 1D technical outlook (RSI = 46.979, MACD = -66.220, ADX = 40.770) as it hit the bottom of the 1 year Channel Down and bounced. The 1D RSI shows that we are on a similar rebound as on the October 25th 2024 bottom but needs to be validated by a crossing above the 1D MA50.
The two bullish waves before that have posted a price increase of +127.15%, so there is no reason to expect otherwise if the 1D MA50 is crossed. Be ready to go long (TP = 1,780).
## If you like our free content follow our profile to get more daily ideas. ##
## Comments and likes are greatly appreciated. ##

A Critical Buy Zone – This Could Be HUGE for Long-Term InvestorsA Critical Buy Zone – This Could Be HUGE for Long-Term Investors!
“MKRUSDT is at a massive buy zone, and let me tell you – this could be a game-changer for long-term investors. The setup is there, the potential is enormous. Are you paying attention?
I may add this position at 800$-700$-600$ areas”
Here’s Why This Could Be a Monster Opportunity:
Higher Time Frame CDV Looks Strong – Big money is positioning, and you want to be on the right side of the trade.
Explosive Entry Zones – If lower time frame breakouts, CDV, and volume profile confirm, these boxes could be some of the most profitable entries we’ve seen.
Precision Trading Wins – We don’t buy blindly. We wait for confirmation, then we strike with confidence. That’s how smart traders win.
Final Thoughts:
“This is setting up beautifully. I’m watching CDV, volume profile, and lower time frame structures like a hawk. No confirmation, no trade. But when the green light comes? We go BIG.”
The opportunity is there. The market is giving us signals. Now, let’s see if it delivers the big breakout we’re waiting for! 🚀🔥
Let me tell you, this is something special. These insights, these setups—they’re not just good; they’re game-changers. I've spent years refining my approach, and the results speak for themselves. People are always asking, "How do you spot these opportunities?" It’s simple: experience, clarity, and a focus on high-probability moves.
Want to know how I use heatmaps, cumulative volume delta, and volume footprint techniques to find demand zones with precision? I’m happy to share—just send me a message. No cost, no catch. I believe in helping people make smarter decisions.
Here are some of my recent analyses. Each one highlights key opportunities:
🚀 RENDERUSDT: Strategic Support Zones at the Blue Boxes +%45 Reaction
🎯 PUNDIXUSDT: Huge Opportunity | 250% Volume Spike - %60 Reaction Sniper Entry
🌐 CryptoMarkets TOTAL2: Support Zone
🚀 GMTUSDT: %35 FAST REJECTION FROM THE RED BOX
🎯 ZENUSDT.P: Patience & Profitability | %230 Reaction from the Sniper Entry
🎯 DEXEUSDT %180 Reaction with %9 Stop
🐶 DOGEUSDT.P: Next Move
🎨 RENDERUSDT.P: Opportunity of the Month
💎 ETHUSDT.P: Where to Retrace
🟢 BNBUSDT.P: Potential Surge
📊 BTC Dominance: Reaction Zone
🌊 WAVESUSDT.P: Demand Zone Potential
🟣 UNIUSDT.P: Long-Term Trade
🔵 XRPUSDT.P: Entry Zones
🔗 LINKUSDT.P: Follow The River
📈 BTCUSDT.P: Two Key Demand Zones
🟩 POLUSDT: Bullish Momentum
🌟 PENDLEUSDT.P: Where Opportunity Meets Precision
🔥 BTCUSDT.P: Liquidation of Highly Leveraged Longs
🌊 SOLUSDT.P: SOL's Dip - Your Opportunity
🐸 1000PEPEUSDT.P: Prime Bounce Zone Unlocked
🚀 ETHUSDT.P: Set to Explode - Don't Miss This Game Changer
🤖 IQUSDT: Smart Plan
⚡️ PONDUSDT: A Trade Not Taken Is Better Than a Losing One
💼 STMXUSDT: 2 Buying Areas
🐢 TURBOUSDT: Buy Zones and Buyer Presence
🌍 ICPUSDT.P: Massive Upside Potential | Check the Trade Update For Seeing Results
🟠 IDEXUSDT: Spot Buy Area | %26 Profit if You Trade with MSB
📌 USUALUSDT: Buyers Are Active + %70 Profit in Total
🌟 FORTHUSDT: Sniper Entry +%26 Reaction
🐳 QKCUSDT: Sniper Entry +%57 Reaction
📊 BTC.D: Retest of Key Area Highly Likely
This list? It’s just a small piece of what I’ve been working on. There’s so much more. Go check my profile, see the results for yourself. My goal is simple: provide value and help you win. If you’ve got questions, I’ve got answers. Let’s get to work!

#MKR/USDT#MKR
The price is moving in a descending channel on the 12-hour frame and is sticking to it to a large extent and it has been broken upwards and is being tested again
We have a bounce from the lower limit of the channel at a price of 1.43
We have an upward trend on the RSI indicator which supports the rise
We have a trend to stabilize above the moving average 100
Entry price 1.52
First target 1.74
Second target 1.95
Third target 2.22

MKRUSDT: Key Breakout or Major Reversal? Critical Zone in Play!Yello, Paradisers! Is this the moment where #MKRUSDT sets the stage for a powerful rally, or are we staring at the potential for a deeper plunge? The price is at a make-or-break level, and what happens next could shape the market trend for weeks to come.
💎Recently, #MKR faced a significant rejection at $2,143. Now, the price is approaching the $1,700–$1,800 zone, a crucial level that has historically acted as strong support. If bulls can step in and defend this area, keeping the price above $1,800, a sharp bounce could follow. Upside probable targets in this scenario would be around $2,300 and potentially as high as $2,900, confirming a bullish breakout and suggesting that a new leg of the uptrend is underway.
💎On the other hand, failure to hold the $1,700 support zone would signal weakness. A breakdown below this level could trigger a swift decline toward $1,400 and possibly even $1,200. Such a move would indicate a bearish reversal and allow bears to seize control of the market direction.
💎This is a critical juncture for #MKR. A strong bounce here could reignite bullish momentum, while a breakdown could lead to a significant reversal. As always, patience and disciplined risk management are essential. Let the price action confirm its direction before committing to any trades.
Trade smart, Paradisers. Consistency and strategy are the keys to long-term success. Stay focused and keep mastering the art of trading because that’s how winners are made.
MyCryptoParadise
iFeel the success🌴

Maker (mkr)Mkr usdt analysis
Time frame 4 hours
Risk rewards ratio >4 👈👌
Target 2200$
2 double curve ( pink and purple) price movement

MKR will soon become bullishFrom where we put the red arrow on the chart, the MKR correction has started.
It is approaching the cheap ranges after the deep correction.
We also have a liquidity pool at the bottom of the chart. It is expected that the pool will be swept and the price will retrace upwards after hitting the deand range.
Closing a daily candle below the invalidation level will violate the analysis
For risk management, please don't forget stop loss and capital management
Comment if you have any questions
Thank You

#MKR/USDT#MKR
The price is moving in a downward channel on the 4-hour frame upwards and is expected to continue
We have a trend to stabilize above the moving average 100 again
We have a downward trend on the RSI indicator that supports the rise by breaking it upwards
We have a support area at the lower limit of the channel at a price of 1.11
Entry price 1.19
First target 1.28
Second target 1.40
Third target 1.52

Maker (MKR) To the MoonMKR has successfully broken out of the bearish falling wedge pattern, signaling a positive outlook for a bullish movement. However, it’s important to note that MKR is currently at its first resistance level at 1,509. Considering that Bitcoin is also at a resistance point, there is a possibility of a correction toward the bullish trendline at 1,262 before continuing its upward trend to 1,727.
This analysis will be updated if new key levels are identified. Thank you.
